NEMATODE DIVERSITY IN A RANGE OF LAND USE TYPES
IN JAMBI BENCHMARK INDONESIA
I Gede Swibawa1 & Titik Nur Aeny1
ABSTRACT
Nematode Diversity in a Range of Land Use Types in Jambi Benchmark Indonesia. This study was conducted in Jambi Benchmark, Indonesia from May 2004 to March 2005. Out of 70 sampling points, 35 soil cores were taken from five land use types including forest less intensive, forest intensive, shrub, tree-based intensive, and crop-based less intensive. From each soil core, 300 ml of soil was extracted by flotation and centrifugation technique using sucrose solution. One hundred randomly picked nematodes from each sample were identified to genus level. The collected data were nematode abundance, number of genera, and trophic groups. The results showed that a total of 100 nematode genera within 31 families and 8 orders were found from soil samples of Jambi Benchmark. The abundance of total nematodes, bacterial feeding, and plant feeding nematodes were low in the intensive land use but high in less intensive land uses, i.e. shrub, intensive forest, and less intensive forest. There was no significant correlation between land use intensity and the diversity of nematode taxa. Nematode maturity indices were not sensitive enough to measure ecosystem disturbance caused by human intervention in Jambi Benchmark.
Key words: nematode abundance, nematode diversity, land use types, functional groups, Jambi
INTRODUCTION
Deforestation to many land-use types, namely shifting cultivation, plantation, crop system, and any other permanent agricultural systems, is considered as a disturbance effect on soil ecosystem. For example, the agricultural management practices, including cultivation, addition of chemical fertilizer, chemical pesticides and organic mulch, may affect the existence of soil fauna. Nematode community in soil is one of micro fauna that is very sensitive to any changes in soil environment (Freckman & Ettema, 1993).
Aboveground vegetation characteristics also affect the soil environmental condition. Differences in the aboveground vegetation types cause different effects on soil biota including nematode community. Many ecological indices of soil nematode community can be used as indicators of soil environment quality.
Nematode community in the soil ecosystem has various roles such as plant feeders, microbial feeders, fungal feeders, omnivores, and rotifers, and predators. Free-living nematodes consist of bacterial feeders that feed on bacteria and microflora; fungivores that feed on fungi; predators that feed on protozoan and small animals (zooplankton); omnivores that feed on fungi,
bacteria, algae, protozoan, and rotifers and plant parasitic nematodes that feed on plant roots and sometimes on plant shoots (Freckman & Baldwin, 1990). Soil micro food web of soil organic matter decomposition by acting as micro predator of decomposing microbes (Yeates et al., 1993).
A lot of land use changes from a forest to more intensive agricultural systems have been occurred in several provinces in Indonesia, including Lampung (Swibawa, 2001) and presumably also in Jambi. Reports concerning the effect of land use changes to soil biota, especially soil nematodes, are still limited. Therefore, this study was conducted to determine the effect of land use changes from forest to intensive agricultural systems on the diversity of taxonomic and functional groups of soil nematodes.
MATERIALS AND METHODS
Field Sites. The study was conducted in Muara Bungo District, Jambi Province of Indonesia. Jambi benchmark has three windows. The first window was located in Kuamang Kuning (S 01o 36’ 32.2’’ to 01o 37’ 06.1’’ and
E 102 o 17’ 01.7’’ to 102 o 17’ 42.3’’), the second window
was in Muara Kuamang (S 01o 34’ 12.1’’ to 01 o 34’
1 Department of Plant Protection, University of Lampung
52.8’’ and E 102 o 15’ 05.4’’ to 102 o 15’ 59.7’’); and
the third window was in Rantau Pandan (S 01o 39’ 03.2’’
to 01 o 40’ 07.6’’ and E 101 o 56’ 05.4’’ to 101 o 56’ 52’’).
Muara Bungo District has an altitude range of 36-80 m a.s.l. and average rainfall of 2149-3012 mm/year, while Rantau Pandan lies at 75-100 m a.s.l. and has an average rainfall of 2926-3146 mm/year. The average air temperature in Jambi Benchmark is 27.1ºC in July and 30.4ºC in September. The soil types are Destrudepts in Muara Kuamang, Hapludults in Kuamang Kuning and Kandiudults in Rantau Pandan, respectively (Afandi, 2004). Jambi Benchmark comprises five land use types. They are undisturbed forest (forest less intensive=FLI), disturbed forest (forest intensive=FI), imperata grassland (Shrub=S), monoculture oil palm and rubber (tree-based intensive=TBI), and cassava crop (crop-based less intensive=CBLI). Among the five land use systems, CBLI was assumed to be the most intensive land use with cassava as the main crop. The FLI and FI were located in Muara Kuamang and Rantau Pandan window, while TBI, Shrub, and CBLI were in Kuamang Kuning. Soil samples were taken during rainy season, from May to June 2004. Seventy sampling points were selected by grid syst em (Afandi et al., 2005, unpublished). Out of 70 sampling points, 35 soil cores were selected for nematode study. Within a sample point, 12 soil cores were collected around the monolith center (Murwani et al., 2005, unpublished) by drawing two vertically crossed lines and two circles with 3 m and 6 m radius, respectively. Four sampling cores in the small circle and eight cores in the large one were taken from 20 cm depth using a garden spoon. The 12 soil cores were uniformly bulked to form a composite sample, and 500 g was then taken for nematode extraction. Samples were placed in plastic bags and sealed to avoid desiccation, but kept out from direct sunlight. Soil samples were transported in an insulated box within an air conditioned vehicle to laboratory before further processing.
Nematode Analysis. Laboratory processes including extraction, fixation, counting, mounting, and identification of nematodes were conducted from July 2004 to March 2005, at the Laboratory of Plant Nematology and Bacteriology, Department of Plant Protection, Lampung University. The laboratory analyses were done followed the method described by Huang & Cares (2003, unpublished) with some modifications. A soil sample unit consisted of 300 ml soil. Extracted nematodes were killed by hot water at 60ºC, fixed by Golden solution, and finally stored in 3% of formalin (Hopper, 1970).
The nematode suspension was adjusted to a final volume of 15 ml. The nematode population was counted under a stereo dissecting microscope from a randomly pipetted 3-ml suspension which was subsequently diluted five times. The total number of nematode was calculated as the mean of three counts multiplied by five.
Seinhorst’s method (Seinhorst, 1959) was applied by glycerin infiltration process before nematodes were mounted on slides. The nematode suspension was reduced to 3 ml, added with 7 ml of Seinhorst I solution in a 5 cm Petri dish, and then incubated at 43ºC in a desiccators for overnight, resulting in the reduction of the nematode suspension to half of the initial volume. The suspension was then added with Seinhorst II solution to reach a volume of 10 ml and reincubated in the desiccators for overnight. The process was repeated three times. At the end of the process, one hundred nematodes were randomly picked up and mounted on slides, ready to be identified.
Nematode identification to a genus level was done under a compound microscope at 400 to 1000x magnification. The references for identification were Goodey (1963), Mai & Lyon (1975), Siddiqi (1986) and Andrassy (1993). The nematodes genera were grouped into trophic groups which consisted of plant feeders (PF), fungal or hyphal feeders (FF), bacterial feeders (BF), animal feeders or predator (AF), and omnivores (Om) (Yeates at al., 1993).
Five diversity indices and five maturity indices were computed for the nematode community in each soil sample. The five diversity indices included (i) species richness index (d=(S-1)/log N, where S=number of genera, and N=total number of nematodes), (ii) Simpson’s diversity index (Ds=1-Σ(pi)2, where
pi=percent of genus “i” in the total abundance), (iii) Shannon-Wiener’s diversity index (H’= - Σpi ln pi, where pi=percent of genus “i” in the total abundance), evenness of Simpson’s diversity index (Es=Ds/Dsmax, where Dsmax =1-1/S, where S= number of genera), (iv) evenness of Shannon=Wiener’s diversity index (J’=H’/H’max =ln S), and (v) trophic diversity index (T=1/Σ(pi)2, where pi=relative abundance of trophic
genera referred to their families (MI2-5) (Bonger, 1990). Maturity indices (MI, PPI, and ΣMI) to indicate the soil disturbance levels were calculated by a formula: Σ vi x fi (where: vi=CP value from 1 to 5 for genus “i”, and fi=relative frequency of genus “i”). The calculation for MI2-5 was the same as for MI, but the genera of nematode with CP-1 were excluded. The value of MI2-5 was used to evaluate pollution-induced stress factors and PPI/MI ratio was used to assess soil fertility (Bongers & Bongers, 1998). The relative abundance of the first three groups in the nematode community was expressed as FF/BF ratio, and (FF+BF)/PF ratio (Yeates et al., 1993).
Statistical Analysis. Univariate analyses of variance (ANOVA) with five sampling points as the replication was applied on the data set. Mean separation was done using Duncan’s Multiple Range Test. Mean differences with Pr>F = 0.05 were considered significant.
RESULTS AND DISCUSSIONS
There were 100 genera within 31 families and eight orders of soil nematodes collected from five land use types in Jambi Benchmark (Table 1). The eight orders were Araeolaimida (3 genera), Dorylaimida (13 genera), Enoplida (1 genus), Monhysterida (3 genera), Mononchida (4 genera), Rhabditida (40 genera), Triplonchida (1 genus), and Tylenchida (35 genera). Thirteen genera were found in four land use types, but they were absent in certain land use type: Thornia and
Filenchus were absent on CBLI; Pellioditis and
Tylenchulus were absent in TBI; Mesodorylaimus,
Iotonchus, Mononchus, Rhabditel la, and
Criconemella were absent in Shrub; and Cruznema,
Discocriconemella, Tylenchorhynchus, and
Paratylenchus were absent on FI. As high as 46 genera
that each of which was found from one land use type alone and the 31 remaining genera occupied two or three land use types.
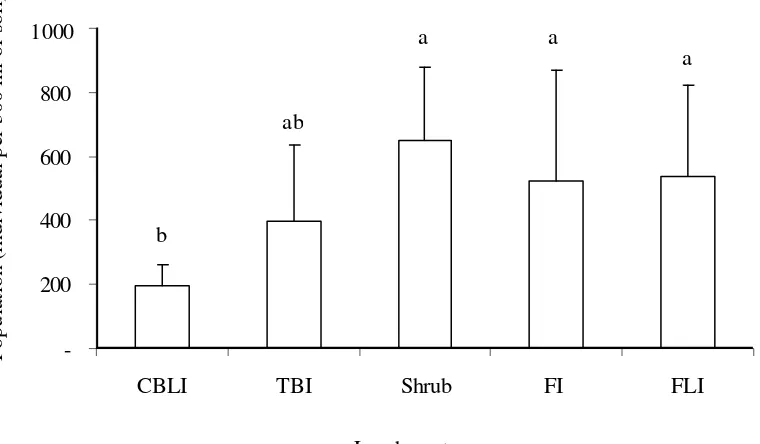
Nematode Abundance. The effect of land use types in Jambi Benchmark on soil nematode abundance (number of individual per 300 ml of soil) was significantly different (Pr F = 0.04). The average number of soil nematode tended to be lower in more intensive land use (CBLI and TBI) than that in less intensive land use types (Shrub, FI, and FLI). The number of soil nematodes found in TBI land use was not significantly different from that in CBLI nor the three other land use types (Figure 1). This result indicated that intensity of
human intervention such as cultivation activity in CBLI land use (cassava crop) may suppress the nematode abundance. This result was related to the fact that soil nematode is very sensitive to environmental disturbance (Freckman & Ettema, 1993), and therefore the abundance of soil nematode in Shrub was higher than that in CBLI and TBI (Yeates, 1996; Swibawa, 2001; Swibawa et al.,2006).
The variability of nematode abundance across sampling points per land use type was given in Figure 2. The high-end of observable encounters were found in FI and FLI, whereas the low-end of the catch was found in CBLI and TBI. The highest catch was collected from disturbed forest and the lowest catch was in cassava-based and tree-cassava-based land use types. The nematode abundance in TBI and FLI was quite diverse across sampling points, ranged from 100 to 800 individual per 300 ml soil on TBI, and ranged from 200 to 1100 individual per 300 ml soil in FLI.
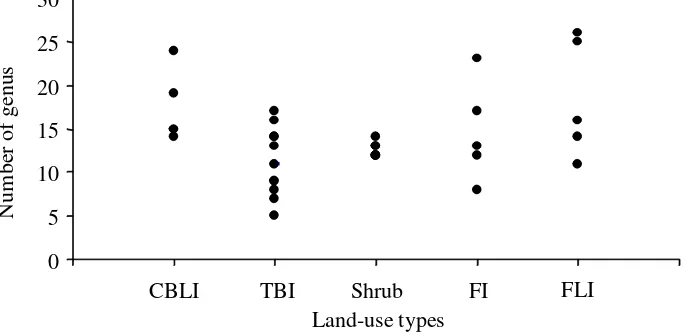
Nematode Diversity. The total number of nematode genera inhabited the land use types in Jambi Benchmark ranged from 37 to 51. The highest total number of genera was found in CBLI and the lowest in FI. TBI, Shrub, and FLI had 42, 45, and 48 genera, respectively. The average number of nematode genera in different land use types ranged from 11 to 18, and was significantly affected by the land use types (P < 0.05). In CBLI there were 17 genera and in FLI 18 genera, which were significantly higher than that in TBI (11 genera) (Figure 3). Although CBLI showed a higher number of genera, the nematode abundance was the lowest compared to the other land use types (Figure 1). The range of nematode genera number in TBI and FI varied, from 5 to 17 and 8 to 23 genera, respectively (Figure 4). The FLI had sampling points with the highest number of genera (26) compared to the other sampling points. The number of soil nematode genus in Shrub ranged from 12 to 14 per sampling point.
Based on Yeates et al. (1993), soil nematodes can be classified into five groups, namely bacterial feeder, fungal feeder, plant feeder, omnivore, and predator. Out of 100 genera collected from Jambi Benchmark, 41 genera were bacterial feeders, 3 genera were fungal feeders, 34 genera were plant feeders, 11 genera were omnivores, and 11 genera were predators (Table 1). The bacterial feeding and plant feeding nematodes were two of feeding groups with the highest number of genera as well as the highest abundance.
Table 1. The nematode orders and genera, colonizer-persister (CP) value, and feeding group (FG) found in five land use systems (LUS) in Jambi Benchmark
No. Genus CP1 FG2 LUS3 No. Genus CP1 FG2 LUS3
I. Ordo: Araeolaimida Ordo: Rhabditida (continued)
1 Aphanolaimus 3 1 1 39 Pellioditis 1 1 1,3,4,5
2 Chronogaster 2 1 4 40 Phasmarhabditis 1 1 3,5
3 Plectus 2 1 3 41 Pelodera 1 1 1,3,5
II. Ordo: Dorylaimida 42 Protorhabditis 1 1 3,5
4 Amphydelus 4 1 1 43 Rhabditella 1 1 1,2,4,5
5 Xiphinema 4 3 1,3,5 44 Rhabditis 1 1 1,2,3,4,5
6 Swangeria 5 4 1,2,4 45 Rhabditoides 1 1 1
7 Aporcelaimus 4 4 3 46 Rhitis 1 1 1,4
8 Dorylaimus 4 4 1,2,3,4,5 47 Rhomborhabditis 1 1 1,2,3
9 Eudorylaimus 4 4 5 48 Stomachorhabditis 1 1 5
10 Longidorella 4 4 1,2,3,4,5 49 Xylorhabditis 1 1 1,4
11 Longidorus 4 4 1 50 Metaterocephalus 3 1 5
12 Lordellonema 4 4 2 51 Butlerius 1 5 1,2,4
13 Mesodorylaimus 4 4 1,2,4,5 52 Diplogaster 1 5 1,3
14 Miranema 4 4 4,5 53 Diplogasteritus 1 5 3
15 Mylodiscus 4 4 4 54 Diplogasteroides 1 5 3,5
16 Thornia 4 4 3,4,5 55 Dirhabdilaimus 1 5 1
III. Ordo: Rhabditida 56 Mesodiplogasteroides 1 5 5
17 Rhabditophanes 1 1 3 IV. Ordo: Triplonchida
18 Acrobeloides 2 1 2 57 Trichodorus 4 3 1,2,4
19 Cephalobus 2 1 3,4 58 Aphelenchus 2 2 1,2,3,4,5
20 Eucephalobus 2 1 3,4 59 Aphelenchoides 2 2 1,2,4
21 Placodira 2 1 3 60 Ditylenchus 2 3 3
22 Rhabditolaimus 1 1 1 61 Criconemella 3 3 1,2,4,5
23 Tylopharinx 1 1 4 62 Discocriconemella 3 3 1,2,3,5
24 Cephaloboides 1 1 1 63 Hemicriconemoides 3 3 1,3,5
25 Diploscapteroides 1 1 1,3 64 Histotylenchus 3 3 3
26 Anguilluloides 1 1 1,3,4 65 Nagellus 3 3 4
27 Panagrellus 1 1 2,5 66 Tetylenchus 3 3 2,5
28 Panagrobelus 1 1 1,2,5 67 Tylenchorhynchus 3 3 1,2,3,5
29 Panagrolaimus 1 1 1,2,3,4,5 68 Heterodera 3 3 1
30 Plectonchus 1 1 3 69 Antarctylus 3 3 5
31 Bursila 1 1 4 70 Helicotylenchus 3 3 1,2,3,4,5
32 Caenorhabdithis 1 1 1 71 Rotylenchoides 3 3 1,2,3
33 Choryorhabditis 1 1 4 72 Rotylenchus 3 3 2,3
34 Cruznema 1 1 1,2,3,5 73 Scutellonema 3 3 1,5
35 Curviditis 1 1 3 74 Meloidogyne 3 3 1,2,3,4,5
36 Mesorhabditis 1 1 4 75 Paratylenchus 3 3 1,2,3,5
37 Operculorhabditis 1 1 3 76 Pratylenchoides 3 3 1,5
Figure 1. Nematode population (individual per 300 ml of soil) in five land use types in Jambi Benchmark CBLI=cassava-based less intensive, TBI=tree-based intensive, Shrub=imperata grassland, FI=forest intensive or disturbed forest, FLI=forest less intensive or undisturbed forest). Bars followed by the same letter were not significantly different at 5% level
Land-use types Tabel 1 (continued)
No. Genus CP1 FG2 LUS3 No. Genus CP1 FG2 LUS3
Ordo: Tylenchida (continued) Ordo: Tylenchida (continued)
78 Pratylenchus 3 3 3,5 91 Tylenchida Mg-2 2 3 1,2,5
79 Hoplotylus 3 3 1,2,3,4,5 92 Tylenchida Mg-3 2 3 5
80 Rotylenchulus 2 3 1,2,3,4,5 VI. Ordo: Enoplida
81 Duotylenchus 2 3 3 93 Enoplida Mg-1 ? 5 1,5
82 Basiria 2 3 5 VII. Ordo: Monhysterida
83 Filenchus 2 3 2,3,4,5 94 Monhysteridae Mg-1 1 1 3
84 Miculenchus 2 3 4 95 Monhysteridae Mg 2 1 1 3
85 Polenchus 2 3 1,3,5 96 Monhysteridae Mg 3 1 1 4
86 Tylenchus 2 3 1,2,3,4,5 VIII. Ordo: Mononchida
87 Troponema 2 3 4 97 Bathyodontus 4 5 1
88 Tylenchulus 2 3 1,3,4,5 98 Iotonchus 4 5 1,2,4,5
89 Tylodorus 2 3 2,4,5 98 Mononchus 4 5 1,2,4,5
90 Tylenchida Mg-1 2 3 5 100 Mononchida Mg-1 4 5 1
1
CP taxa 1 to 5 (Bongers, 1990). 2
FG: 1= bacterial feeder, 2=fungal feeder, 3=plant parasitic, 4=omnivore, and 5=predator (Yeates et al., 1993). 3
LUS : 1=crop-based less intensive, 2=tree-based intensive, 3=shrub, 4=forest intensive, and 5=forest less intensive.
-200 400 600 800 1.000
CBLI TBI Shrub FI FLI
Land-use types
P
o
p
u
la
tio
n
(
in
d
iv
id
u
a
l
p
er
3
0
0
m
l
o
f
so
b
a a
ab
a
P
opul
at
ion
(
indi
vi
dua
l
pe
r
300
m
l
o
f
soi
l)
0 5 10 15 20 25 30
CBLI TBI Shrub FI FLI
N
um
be
r
of
ge
n
u
s
Land-use types 0
5 10 15 20 25 30
CBLI TBI Shrub FI FLI
N
um
be
r
of
ge
nu
s
a
a
ab
ab b
Figure 3. The number of nematode genera in five land use types in Jambi Benchmark (CBLI=crop-based less intensive, TBI=tree-based intensive, Shrub=imperata grassland, FI=forest intensive or disturbed forest, FLI= forest less intensive or undisturbed forest). Bars followed by the same letter were not significantly different at 5% level
Figure 2. Variability of nematode abundance (individual per 300 ml of soil) in five land use types in Jambi Benchmark (CBLI=cassava-based less intensive, TBI=tree-based intensive, Shrub=imperata grassland, FI=forest intensive or disturbed forest, FLI=forest less intensive or undisturbed forest)
Figure 4. Variability of nematode genera number in five land use types in Jambi Benchmark (CBLI=cassava-based less intensive, TBI=tree-(CBLI=cassava-based intensive, Shrub=imperata grassland, FI=forest intensive or disturbed forest, FLI=forest less intensive or undisturbed forest)
- 200 400 600 800 1000 1200
0
CBLI TBI Shrub FI FLI
Land-use types
P
opul
at
ion
(i
nd
ivi
dua
l
pe
r
300
m
l
of
s
oi
l)
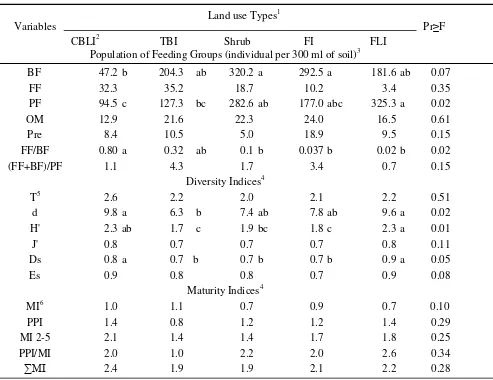
ratio of fungal feeders to bacterial feeders, but did not significantly affected the population of fungal feeders, omnivores, and predators (Table 2). Based on conversion of the relative abundance to the absolute abundance of soil nematodes in Jambi Benchmark, the population of bacterial feeders in CBLI was significantly lower (47.2±26.8 individual per 300 ml soil) than that in Shrub (320.2±207.1 individual per 300 ml soil) or FI (292.5±389.3 individual per 300 ml of soil). However, the population of bacterial feeding nematodes among TBI, Shrub, FI, and FLI land use types were not significantly different. The fungal feeding nematode population, ranged from 3.4 to 35.2 individual per 300 ml of soil, was not significantly different among the five land use types in Jambi Benchmark. Plant feeder nematodes were dominant in Shrub, FI, and FLI. CBLI had a significantly lower population of plant feeding nematode than that in FLI. The herbivore population was high on Shrub but not significantly different from that on FLI. The population of omnivores and predators were low (ranged from 13 to 24 individual) across all land use types in Jambi Benchmark. Meanwhile, the population of predatory nematode ranged from 5 to 19 individuals. These results indicated that the ecosystem of Jambi Benchmark was dominated by plant feeding and bacterial feeding nematodes. This fact is in accordance with Freckman & Caswell (1985) statement, that in most soil ecosystems, plant feeders and bacterial feeders are two largest functional groups of nematode community, followed by fungal feeders, then predators and omnivores. Yeates (1996) reported that the abundance of plant feeders and bacterial feeders were three fold higher than than that of other feeding groups of nematode community in pasture land use type. Tsiafouli et al. (2007) found that in the asparagus organic farming system bacterial feeders was dominant, comprising over 48% of the nematode community, while in conventional farming system plant feeders were 50%, followed by bacterial feeders (30%).
The land use types also significantly affected the ratio of fungal feeder to bacterial feeder. The ratio of fungal feeding to the bacterial feeding nematodes in CBLI was higher than that in Shrub, FI, and FLI, but was not significantly different from the ratio in TBI. The ratio of fungal feeders plus bacterial feeders to plant feeders, which ranged from 0.7 to 4.3, was not significantly different among the five land use types (Table 2). Sohlenius & Sandor (1987) stated that the ratio of fungal feeders to bacterial feeders (FF/BF) was an indicator of food chain decomposition. Bacteria-based food webs exhibit higher decomposition rates than fungi-based webs (Porazinska & Coleman, 1995).
Freckman & Ettema (1993) found that the ratio of FF/ BF was 0.54 for annual crops and 0.65 for perennial crops. Our result showed that the FF/BF ratio in CBLI was higher than that in Shrub, FI, and FLI, respectively. We assumed that fungal activity for organic matter docompositon was higher than bacterial activity on CBLI land use. In contrast, the activity of bacteria for organic matter decompositon was presumably higher than fungal activity in Shrub, FI, and FLI.
Nematode Diversity Index. Analysis of variance shows that trophic diversity index (T), evenness of Shannon-Wiener’s Diversity Index (J’), and evenness of Simpson’s Diversity Index (Es) of soil nematodes community in Jambi were not significantly affected by the land use types (Pr F > 0.05). However, species richness index (d), Shannon-Wiener’s Diversity Index (H’), and Simpson’s diversity Index (Ds) were significantly affected by the land use intensity (Table 2). The species richness in CBLI and on FLI were significantly higher than that in TBI. Shannon-Wiener’s diversity index of nematode community in CBLI and FLI was higher than that in TBI and FI. Shannon-Wiener’s diversity index of nematodes community in Shrub was not significantly different from the indices of the other land use types. Simpson’s diversity index of nematode community in CBLI and TBI was not significantly different but higher than that in FLI. Shannon-Wiener’s and Simpson’s diversity indices indicate species richness and evenness (Ludwig & Reynold, 1988). The Shannon-Wiener’s diversity index is based on common species, so that high index indicates high diversity of nematode (Krebs, 1985). Meanwhile, Simpson’s diversity index is based on rare species, so that low index indicates occurence of dominant species (Pielou, 1977). This implies that FLI and CBLI have high nematode diversity, while TBI have low nematode diversity. The average number of nematode genera in CBLI and FLI were 17 and 18, respectively, meanwhile the average number of nematode genera in TBI was 11. TBI, Shrub, and FI land use types may contain dominant genus, as indicated by low Simpson’s index. Three genera of nematodes, namely Panagrolaimus, Rhabditis, and Criconemella dominated these three land use types. Nematode community in TBI was dominated by Panagrolaimus (22%) and Rhabditis
(21%),while Shrub was dominated by Panagrolaimus
(37%) and FI was dominated by Panagrolaimus (33%)
and Criconemella (27%). Yeates (1996) reported that
Nematode Maturity Index. The maturity indices that consisted of maturity index of free-living nematodes (MI), maturity index of plant parasitic nematodes (PPI), maturity index of nematodes with CP from 2 to 5 (MI2-5), ratio of PPI/MI and maturity index of all nematodes (ΣMI) were not affected by the land use types in Jambi Benchmark (Pr F > 0.05) (Table 2). These data indicated that the disturbance among the
land use types in Jambi Benchmark was not significantly different. Bongers & Bongers (1998) stated that maturity index of free-living nematode (MI) can be used to measure agroecosystem disturbance and to indicate heavy metal pollution under agricultural conditions. Commonly, MI decreased and the PPI increased with increasing soil fertility (Bongers, 1999). Freckman & Ettema (1993) reported that MI is lower on annual
Table 2. Population of feeding groups, diversity indices, and maturity indices of soil nematodes across five land use types in Jambi-Benchmark, Indonesia
Land use Types1 Variables
CBLI2 TBI Shrub FI FLI
Pr≥F
Population of Feeding Groups (individual per 300 ml of soil)3
BF 47.2 b 204.3 ab 320.2 a 292.5 a 181.6 ab 0.07 FF 32.3 35.2 18.7 10.2 3.4 0.35 PF 94.5 c 127.3 bc 282.6 ab 177.0 abc 325.3 a 0.02 OM 12.9 21.6 22.3 24.0 16.5 0.61 Pre 8.4 10.5 5.0 18.9 9.5 0.15 FF/BF 0.80 a 0.32 ab 0.1 b 0.037 b 0.02 b 0.02 (FF+BF)/PF 1.1 4.3 1.7 3.4 0.7 0.15
Diversity Indices4
T5 2.6 2.2 2.0 2.1 2.2 0.51 d 9.8 a 6.3 b 7.4 ab 7.8 ab 9.6 a 0.02 H' 2.3 ab 1.7 c 1.9 bc 1.8 c 2.3 a 0.01 J' 0.8 0.7 0.7 0.7 0.8 0.11 Ds 0.8 a 0.7 b 0.7 b 0.7 b 0.9 a 0.05 Es 0.9 0.8 0.8 0.7 0.9 0.08
Maturity Indices4
MI6 1.0 1.1 0.7 0.9 0.7 0.10 PPI 1.4 0.8 1.2 1.2 1.4 0.29 MI 2-5 2.1 1.4 1.4 1.7 1.8 0.25 PPI/MI 2.0 1.0 2.2 2.0 2.6 0.34 ∑MI 2.4 1.9 1.9 2.1 2.2 0.28 1
values among land use types followed by the same letter were not significantly different according to DMRT at 5% level.
2
CBLI=crop-based less intensive, TBI=tree-based intensive, Shrub=imperata grassland, FI=forest intensive, FLI=forest less intensive.
3
conversion from relative population to absolute population. BF=bacterial feeders, FF=fungal feeders, PF=plant feeders, Om=omnivores, Pre=predators, T=trophic diversity index.
4
calculated based on relative population from approximately 100 individual sampled nematodes. 5
d=Species richness index, H’=Shannon-Wiener’s diversity index, J’=Evenness of Shannon-Wiener’s diversity index, Ds=Simpson’s diversity index, Es=Evenness of Simpson’s diversity index.
6
agroecosystem with high input than on perennial system with low input, PI is the highest on high input system and the lowest is in perennial system.
Our study in Jambi Benchmark showed that the maturity indices of nematode community were not powerful enough to indicate the disturbance of agroecosystem caused by human intervention. We assumed that intensity of human intervention such as tillage activity and application of chemical substances in Jambi Benchmark was still low, and therefore the disturbance level of agroecosystem was still within tolerable level that was not detected by maturiry indices of nematode community. Several reports by other investigators support our finding. Boag et al. (1998) reported that different management regimes of agroecosystem did not consistently affect nematode population. Similarly, Alphei (1998) found that MI is less powerful in natural forest site than that in land use systems heavily disturbed by human. Further, Neher
et al. (2005) stated that maturity index (MI) was inconsistent among different ecosystems so that they were unable to distinguish levels of disturbance.
CONCLUSIONS
A total of 100 nematode genera within 31 families and 8 orders were found in Jambi Benchmark. The abundance of total soil nematodes, bacterial feeding and plant feeding nematodes were low in the intensive land use (cassava crop-based land), but high in less intensive land uses (shrub, disturbed and undisturbed forest). There was no significant correlation between the increasing land use intensity and the diversity of nematode taxa. Maturity indices were not sensitive enough to measure ecosystem disturbance caused by human intervention in Jambi Benchmark.
REFERENCES
Afandi. 2004. Benchmark description: Benchmark and window level information. Progress report of
CSM-BGBD Project of Indonesia. Department
of Soil Science Faculty of Agriculture, The University of Lampung. Bandar Lampung. (Unpublished).
Afandi, Utomo M, & Susilo FX. 2005. Bio-Physical characterization of benchmarks areas of
CSM-BGBD Project in Indonesia. Preliminary Report
of CSM-BGBD Indonesia. (Unpublished).
Alphei J. 1998. Differences in soil nematode community structure of beech forest: Comparison between a mull and a moder soil. Applied Soil Ecology 9: 9–15.
Andrassy I. 1993. A taxonomic review of the suborder
Rhabditina (Nematode: Secernent ia).
ORSTOM, Paris. (Unpublished).
Boag B, Hebden PM, Nielson R & Rodger SJ. 1998. Observation on the effect of different management regimes of set-aside on nematode community structure. Applied Soil Ecology 9: 239–343.
Bongers T. 1990. The maturity index: an ecological measure of environmental disturbance based on nematodes species composition. Oecologica 83: 14–19.
Bongers T & Bongers M. 1998. Functional diversity of nematodes. Applied Soil Ecology 10: 239–251.
Bongers T. 1999. The maturity index, the evolution of nematode life history traits, adaptive radiation and cp-scaling. Plant and Soil 212: 13–22.
Freckman DW & Baldwin JG. 1990. Nematode. Pp 155–200 In: Dindal DL, eds. Soil Biology Guide. John Willy & Sons, Inc. New York.
Freckman DW & Ettema CH. 1993. Assessing nematode communities in agro ecosystems of varying human intervention. Agriculture
Ecosystem and Environment 45: 239–261.
Freckmant DW & Caswell EP. 1985. The ecology of nematodes in agroecosystems. Annual Review
of Phytopathology 23: 275–296.
Goodey JB. 1963. Soil and freshwater nematodes. Mathuen & CO LTD, London, John Wiley & Sons, INC, New York.
Hopper DF. 1970. Handling, fixing, staining, and mounting nematodes. Pp. 34–38 In: Southey JF, eds. Laboratory methods for work with plant
and soil nematodes, Commonwealth
Huang SP & Cares JE. 2003. Methodology for soil
nematode diversity evaluation. Department of
Plant Pathology Universidad de Brasilia. (Unpublished).
Krebs CJ. 1985. Ecology: The Experimental Analysis of Distribution and Abundance, Third edition.
Harper and Row Publisher, New York.
Lavelle P & Spain AV. 2001. Soil ecology. Kluwer Academic Publisher. Dordrect/Boston/London.
Ludwig JA & Reynolds JF. 1988. Statistical Ecology,
a Primer on Method and Computing. John
Wiley and Sons. New York, Chichester, Brisbane, Toronto.
Mai WF & Lyon HH. 1975. Pictorial key to genera
of plant-parasitic nematodes. Comstock
Publishing Associates, Cornell University Press.
Murwani S, Luth & Dewi WS. 2005. Diversity, abundance, and biomass of earthworm in a range of land-use type in Sumberjaya
Lampung, Sumatera, Indonesia. Preliminary
Report, CSM-BGBD Indonesia. (Unpublished).
Neher DA, Wu J, Barbercheck ME & Anas O. 2005. Ecosystem type affects interpretation of soil nematode community measures. Applied Soil
Ecology 30: 47–64.
Pielou EC. 1977. Mathematical Ecology. John Willey & Sons, New York.
Poranzinska DL & Coleman DC. 1995. Ecology of nematode under influence of Cucurbita spp. and different fertilizer types. J. of Nematology 27 (4S): 617–623.
Seinhorst JW. 1959. A rapid method for the transfer of nematodes from fixative to anhydrous glycerin.
Nematologica 4: 67–69.
Siddiqi MR. 1986. Tylenchida parasites of plant and
insect. Commonwealth Institute of Parasitology,
St. Albans United Kingdom.
Sohlenius B & Sandor A. 1987. Ploughing of a perenial grass ley-effect on the nematode fa una.
Pedobiologia 33: 199–210.
Swibawa IG, Aeny TN, Mashyuda I, Susilo FX & Hairiah K. 2006. Alih guna lahan hutan menjadi lahan pertanian: Keragaman dan kelimpahan nematoda. Agrivita 28(3): 252–266.
Swibawa IG. 2001.Keanekaragaman nematoda dalam tanah pada berbagai tipe tataguna lahan di
ASB-BECNHMARK AREA Way Kanan. J. Hama dan
Penyakit Tumbuhan Tropika 1(2): 54–59.
Tsiafouli MA, Argyropoulou MD, Stamou GP & Sgardelis SP. 2007. Is duration of organic management reflected on nematode communities of cultivated soils? Belg. J. Zool 137(2): 165– 175.
Yeates GW, Bonger T, De Goe RGM, Freckman DW & Georgieva SS. 1993. Feeding habits in soil nematode families and genera-an outline for soil ecologists. Journal of Nematology 25(3): 315– 331.
Yeates GW. 1996. Diversity of nematodes faunae under three vegetation types on a phallic soil in Otago, New Zealand. New Zealand Journal of Zoology