A Study of Knowledge Management System
Acceptance in Halo BCA
Emanuel A. K. Nugroho1, Jarot S. Suroso2, Puja Hanifah3
1,2,3Master in Information Systems Management, Bina Nusantara University
Jl. Kebon Jeruk Raya No. 27, Jakarta Barat 1[email protected]
Abstract—Contact Center is a form of Customer Relationship
Management, where customers can interact with a company through its single point of contact and serves mainly as a tool for the company to maintain its service to the customers. Contact center is generally operated by many Agents and can accept thousands of phone calls per day, depending on the company’s scale and customer base. In order to correctly serve the customers, Agents need to understand various knowledge the company has, and this is the main reason why Agents need to master the
company’s Knowledge Management System (KMS). Inability of
Agents in interacting with the KMS is considered as a serious problem for the company. In this paper, we discussed the acceptance of Halo Info, a KMS in Halo BCA. Halo BCA is the biggest banking contact center in Indonesia. We used modified TAM version 2, with a total of 11 variables, 31 indicators, and 12 hypotheses. The research instrument was a 31 items questionnaire. We gathered 283 respondent data, and analyzed it using PLS-SEM. The research findings are: Usage Behavior (UB) is significantly affected by Intention to Use (IU); IU is proven to be greatly affected by Perceived Ease of Use (PEU), Perceived Usefulness (PU), and Subjective Norm (SN); PEU is significantly affected by System Self-Efficacy (SSE) and Interface Usability (IUSB); PU is significantly affected by Job Relevance (JR) and PEU, but is not significantly affected by Output Quality (OQ), Image (I), Result Demonstrability (RD), and SN.
Keywords— TAM, Acceptance, KMS, Contact Center
I. INTRODUCTION
PT Bank Central Asia, Tbk (BCA) is the biggest privately owned bank in Indonesia. As of the end of 2017, BCA successfully generates a net profit of 23.3 trillion Rupiah, has credit portfolio of 468 trillion Rupiah, and could keep the gross Non-Performing Loan (NPL) in 1.5% [1]. At the end of 2017, BCA has served more than 17 million accounts, processed millions of transactions each day from its 1235 branch offices, 17658 ATM machines, and 470 thousand Electronic Data Capture (EDC) machines, and has 24-hour internet banking system and a mobile banking application.
In the process of maintaining relationship with customers, BCA needs to have contact center services which are always ready to fulfill customer’s needs, requests, or complaints. The contact center is branded as Halo BCA, which becomes the company’s representative to interact with the customers. As a form of Customer Relationship Management which has direct contact with customers, Halo BCA has to maintain and improve company reputation in the
customers’ perception.
Halo BCA is the largest banking contact center in Indonesia. It currently operated by more than 1500 Agents, working in shifts covering 24-hour operation, 7 days a week. Halo BCA serves about 20 until 25 thousand phone calls every day, equals to serving 13 phone calls every minute. This makes Halo BCA the busiest contact center in Indonesia.
Even with large call volumes, Halo BCA still needs to maintain its quality of services. Deriving from [2], Agents must maintain reliability, responsiveness, and assurance while giving service to customers during phone call. Reliability is when Agents can accurately perform services which are promised to customers. Responsiveness is when Agents show willingness in helping customers without delay. Assurance is when Agents are resourceful and able to generate trust and confidence between Agents and customers. For the Agent to show these three qualities, they have to master every knowledge in Halo BCA.
BCA has complex organizational structure, lots of employees, and many branch offices which are located in all cities in Indonesia. The sharing and distribution of knowledge from one part to another part of the company need to be conducted in a quick and effective way. Halo BCA needs to have access to all this information so it can provide the most updated and valid information to the customer and give the best services to the customer. This makes Knowledge Management System (KMS) a vital requirement for Halo BCA. They developed internal KMS called Halo Info for this purpose.
One thing which the company can do to prevent it is to develop highly skilled and resourceful Agents, and also provides them with the great tool. Halo Info contains all company’s knowledge. It gathers every information from all departments in the company. Any new information will also be updated to Halo Info. Therefore, this study aims to evaluate the acceptance of Halo Info to the Agents, to further define what factors prevent Agents in using Halo Info.
II. LITERATURE REVIEW
A. Knowledge and Knowledge Management System Knowledge is the information that can be use to do something [3]. Knowledge enable people to make better decisions and also give effective input in an organization dialogue or activity. Based on the form, knowledge can be categorized into structured, semi-structured, and unstructured. Example of structured knowledge is customer data, sales data, and financial data. Example of semi-structured knowledge is procedure, cases, and policies. Unstructured knowledge, for example is documents, email, presentation files, and video.
Knowledge Management System (KMS) is information system which is used to facilitate the sharing and mobilization of knowledge [3]. Organization process which are supported by KMS for example: knowledge creation, knowledge storage/retrieval, knowledge transfer, and knowledge application.
KMS in the contact center enable customer and company’s employees to search knowledge base, to find the answer of a query [4]. Advanced KMS will have features, such as authoring and another administrative features to create and manage the contents inside KMS. Advanced KMS will have features such as authoring and another administrative activity to create and maintain the contents inside KMS.
B. Technology Acceptance Model
Technology Acceptance Model (TAM) is one of research model about technology acceptance which is widely used [5]. In the TAM, there is perceived usefulness construct. This construct represents how people preference to use or not use a technology based on the assumption that by using that technology will improve their performance [6]. The next construct is perceived ease of use, which represents the confidence level of people that using a technology will need little effort. Construct attitude toward using represents the probability of people to use a technology, which eventually will decide if they will use the technology or not [7]. The attitude toward using is affected by two main constructs: perceived usefulness and perceived ease of use. Perceived ease of use will also affect perceived usefulness.
Technology Acceptance Model version 2 (TAM2) is a model which uses basic TAM model, but with the addition of subjective norm, voluntariness, and image, and also job relevance, output quality, result demonstrability, and perceived ease of use [8].
In this research, we considered between using TAM, TAM version 2, or TAM version 3. We thought that TAM version
1 or basic TAM, is just too simple and cannot explain the factors in details. TAM 3 has more details, in effect it will more costly in effort and time for data gathering. Therefore, we decided to use TAM version 2, and add additional two variables we predicted will affect perceived ease of use.
C. Past Researches
Previous researches have been conducted using Technology Acceptance Model. We gathered 13 previous researches which are relevant to our study. Some researches use basic TAM model, some use TAM2 and modified TAM2, and another researches tried to apply modified TAM on Knowledge Management System. We synthesize these researches to better support our research framework.
Some researches are related to TAM version 2 external variables. Job relevance is proven to have significant effect on perceived usefulness, and this can be observed from the researches of [8]–[11]. Output quality from some previous researches also proven to have significant effect on perceived usefulness, as can be seen from [8]–[11]. Image is proven to have significant effect on perceived usefulness from the research of [8], but another researches, [9] [10], prove it to be insignificant. Result demonstrability is proven to have significant effect on perceived usefulness from the researches of [8], [9], [11], but another research [10] prove it otherwise. System self-efficacy is proven to have significant effect on perceived ease of use, and this can be observed from the research of [12]–[15]. Subjective norm from [8], [9] is proven to significantly affect perceived usefulness, but some researches [10], [16] prove it insignificant. Three researches [8], [9], [16] suggest that subjective norm have significant effect on intention to use a system, even though one research [10] disagree with this.
The researches related to basic TAM models, can be summarized as below. Perceived ease of use is proven to have significant effect on perceived usefulness of a system. Some researches supporting this are [5], [8], [9], [11]–[13], [16], [17], but not [10]. Perceived ease of use is proven to significantly affect intention to use the system, supported by [8], [9], [12], [15], [17]–[19], but not supported by [10]. Perceived usefulness has significant effect on intention to use the system, supported by [5], [8]–[10], [12], [15], [17]–[19]. Furthermore, intention to use the system will significantly affect system usage behavior, as supported by [5], [8], [9], [16], [18].
We haven’t found previous study related to how perceived interface usability will affect perceived ease of use. But we argued that this construct will significantly affect perceived ease of use of a system, based on our own analysis and based on the theory of McGee et al [20].
III. RESEARCH METHODOLOGY
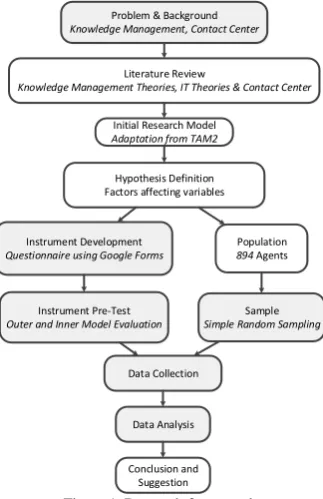
A. Research Framework
In the problem & background step, we defined the background on why we need to conduct this research. We gathered references and materials in the second step, literature review. The literature we use were mainly about technology acceptance, and knowledge management system. We designed the research model, based on TAM version 2, with two additional variables coming from social cognitive theory [12] and usability theory [20]. We developed 12 hypotheses, based on the relation between variables on the research model. From all 12 hypotheses, we choose relevant indicators which can represent each construct. We filtered all the indicators, from initial 44 indicators until became 33 indicators. The size of population which we studied were 894 Halo BCA Agents. We used simple random sampling using Slovin Formula [16], which require us to have a minimum of 277 respondent data.
Problem & Background Knowledge Management, Contact Center
Literature Review
Knowledge Management Theories, IT Theories & Contact Center
Hypothesis Definition Factors affecting variables
Initial Research Model Adaptation from TAM2
Instrument Development Questionnaire using Google Forms
Population 894 Agents
Sample Simple Random Sampling Instrument Pre-Test
Outer and Inner Model Evaluation
Data Collection
Data Analysis
Conclusion and Suggestion
Figure 1. Research framework
Then we conduct instrument pre-test using Google Forms questionnaire, on 30 random respondents. From the PLS-SEM calculation, we need to remove two indicators, leaving only 31 usable indicators. After the instrument is ready, we distribute the questionnaire through messaging software (Whatsapp) to the Agents’ Team Leader, to help us to distribute it down to the Agents in their team. We successfully gathered 283 clean data in just six days. And then we analyzed the data using PLS-SEM with the help of SmartPLS [21].
B. Halo Info
Halo Info runs on Microsoft SharePoint 2016. The KMS is a portal where Agent could access every information provided by all departments inside BCA. Halo Info can be accessed from all Halo BCA contact center sites (BSD, Jakarta, Menara Batavia, and Semarang). Figure 2 shows Halo Info user interface.
As one form of information retrieval tool, Halo Info has internal search engine, provided by the SharePoint. Figure 3 is the search results when we tried to find information using
keyword “klikpay”. We observed that the search engine does not provide suggestions when mistyped keywords occur, therefore users are required to type exact keywords on the search field.
Figure 2. Halo Info user interface
The management of information in the Halo info is strictly conducted, to make sure every information which is being given to the customer is valid. Halo Info team is the one who is responsible for this role. This team has roles to add, edit, and delete information inside Halo Info. Agent of Halo BCA cannot do any changes to the information inside Halo Info. In the Halo Info team, there are two roles: uploader and reviewer. Uploader has responsibility to collect information and store it in Halo Info. Reviewer’s role is to make sure these information is valid. Any information must be approved by reviewer before can be accessed by Agents.
Figure 3. Halo Info search results
In the early observation study, there are some problems which the Agents get from Halo Info. Some Agents complained that Halo Info is very slow while being accessed, the search result is not what the Agents expected, and the search process is not easy.
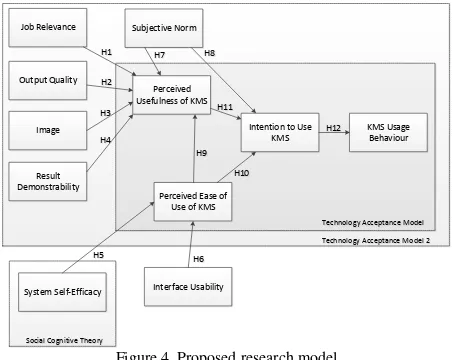
C. Research Model
[16]. Basic TAM constructs which will be adapted are Perceived Usefulness, Perceived Ease of Use, Intention to Use, and Usage Behavior. Meanwhile, the construct adapted from TAM2 are Subjective Norm, Image, Job Relevance, Output Quality, and Result Demonstrability. The construct of Experience and Voluntariness will not be adapted to this study’s research model.
Experience was not adapted, because this research was not conducted on different time ranges. Voluntariness was also not adapted, because the use of Halo Info is mandatory for all Agents. We considered that these two constructs could not be tested in our research.
This study will adapt System Self-Efficacy construct. This construct comes from Social Cognitive Theory and being adapted from the research of Tsai [12]. Tsai’s research proves that System Self-Efficacy positively affect Perceived Ease of Use.
McGee define some usability characteristics [20]. This construct will be adapted to the research model. Usability is defined as the perceived ease of using a system to do tasks. This construct is predicted to have significant effect on
Figure 4. Proposed research model
Figure 4 depicts the research model in this study. This study is different from previous research, because we added variable System Self-Efficacy and Interface Usability to the model. We predicted these two variables will significantly affect Perceived Ease of Use of KMS. This research is also the first to study the KMS acceptance of contact center Agents in a financial institution in Indonesia.
D. Population and Sample
In this study, population is all Agents of Halo BCA, specific for the regular, priority, correspondence, consumer credit, and video call services. As of mid January of 2017, the total Agents for all those services is 894. Sample is taken by using simple random sampling. With error rate of 5% and using Slovin formula [16], the number of sample needed is 277 Agents.
E. Hypotheses
The hypotheses for this study are based on the research model:
H4: Result Demonstrability will have a positive effect on Perceived Usefulness of KMS
H5: System Self-Efficacy will have a positive effect on Perceived Ease of Use of KMS
H6: Interface Usability will have a positive effect on Perceived Ease of Use of KMS
H7: Subjective Norm will have a positive effect on Perceived Usefulness of KMS
H8: Subjective Norm will have a positive effect on Intention to Use KMS
H9: Perceived Ease of Use of KMS will have a positive effect on Perceived Usefulness of KMS
H10: Perceived Ease of Use of KMS will have a positive effect on Intention to Use KMS
H11: Perceived Usefulness of KMS will have a positive effect on Intention to Use KMS
H12: Intention to Use KMS will have a positive effect on KMS Usage Behavior
F. Data Collection Instrument
At the initial step, we defined 44 indicators, derived from every variable represented. After a careful consideration, we reduced the number of indicators into just 33 indicators. Here is the list of variables and its indicators:
1. Job Relevance (JR)
a. JR1: Usage of Halo Info is important in my job b. JR2: Usage of Halo Info is relevant for my job
2. Output Quality (OQ)
a. OQ1: I get good information quality from Halo Info b. OQ2: There is no problem with the information
quality of Halo Info
3. Image (I)
a. I1: My colleague who uses Halo Info is more respected
b. I2: Usage of Halo Info is an important status in my work
c. I3: My colleague who uses Halo Info has more prestige
4. Subjective Norm (SN)
a. SN1: My team leader suggests me to use Halo Info b. SN2: My supervisor suggests me to use Halo Info
5. Result Demonstrability (RD)
a. RD1: I can easily tell the benefit of Halo Info to my colleagues
b. RD2: I believe I can tell the benefit of Halo Info to my colleagues
c. RD3: I can clearly see the benefit of Halo Info
6. System Self-Efficacy (SSE)
a. SSE1: I feel easy operating computers
b. SSE2: Computers make learning new things fun c. SSE3: I master how to use computer
Halo Info
f. SSE6: I understand the jargon used in Halo Info
7. Interface Usability (IUSB)
a. IUSB1: Menu in Halo Info is well organized b. IUSB2: Halo Info search result matches my
expectation
c. IUSB3: Information in Halo Info is easy to find d. IUSB4: Information in Halo Info is concisely
presented
8. Perceived Usefulness of KMS (PU)
a. PU1: Usage of Halo Info will improve my work performance
b. PU2: I think that Halo Info is useful in my job
9. Perceived Ease of Use of KMS (PEU)
a. PEU1: I can easily learn how to operate Halo Info b. PEU2: I can easily use Halo Info to do what I
expected
c. PEU3: I can interact clearly with Halo Info d. PEU4: I think Halo Info is easy to use
10. Intention to Use KMS (IU)
a. IU1: I will find the needed information in Halo Info b. IU2: Most of my search for information will be
conducted using Halo Info
c. IU3: I will continue on using Halo Info under possible situation
11. KMS Usage Behavior (UB)
a. UB1: To find information, I will use Halo Info b. UB2: I often use Halo Info to search for information
All of these indicators were put in Google Forms, using a Likert Scale from 1 – 5. Value 1 is for strongly disagree, 2 is for disagree, 3 is for neutral, 4 is for agree, and 5 is for strongly agree.
G. Data Analysis Tools
We used PLS-SEM to analyze the data, with the help of SmartPLS 3.2.7 [21]. There are several reasons why we choose to use PLS-SEM. In this research, we use 11 latent variables, with 33 indicators, and 12 hypotheses, which make the research model complex. PLS-SEM is the perfect tool to analyze complex structural model and model with cause-effect relations between latent variables [23]. Moreover, PLS-SEM is becoming more relevant to be used in management information systems and marketing related research.
Partial Least Square (PLS) is a powerful analysis method, and often be called soft modeling because it removes the assumptions of OLS (Ordinary Least Squares) regression, for example is when the data needs to be normally distributed in multivariate, and there is no multicollinearity problem between exogenous variables [24]. PLS is basically developed to test weak theories and weak data, for example is data which have small sample or data with normality problem. Although PLS often be used to describe relation between latent variables, PLS can also be used to test theories [24].
Structural Equation Modeling (SEM) is a modeling which enables researcher to include variables which are unknown, by measuring the variables indicators [25].
Meanwhile, Partial Least Square Structural Equation Modelling (PLS-SEM) or often be called PLS path modeling is a statistical path modeling which commonly be used to develop theories in exploratory research [25], [26]. PLS-SEM is more suitable to be used for prediction and theory development research [23].
Analysis in the PLS-SEM is conducted by analyzing two sub-models: measurement model/outer model, and structural model / inner model [24], [23]. Outer model shows how the manifest variables or observer variables represent the latent variables, therefore it can be measured. Outer model evaluation will be conducted to assess reliability and validity of the model. Structural model evaluation will show how strong is the estimation of relation between latent variables or constructs.
Outer model evaluation will be conducted by testing Convergent Validity and Discriminant Validity [24], [23]. Convergent Validity is related to the principle of which the measurements of a construct should have correlations. By using SmartPLS 3.2.7, testing of Convergent Validity can be conducted by comparing the value of loading factor of each construct indicators [21]. The loading factor should have a value of more than 0.7 for a confirmatory study, and more than 0.6 for an exploratory study. The value of Average Variance Extracted (AVE) should also be bigger than 0.5.
Test of Discriminant Validity is related to the principle of which the measurement of different constructs should not have high correlation. This can be conducted by comparing the value of cross loading. This value should be more than 0.7 for all constructs. Discriminant Validity can also be tested by comparing the square root of each construct’s AVE with the correlation value between constructs in the research model. Discriminant Validity is considered good if the value of square root AVE for each construct is bigger than the correlation between constructs.
Reliability test for constructs with reflective indicators in the PLS-SEM will be conducted using two methods: Cronbach’s Alpha and Composite Reliabilit y/Dillon-Goldstein’s [24], [23]. But it is suggested to use Composite Reliability, because the value of Cronbach’s Alpha tends to have lower value. The Composite Reliability value should be more than 0.7 for confirmatory study and more than 0.6 for exploratory study.
Inner model evaluation will be conducted by assessing the value of R-Squares for every endogenous latent variable, as it will predict the integrity of the structural model [24]. The value of R-Squares can be used to describe whether the exogenous latent variables have substantive effects to the endogenous latent variables. The model is considered strong if R-Squares value is 0.75, 0.5 is considered moderate, and 0.25 is considered weak. The evaluation of Q Squares predictive relevance can also be used [24], [23]. If the value of Q Squares is more than 0 (zero), the model is considered to have predictive relevance. If the Q squares value is less than 0 (zero), the model is considered not having predictive relevance. If Q Square value is 0.02, the model is considered weak, 0.15 moderate, and 0.35 means the model have strong predictive relevance.
testing can also be conducted by comparing p-value with the value of α. For this study, the confidence value is 95% (α = 0,05), so the t-table for two-tailed hypothesis is 1.96 [12]. Hypothesis is supported if t-statistic > 1.96 and p-value < α = 0.05.
IV. RESULT AND DISCUSSION
A. Instrument Pre-Test
Before the instruments is distributed to population, it needs to be evaluated for its reliability and validity [24], [23]. For this purpose, the questionnaire is given to 30 random Agents. The data are then being analysed using SmartPLS [21]. Validity is analysed using Convergent Validity and Discriminant Validity [24]. Convergent Validity is assessed using outer loading and Average Variance Extracted (AVE). Discriminant Validity is assessed using cross loading and Fornell-Larcker Criterion. Meanwhile Reliability is assessed using Cronbach’s Alpha and Composite Reliability.
In the first stage, the outer loading of the instrument is evaluated. All but five indicators have good outer loading value. The five indicators have lower than 0.7 values: I1 (0.575), I2 (0.605), PEU1 (0.579), SSE3 (0.668), and SSE6 (0.223). In the pre-test stage, the value of 0.5 – 0.6 is still acceptable [24], [23]. So the indicator SSE6 is removed because it has value of less than 0,5. Model was then being reevaluated using SmartPLS.
After SSE6 is removed, all outer loadings have passed value of 0.5. Therefore, the evaluation is continued to the cross loading. Almost all but one construct could predict indicators in the block better than in another block. But the value of indicator I1 is greater for the construct SN, so this indicator needs to be removed. The reevaluation of the model after the deletion of I1 showed the cross loading requirement is passed.
Discriminant Validity is also assessed using Fornell-Larcker Criterion. All Fornell-Fornell-Larcker Criterion in the instrument pre-test and the cross loadings have all been fulfilled, so the Discriminant Validity has been met.
The next evaluation is assessing AVE and Composite Reliability. Value of AVE for all constructs have passed 0.5, and outer loadings requirements have also been met, so the Convergent Validity is fulfilled.
The last evaluation for instrument pre-test is by assessing Cronbach’s Alpha and Composite Reliability. All constructs have met the required value of Composite Reliability > 0.7. But for Cronbach’s Alpha, there are two constructs: I and OQ whose value are less than 0.7. Cronbach’s Alpha values is considered under estimate, so the reliability testing will refer only to the Composite Reliability [24], [23]. Therefore, by only referring to Composite Reliability, the reliability of the instrument has been met.
B. Data Collection
The questionnaire was delivered to all Agents using Google Forms (http://bit.ly/2Dx2y5s). The collection process was conducted between 23 until 28 January 2018. Total data collected is 331 data. From all those data, 17 data (5.14%) are duplicates of another data, 23 data (6.95%) is not relevant, and 8 data (2.42%) is considered unmatched with target sample.
Based on the sexuality, 102 respondents (36.04%) are male, and 181 respondents (63.96%) are female. Based on the age, 52 respondents (18.37%) are less than 22 years old, 118 respondents (41.70%) are between 22 and 24 years old, 51 respondents (18.02%) are between 25 until 27 years old, and 62 respondents (21.91%) are more than 27 years old. Based on the education background, 227 respondents (80.21%) have bachelor degree, and 56 respondents (19.79%) have degree which is lower than bachelor degree. Based on the working duration in Halo BCA, 80 respondents (28.27%) have been working less than 3 months, 42 respondents (14.84%) have been working 3 – 6 months, 51 respondents (18.02%) have been working 6 – 12 months, 84 respondents (29.68%) have been working 12 – 24 months, and 26 respondents (9.19%) has been working for more than 24 months. Based on the contact center site / location, 147 respondents (51.94%) work in BSD site, 82 respondents (28.98%) work in Jakarta site, and 54 respondents (19.08%) work in Semarang site.
C. Model Evaluation
Outer model evaluation was conducted using several measurements [24], [23]: Internal Consistency Reliability, Indicator Reliability, Convergent Validity, and Discriminant Validity. Internal Consistency Reliability must be fulfilled with Composite Reliability value of 0.7. Indicator Reliability must be fulfilled with indicator outer loading value of 0.7. Convergent Validity must be fulfilled with Average Variance Extracted (AVE) value of more than 0.5. Discriminant Validity must be meet with cross loading and Fornell-Larcker Criterion.
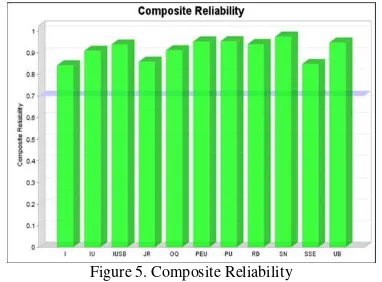
Figure 5. Composite Reliability
The above graphs shows the Composite Reliability (CR) of the data. As can be seen, CR values have all exceed 0.7. This means that all the data received is reliable.
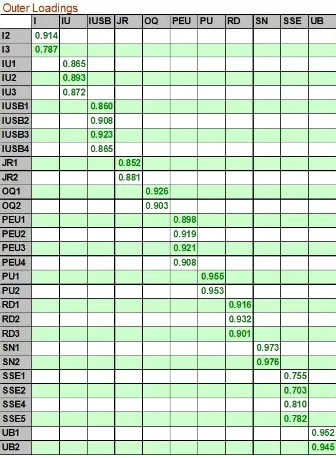
As can be seen on Table 1, the outer loading value of all indicators have exceed 0.7. This means that all indicators are able to well represent their own construct.
Figure 6. Average Variance Extracted (AVE)
Figure 5 shows AVE for all constructs. As can be seen, all AVEs exceed 0.5. This means that the Convergent Validity of the data has been fulfilled.
TABLE 2 FORNELL-LARCKER CRITERION
TABLE 3 CROSS LOADINGS
Table 2 shows that the correlation value of the latent construct (yellow) are always higher than the correlation of the latent construct with another latent construct.
Based on the Table 3, the value of indicator cross loadings are always higher for their construct (yellow colored) compared to the other construct. The cross loading and Fornell-Larcker Criterion have all been met, so the Discriminant Validity for the data is fulfilled.
Inner model evaluation is conducted using these measurement: R-Square (0.75 substantive, 0.5 moderate, 0.25 weak), t-values from bootstrapping, and predictive relevance using Q-Square [24], [23].
TABLE 4 RSQUARE
Table 4 shows the R-Square for the data. Based on the table, all endogenous construct can be classified as moderate, which means all exogenous constructs moderately affect endogenous construct.
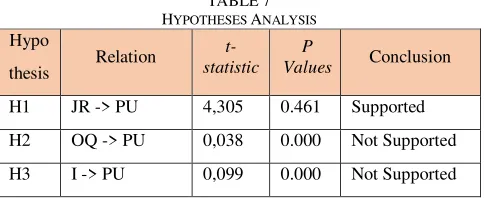
Table 5 shows value of t-statistic and P Values from each construct relation. These t-statistic values will be used in the hypothesis testing, to determine whether the construct relation is significant or not.
Table 6 QSQUARE
The value of Q Square in Table 6 determined whether the endogenous construct has predictive relevance. From the Table 6, all endogenous constructs have Q Square value above 0.35, which means all endogenous constructs in this research have strong predictive relevance.
D. Hypotheses Analysis
Hypotheses analysis was conducted by comparing the value of t-statistic to the value of t-table. Value which is being referred in t-table depends on the degree of freedom and confidence level. In this study, confidence level is 95% (α = 0,05). Total number of respondent (n) is 283 Agent. Number of independent variable (k) is 7 and number of dependent variable (l) is 4. By using those two values, degree of freedom (Df) is calculated 272. Value of t-table for two tailed hypothesis is 1.96 [23]. Hypothesis is supported if t-statistic > 1.96 and p-value < α = 0.05. The analysis results are listed in Table 7.
TABLE 7 HYPOTHESES ANALYSIS
Hypo
thesis
Relation
t-statistic P
Values Conclusion
H1 JR -> PU 4,305 0.461 Supported
H2 OQ -> PU 0,038 0.000 Not Supported
H3 I -> PU 0,099 0.000 Not Supported
H4 RD -> PU 1,27 0.000 Not Supported
H5 SSE -> PEU 6,063 0.485 Supported
H6 IUSB -> PEU 7,708 0.000 Supported
H7 SN -> PU 1,581 0.012 Not Supported
H8 SN -> IU 2,906 0.000 Supported
H9 PEU -> PU 2,25 0.102 Supported
H10 PEU -> IU 5,627 0.002 Supported
H11 PU -> IU 6,762 0.057 Supported
H12 IU -> UB 31,446 0.000 Supported
Halo Info is one of the systems which is needed by Agent of Halo BCA. All information which BCA has and can be shared to customers, will be stored and can be found in Halo Info. So Halo Info is a relevant system to be used by Agent. Agent also agree that Halo Info is useful for them. This can be concluded from the data gathered. The hypothesis is supported: Job Relevance (JR) significantly affect Perceived Usefulness of KMS (PU). This finding is consistent with four researches, conducted by [9], [10], [11], and [8].
Output Quality (OQ) is user perception on how well a system to finish its tasks [8]. Meanwhile, Perceived Usefulness of KMS (PU) is user perception where by using a system will improve their performance. Based on observation, Agent feedback on quality of information in Halo Info is varied. Most of them said the quality of information is good, but the other said it still need to be improved. Another consideration is that the usage of Halo Info is mandatory. Eventhough there are different feedback on the quality of information in Halo Info, it will not affect the perception of usefulness of Halo Info. In other words, despite the quality of information in Halo Info, it will not affect how the Agent perceived the usefulness of Halo Info. Agents have no alternative source of information other than information of Halo Info, despite the quality of information provided. The information is mandatory for they jobs. This research finding is not consistent with another four researches conducted by [9], [10], [11], and [8]. In their research, Output Quality is proven to have significant effect on Perceived Usefulness.
Image is the perception of how strong the usage of a system will improve someone’s status in a specific social system. In Halo BCA, the usage of Halo Info is mandatory and there will be no reward given to the Agent who use Halo Info more frequently compared to the others. This make the usage of Halo Info will not affect Agent’s social status. This result is consistent with the research [9], and [10], but is not consistent with [8].
System Self-Efficacy significantly affect Perceived Ease of Use of KMS. This result is consistent with the some previous researches [12]–[15].
Interface Usability (IUSB) is the perception of how usable the user interface of Halo Info. Usable can be defined as with little or minimal effort. As the perception of the usability of Halo Info user interface is higher, will make Halo Info easier to use. One of the reason why this phenomena is observed in Halo BCA, is because Agents need to do their work in a concise way. They hope that interacting with the user interface of Halo Info is with minimal effort, so they can get what they want easily. When they are facing user interface which is hard to use, they will also perceive that Halo Info is not easy to use. This can be seen from the analysis, that the Interface Usability significantly affect Perceived Ease of Use of KMS.
Based on the observation in Halo BCA, Team Leader and Supervisor are the ones who always remind Agents to use Halo Info. But by referring to the analysis, the Subjective Norm (SN) does not significantly affect Perceived Usefulness of Halo Info. One reason that can be provided is that all of the Agents have understood the function and purpose of using Halo Info. This makes how frequent the leaders remind them will not greatly affect how they perceive the usefulness of Halo Info. This result is consistent with some previous research such as [16], [10], but inconsistent with the research such as [8], [9].
Subjective Norm doesn’t significantly affect Perceived Usefulness of KMS, but it does significantly affect Intention to Use KMS (IU). By observing in the working area, the leaders always remind Agent to use Halo Info. And this significantly affects the Agent’s intention to use Halo Info. From this phenomena, we can conclude that the role of the leader will not greatly affect Agent perception of the usefulness of Halo Info, but it will greatly affect on their intention to use Halo Info. The reason which can be provided for this is that all Agents have agreed that Halo Info is useful for them, without considering how their leaders ask them to use it. When the leaders remind them to use Halo Info, will not change their perception of the usefulness of Halo Info, but it will make them more wanting to use Halo Info. This result is consistent with the research of [8], [16], [9] but is inconsistent with [10].
The ease of use of Halo Info will make Agent perceive that Halo Info is useful. This can be related to The Golden Rule for KMS by Tiwana [28], where a good KMS must be built and integrate with the user. KMS must be able to support and improve how the users work. The user should not be the one who adapt with the KMS. When Agent is faced with a system that is hard to use, will make them hard to do their job. This makes Agents see that the system is less useful for their job. Therefore, it can be concluded that the ease of use perception of Halo Info significantly affect the perception of usefulness of Halo Info. This result is consistent with [5], [8], [16], [12], [9], [11], [13], [17], but is inconsistent with [10].
As the ease of use perception of Halo Info is higher, the Agent will want to use Halo Info more. When they perceive that Halo Info is easy to use, they will not hesitate to use Halo Info. If they perceive that Halo Info is hard to use, will make them less wanting to use Halo Info. This result is consistent
with [8], [18], [12], [9], [15], [17], [19], but is inconsistent with [10].
As the usefulness perception of Halo Info is higher, will make the Agent intention to use Halo Info higher. When Agent perceive that Halo Info is useful for their job, will make their intention to use it higher. If the Agent perceive that Halo Info is useless, will make their intention to use lower. This result is consistent with [5], [8], [18], [12], [10], [15], [17], [19].
When the intention to use Halo Info is higher, will make Agent decide to use Halo Info. This means that the intention to use will eventually be the major factor for the Agent to actually use Halo Info. This result is consistent with [5], [8], [18], [16], [9].
E. Improvement for Halo Info
Based on the research result, and also from the field work, it is obvious that performance issue and easiness to use is the main concern for the Agents. So we recommend a few things to improve Halo Info and make it more acceptable to the Agents. The first thing is that the Halo Info search engine needs a lot of work to do, to make it reliable. Currently, when the Agents put some keywords which are clearly correct, the search results will return the intended information not on the first record. It usually appears on the fourth or fifth record. Sometimes it is worse, because it shows up on the next page. The search engine must be improved, must be able to track search which has high hit ratio. When many users input the similar keywords and finally found the intended information, Halo Info must be able to track this trend, and present it to the next query comes from another user. This way, Halo Info can give a more relevant result to the Agents.
The performance issue is the next thing that needs to be addressed by Halo BCA. When we tried accessing Halo Info, the web page loads not in the fastest way as how intranet web pages should be. Using a more modern browser such as Google Chrome helps the performance a little bit. It could be because Chrome will compress the web pages before transmission. Halo Info pages could be improved more, for example, by optimizing page size, Javascript file size, and also the image size. Halo BCA can also utilize AJAX to further improve page interaction, and also to reduce traffic overhead. This will help the content load faster, without a need to reload the whole page.
V. CONCLUSION
This research shows how modified TAM model can be used to explain technology acceptance specifically to contact center Agents in a financial institution. These research findings show that the basic TAM model is able to demonstrate the factors affecting Agents usage behaviour of the KMS (Halo Info). This research also explains additional factors affecting Agents intention to use Halo Info: how well Agents in using computer and Halo Info (self-efficacy), and how usable the Halo Info interface in the Agents mind (perceived interface usability). TAM version 2 external variables cannot explain some factors affecting perceived usefulness of Halo Info: subjective norm, output quality, image, and result demonstrability are insignificant. Additional research needs to be conducted on these four variables, to better explain the anomaly.
REFERENCES
[1] “BCA - PT Bank Central Asia Tbk Hasil Kinerja Tahun 2017 - Menjaga Kepercayaan Melalui Kualitas,” 2018. [Online]. Available:
https://www.bca.co.id/sitecore/content/BCACOID/Website/Tent ang-BCA/Korporasi/Siaran-Pers/2018/03/09/03/37/menjaga-kepercayaan-melalui-kualitas. [Accessed: 26-Apr-2018]. [2] a Parasuraman, V. a Zeithaml, and L. L. Berry, “SERQUAL: A
Multiple-Item scale for Measuring Consumer Perceptions of Service Quality,” J. Retail., vol. 64, p. 28, 1988.
[3] A. Jashapara, Knowledge Management: An Integrated Approach. Pearson Education Limited, 2004.
[4] D. Fluss, The Real-Time Contact Center. AMACOM, 2005. [5] V. Chooprayoon and C. Che, “TECTAM: An Approach to Study
Technology Acceptance Model (TAM) in Gaining Knowledge on the Adoption and Use of E-Commerce/E-Business
Technology among Small and Medium Enterprises in Thailand,” in E-commerce, InTech, 2010, pp. 31–38.
[6] F. D. Davis, “Perceived Ease of Use, and User Acceptance of Information Technology,” MIS Q., vol. 13, no. 3, pp. 319–340,
1989.
[7] M. Chuttur, “Overview of the Technology Acceptance Model: Origins , Developments and Future Directions,” Sprouts Work. Pap. Inf. Syst., vol. 9, no. 2009, pp. 1–23, 2009.
[8] V. Venkatesh and F. D. Davis, “A Theoretical Extension of the Technology Acceptance Model: Four Longitudinal Field Studies,” Manage. Sci., vol. 46, no. 2, pp. 186–204, Feb. 2000.
[9] M. Y. Wu, H. P. Chou, Y. C. Weng, and Y. H. Huang, “TAM2-based study of website user behavior-using web 2.0 websites as an example,” WSEAS Trans. Bus. Econ., vol. 8, no. 4, pp. 133–
151, 2011.
[10] W. G. Chismar and S. Wiley-Patton, “Does the extended technology acceptance model apply to physicians,” Proc. 36th Annu. Hawaii Int. Conf. Syst. Sci. HICSS 2003, 2003.
[11] G. Hart, M., & Porter, “The Impact of Cognitive & Other Factors on the Perceived Usefulness of OLAP.,” J. Comput. Inf. Syst., vol. 45, no. 1, pp. 47–56, 2004.
[12] C.-H. Tsai, “Integrating Social Capital Theory, Social Cognitive Theory, and the Technology Acceptance Model to Explore a Behavioral Model of Telehealth Systems,” Int. J. Environ. Res. Public Health, vol. 11, no. 5, pp. 4905–4925, 2014.
[13] I. T. J. Brown, “Individual and technological factors affecting perceived ease of use of Web-based learning technologies in a developing country,” Electron. J. Inf. Syst. Dev. Ctries., vol. 9, no. 5, pp. 1–15, 2002.
[14] V. Venkatesh and F. D. Davis, “A Model of the Antecedents of Perceived Ease of Use: Development and Test,” Decis. Sci., vol. 27, no. 3, pp. 451–481, 1996.
[15] M. S. Khairi and Z. Baridwan, “An empirical study on organizational acceptance of new information systems in a commercial bank environment,” Int. J. Account. Bus. Soc., vol. 23, no. 1, pp. 97–121, 2015.
[16] S. R. N. P. Sari, “Analisis Model Penerimaan Pengguna Knowledge Management System (KMS) pada PT. Samsung R&D Institute Indonesia (SRIN),” Bina Nusantara University,
2017.
[17] S. Kamel and A. Hassan, “Assessing the Introduction of Electronic Banking in Egypt Using the Technology Acceptance Model,” J. Cases Inf. Technol., vol. 5, no. 1, pp. 1–25, 2003.
[18] W. Money and A. Turner, “Application of the technology acceptance model to a knowledge management system,” 37th Annu. Hawaii Int. Conf. Syst. Sci. 2004. Proc., vol. 0, no. C, p. 9 pp., 2004.
[19] A. A. Hamid, F. Z. A. Razak, A. A. Bakar, and W. S. W. Abdullah, “The Effects of Perceived Usefulness and Perceived Ease of Use on Continuance Intention to Use E-Government,”
Procedia Econ. Financ., vol. 35, no. October 2015, pp. 644–649,
2016.
[20] M. McGee, A. Rich, and J. Dumas, “Understanding the Usability Construct: User-Perceived Usability,” Proc. Hum. Factors Ergon. Soc. Annu. Meet., vol. 48, no. 5, pp. 907–911, 2004.
[21] C. M. Ringle, S. Wende, and J.-M. Becker, “SmartPLS 3,”
SmartPLS GmbH, 2015. [Online]. Available: https://www.smartpls.com/. [Accessed: 06-Feb-2018]. [22] C.-C. Huang, T.-C. Lin, and J.-W. Wang, “Understanding
Knowledge Management System Usage Antecedents: An Integration of Social Cognitive Theory and Task Technology Fit,” Inf. Manag., vol. ., 2008.
[23] J. F. Hair, C. M. Ringle, and M. Sarstedt, “PLS-SEM: Indeed a Silver Bullet,” J. Mark. Theory Pract., vol. 19, no. 2, pp. 139–
152, 2011.
[24] P. D. I. Ghozali and H. Latan, PARTIAL LEAST SQUARES KONSEP, TEKNIK DAN APLIKASI Menggunakan Program SmartPLS 2.0 M3. Badan Penerbit Universitas Diponegoro Semarang, 2015.
[25] J. F. J. Hair, G. T. M. Hult, C. Ringle, and M. Sarstedt, A Primer on Partial Least Squares Structural Equation Modeling (PLS-SEM), vol. 46, no. 1–2. 2014.
[26] G. D. Garson, Partial Least Squares: Regression & Structural Equation Models. 2016.