! #
A Lecture on
Democracy and Development
Masayuki Kudamatsu
IIES, Stockholm University
! #
1
Motivations
• # of democracies: ↑ recently (Fig.1)
• Development assistance
practitioners: often advocate democracy as a means to good governance
! #
! #
Two perspectives to politics
• Accountability
– Conflict of interest
between govt & citizens
• Representation
! #
Accountability Perspective
to Democracy
• Democracy: regularized leadership contest
• Citizens can replace incompetent leaders w/ potentially better ones
! #
Representation Perspective
to Democracy:
Acemoglu model
• Firm managers and Workers
• Firm managers prefer
– Low tax rate
– Entry barrier to keep wages low
• Workers prefer
– High tax rate for redistribution
– No entry barrier to push up wages
! #
• Autocracy: Firm managers decide
policies
• Democracy: Workers decide policies
• Autocracy 1. Tax: low
2. Entry barrier: high
3. Short-run growth: high 4. Long-run growth: low
• Democracy 1. Tax: high
2. Entry barrier: low
! #
Four Sets of Facts
1. Rich countries today: more democratic (Fig.2)
• This could be either due to (a) Democracy ⇒ Development (b) Development ⇒ Democracy
(c) 3rd Factor ⇒
! #
2. No correlation between changes in income and changes in democracy
• 1975-1990 (Fig.3)
• 1900-2000 (Fig.4)
3. Positive correlation in the very long run: 1500-2000 (Fig.5)
• This could be either due to (a) Very long-run effect of
democracy on development (b) Very long-run effect of
! #
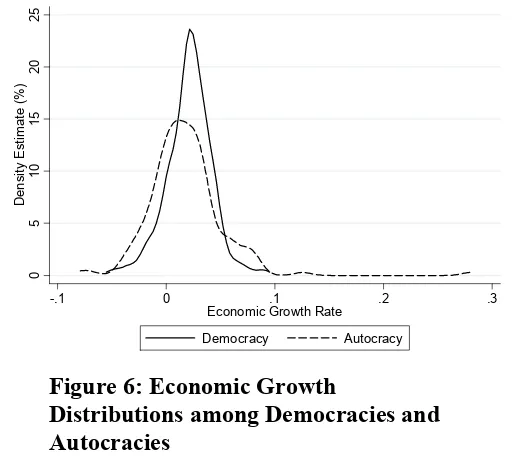
4. More volatile economic growth in autocracy than in democracy
• Performance varies a lot more for autocracy (Fig.6)
! #
Taking Stock
• Representation perspective may be correct
⇒ What makes democracy durable?
• Accountability perspective is wrong?
1. Define democracy wrongly? 2. Look at wrong outcome?
3. Data aggregation makes analysis difficult?
! #
• How about
1. Focus on leadership competition 2. Look at health?
! #
3
Impact of
Democratization in
! #
Motivations
• 1990s: Many African countries
introduced multiparty elections for presidency/parliament
• In some cases, the dictator won elections.
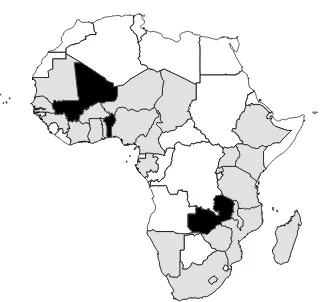
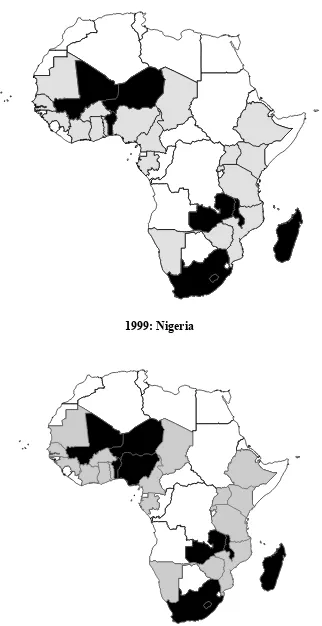
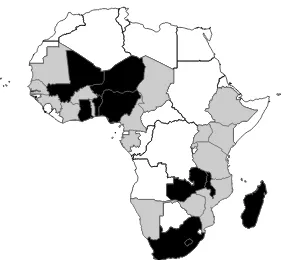
• In other cases, a new person becomes president/PM (Fig.7)
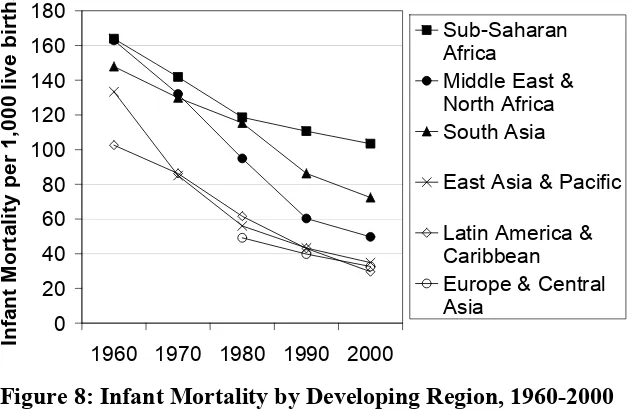
• Infant mortality: highest in Africa
over time (Fig.8)
! #
Research Method
• Use individual-level data on infant mortality
– Cross-country surveys of women
– When they gave birth
– Whether their children died
– If so, when?
! #
Causality rather than
correlation?
• An individual mother: unlikely to cause democratization
! #
Findings
• Infant mortality drops by 1.2% pt
• Larger drop for uneducated mothers
• No change if dictator won multiparty elections
• No change if dictator replaced in non-democratic ways
• Maternal health care provision improved
! #
4
A Model of
! #
Basic Ideas
• Heterogeneity of autocracies
• Selectorate: group of citizens with right to select leader
• Accountability & representation
! #
Two-period Model
Players
• 2 groups of citizens (A,B) & dictator • Period 1 dictator: group A
Actions
• Each period: dictator decides
whether to implement good policy or bad policy
• Between periods 1 & 2: Group A (selectorate) decides whether to retain or oust the dictator
! #
Information
• Dictator: either good or bad
• Citizens do not initially know whether dictator is good or bad
• What they know: dictator is good with prob. π
Preference
• Good dictator: prefers good policy in both periods
• Bad dictator’s payoff:
! #
Group A Group B Dictator Dictator Good Policy (∆ + σ, ∆) (∆, ∆ + σ) Bad Policy (σ, 0) (0, σ)
! #
Timing
1. Period 1 Dictator decides whether to implement good or bad policy 2. Group A decides whether to retain
or oust Period 1 Dictator
3. • If retained, Period 1 dictator becomes Period 2 dictator
• If ousted, Period 2 dictator is
– from Group A with prob. γ
! #
Analysis
• Period 2
– Good dictator implements good policy
– Bad dictator implements bad policy
• Period 1: after dictator (from Group A) chooses good policy
– This implies first two of the following three cases
1. good
2. bad with R1 < R2
3. bad with R1 > R2
! #
– Group A expects period 2 payoff to be
∗ if retain: σ
∗ if oust:
· π∆ + σ w/ prob. γ
· π∆ w/ prob. 1 − γ
⇒ Group A ousts dictator if σ < π∆ + γσ or
(1 − γ)σ < π∆
• Period 1 bad dictator with R1 < R2
implements
! #
Implications
• Bad dictator: disciplined if
(1 − γ)σ < π∆
• which means:
– γ: high
– σ: smaller than ∆
• Applicable cases: China since 1976, Brazil in the late 60s and early 70s, Thailand in the 60s, Portugal until mid 70s
! #
5
Conclusions
• Causality vs Correlation
• Leadership competition is key for
democracy to bite
! #
! #
Academic Papers This
Lecture Draws From:
• Acemoglu (2008) for subsection “Representation Perspective to
Democracy: Acemoglu Model” in Section 2.
• Acemoglu, Johnson, Robinson, and Yared (2007) and Jones and Olken (2005) for subsection “Four Sets of Facts” in Section 2.
• Kudamatsu (2008) for Section 3.
! #
Sources of Figures
• Figure 1: Figure 1.1 from Besley (2006).
• Figures 2-5: Figures 1, 2, 4, and 5 from Acemoglu, Johnson, Robinson, and Yared (2007).
• Figure 6: Figure 1 from Besley and Kudamatsu (2007).
• Figure 7: Created for this lecture based on Kudamatsu (2008).
! #
Bibliography
• Acemoglu, Daron (2008) “Oligarchic
versus Democratic Societies,” Journal of the European Economic Association, 6(1), pp. 1-44.
• Acemoglu, Daron, Simon Johnson, James A. Robinson, and Pierre Yared (2007) “Income and Democracy,” American Economic Review, 98(3), pp. 808-842.
• Besley, Timothy (2006) Principled Agents? The Political Economy of Good
Government, Oxford University Press.
• Besley, Timothy, and Masayuki
Kudamatsu (2007) “Making Autocracy Work”, CEPR Discussion Paper, no. 6371, available at
! #
Micro Data,” Unpublished paper. Available at
http://www.iies.su.se/ masa/imr200808.pdf
• Jones, Benjamin F., and Benjamin A. Olken (2005) “Do Leaders Matter?
0
1950 1960 1970 1980 1990 2000
Year
Figure 1: Democracies in the world, 1950-2003
Source: POLITY IV
0
Economic Growth Rate
Democracy Autocracy
Figure 6: Economic Growth
Distributions among Democracies and Autocracies
Sources: Penn World Table 6.2 and POLITY IV (version 2004)
Notes: Plotted are the density functions estimated by using the Gaussian kernel and the bandwidth that minimizes the mean integrated squared error (the kdensity command in STATA with the
1990: Comoros
1992: Mali
1994: Malawi and South Africa
2000: Ghana
Figure 7 (continued): Democratization in the Sample Countries over Time
Notes: Grey-colored countries are the sample countries; Black-colored democratized.
0
Middle East & North Africa South Asia
East Asia & Pacific
Latin America & Caribbean