Land Use Change Assessment as an Effort to Mitigate Climate Change in Belawan Watershed Using Integrated Approach by Rahmawaty, Khairat and Rauf | 1
LAND USE CHANGE ASSESSMENT AS AN EFFORT TO
MITIGATE CLIMATE CHANGE IN BELAWAN WATERSHED
USING INTEGRATED APPROACH
RAHMAWATY1*, NAJMATUL KHAIRAT1 AND ABDUL RAUF2
1Forestry Study Program, Faculty of Agriculture, University of Sumatera Utara, Medan 20155, Indonesia, email: [email protected]
2Agroecotechnology Study Program, Faculty of Agriculture, University of Sumatera Utara, Medan 20155, Indonesia, email: [email protected]
*Corresponding author
ABSTRACT
Changes in the land cover are one of important issues in North Sumatra, especially in Belawan Watershed. Belawan Watershed was located across Deli Serdang District and Medan City. In order to mitigate climate change, this study aimed to evaluate the changes of land cover during eleven years period (2000 to 2011) and to determine the main factor causing the change of land cover in Belawan Watershed. The Geographic Information System (GIS) with overlay technique was used to analyze land cover changes and the Analytical Hierarchy Process (AHP) with questionnaires and interviews were used to determine the cause of changes and the factors driving the changes in land cover (integrated approach). Field observations were also made to the biophysical conditions due to changes in land cover. The results showed that during eleven years, extensive changes in land cover were the greatest in dry land farming mixed shrubs that became dry land agriculture. Economic factors were the main cause of changes, followed by social factors and ecological factors. Economic criteria selected by respondents as the most important priority for activities in Belawan Watershed could not be separated from economic activities that were aligned with spatial development. This certainly influenced the basis of economic or financial considerations to convert agricultural land into non-agricultural use either for residential, offices, and other facilities. In order to mitigate climate change in Belawan Watershed, it is expected that the role of all stakeholders, especially local governments should be improved so that changes in land cover can be minimized.
Keywords: AHP, Belawan Watershed, climate change, GIS, mitigation
INTRODUCTION
Interaction between people and land may cause land use change that potentially give large negative impact on the continuity of that resource. To prevent the negative impact of land use change, it is necessarry to monitor the changes in land by managing these land resources in the future with a good plan and optimizing the benefits of sustainable land resource.
2nd International Conference on Tropical Biology “Ecological Restoration in Southeast Asia: Challenges, Gains, and Future Directions”, SEAMEO BIOTROP, Bogor-INDONESIA, 12-13 OCTOBER 2015
Land Use Change Assessment as an Effort to Mitigate Climate Change in Belawan Watershed Using Integrated Approach by Rahmawaty, Khairat and Rauf | 2
2000-2011 periods is necessary. Among 83% of the total watershed Belawan is located in Deli Serdang district. This Belawan Watershed in Deli Serdang has the largest in district in Kutalimbaru with total area almost 27% out of 83% of the total watershed Belawan Deli Serdang. Meanwhile, the smallest area is in Namorambe District with
only 0.02% (5 ha)of the total area.
Analysis of Land Cover Changes in Belawan Watershed used land use data from 2000 and 2011 (11 years period). The data were obtained based on the results of
previous year’s data available in the Central Forest Area Consolidation (BPKH), Ministry of Forestry, i.e. data from 2011 can be used as a comparison to each interval data from the last five to six years. Analysis of extensive changes in land cover in Belawan Watershed in 2000-2011 can be obtained by comparing the area and the changes that occurred in 2000 and 2011. Land use changes in Medan City are important to be studied because the land use change will affect the climate change in Medan City. In North Sumatra, research on land use had been carried out (Rahmawaty
et al., 2011; Onrizal, 2010). This study aimed to analyze land cover changes in Belawan Watershed from 2000 to 2011 and to analyze the factors causing land cover changes in Belawan Watershed.
MATERIALS AND METHODS
This study was conducted from March to August 2013 in Belawan Watershed (Fig.1). Data collection was conducted from March to April 2013, and the data analysis was conducted from May to August 2013. Data processing was performed at the Laboratory of Integrated Forest Management Department of Forestry, Faculty of Agriculture, North Sumatra University.
Land Use Change Assessment as an Effort to Mitigate Climate Change in Belawan Watershed Using Integrated Approach by Rahmawaty, Khairat and Rauf | 3
Figure 1: Study site map
The Geographic Information System (GIS) with overlay technique was used to analyze land use changes. The Analytical Hierarchy Process (AHP) with questionnaires and interview was used to determine the cause of changes and the factors driving the changes in land use. Field observations were also made to the biophysical conditions due to changes in land use. Computing the decrease or increase of land use change in area was conducted by Microsoft Office Excel. Land use change maps were derived from maps of different years of acquisition by using geoprocessing
analysis by overlaying two thematic layers resulting from year’s interpretation. XTool
extension in ArcView was used to analyze changes. Microsoft Excel software supported the conversion of the tabulated data into a dbf IV format. The ArcView was used in converting the tabulated data into shape files and the merging of the different themes through the geoprocessing wizard.
RESULTS AND DISCUSSION
People’s demand for land is marked by people’s need to own a residence,
place of business and transportation. People’s needs are always increasing with the
development of a region. Almost every zone in Watershed Belawan which does not fit
with the increasing of people’s need is threatened with extinction Space utilization in
2nd International Conference on Tropical Biology “Ecological Restoration in Southeast Asia: Challenges, Gains, and Future Directions”, SEAMEO BIOTROP, Bogor-INDONESIA, 12-13 OCTOBER 2015
Land Use Change Assessment as an Effort to Mitigate Climate Change in Belawan Watershed Using Integrated Approach by Rahmawaty, Khairat and Rauf | 4
Belawan Watershed needs to be regulated by government agencies to maintain ecosystem sustainability.
Land cover in Watershed Belawan can generally be classified into twelve types i.e. primary dry forest, scrub, plantation, dry land agriculture, dry land agriculture mix, settlement, clearing, body of water, secondary mangrove forests, ponds, shrub swamps and rice paddies. Table 1 lists broad types of land cover in 2000, and 2011. Changes of land cover classification data from 2000 to 2011 was obtained by comparing the land cover in 2000 and 2011 to obtain land cover of the predetermined interval. Furthermore, the classification results provided data of any changes in the area to obtain land cover change from 2000 and 2011, which was quite extensive (Table 1).
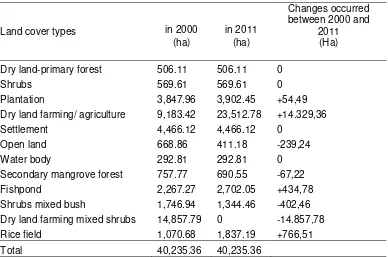
Tabel 1. Land cover types changes in Belawan Watershed in 2000-2011
Land cover types in 2000
Dry land-primary forest 506.11 506.11 0
Shrubs 569.61 569.61 0
Plantation 3,847.96 3,902.45 +54,49 Dry land farming/ agriculture 9,183.42 23,512.78 +14.329,36 Settlement 4,466.12 4,466.12 0
Open land 668.86 411.18 -239,24
Water body 292.81 292.81 0
Secondary mangrove forest 757.77 690.55 -67,22 Fishpond 2,267.27 2,702.05 +434,78 Shrubs mixed bush 1,746.94 1,344.46 -402,46 Dry land farming mixed shrubs 14,857.79 0 -14.857,78 Rice field 1,070.68 1,837.19 +766,51
Total 40,235.36 40,235.36
Belawan Watershed lands cover change from year to year in the total area of 40,235.36 ha. Land cover in 2000 was dominated by dry land farming mixed shrubs (14,857.79 ha) followed by dry land farming/agriculture (9,183.42 ha), settlement (4,466.12), plantation (3,846.94 ha), fishpond (2,267.27 ha), shrubs mixed bush (1,746.94 ha), rice field (1,070.68 ha), secondary mangrove forests (757.77 ha), open land (668.86 ha), shrubs (569.61 ha), dry land-primary forest (506.11 ha), and water body (292.81 ha). Rahmawaty et al., (2011) reported that extensive land cover types in Belawan and Besitang Watersheds illustrated the differences of watershed conditions in social, ecological and economic aspects. The differences was caused by climatic conditions, relief and type of soil, hydrological cycle and vegetation cover which affects the potential use of different land types. Moreover, the differences of culture, education and daily habits of society were different in each watershed.
Land Use Change Assessment as an Effort to Mitigate Climate Change in Belawan Watershed Using Integrated Approach by Rahmawaty, Khairat and Rauf | 5
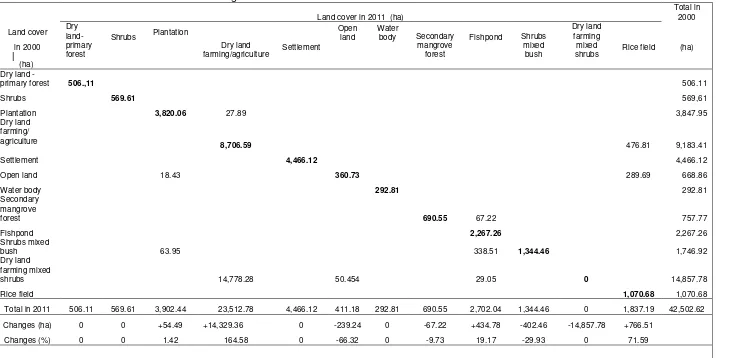
Table 2. Matrix of extensive changes in land use in Belawan Watershed from 2000 to 2011
Land cover in 2011 (ha)
in 2000 Settlement Rice field (ha)
(ha)
Dry land
-primary forest 506.,11 506.11
Shrubs 569.61 569,61
Plantation 3,820.06 27.89 3,847.95
2nd International Conference on Tropical Biology “Ecological Restoration in Southeast Asia: Challenges, Gains, and Future Directions”, SEAMEO BIOTROP, Bogor-INDONESIA, 12-13 OCTOBER 2015
Land Use Change Assessment as an Effort to Mitigate Climate Change in Belawan Watershed Using Integrated Approach by Rahmawaty, Khairat and Rauf | 6
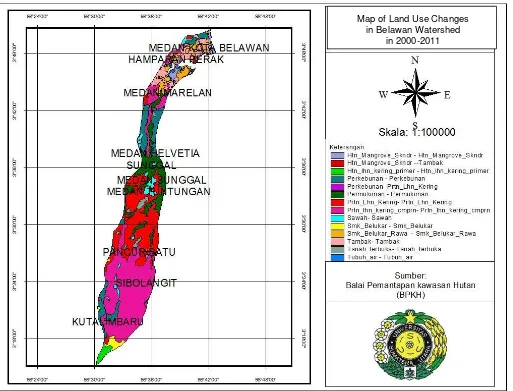
Figure 2. Map of Land Use Changes in Belawan Watershed in 2000-2011
Map of Land Use Changes in Belawan Watershed
Land Use Change Assessment as an Effort to Mitigate Climate Change in Belawan Watershed Using Integrated Approach by Rahmawaty, Khairat and Rauf | 7
Table 2 showed that 27.89 ha of plantation in 2000 changed into dry land farming/agriculture in 2011, 18.43 ha of open land in 2000 changed into plantation in 2011, 67.22 ha of secondary mangrove forests in 2000 changed into fishpond in 2011, 338.51 ha of shrub mixed bush in 2000 changed into fish pond in 2011, 63.95 ha of shrub mixed bush in 2000 changed into plantation in year 2011, 29.05 ha of dry land farming mixed shrubs in 2000 changed into fishpond in 2011, and 50.45 ha of dry land farming mixed shrubs in 2000 changed into open land in 2011. Map of land cover changes can be seen in Figure 2.
The dominant changes of land area from 2000 to 2011 occurred on dry land farming/agriculture, which is consistent with the statement by Irawan (2005) and Rahmawaty et al., (2011). Dry-land farming/agriculture land types are mostly located in the upstream and downstream parts of the watershed i.e. in Belawan Kelambir Lima village of Medan Marelan Subdistrict and Kelumpang village of Pancur Batu Subdistrict. The society in the upstream part of Belawan Watershed mostly practiced dryland farming, especially sugar cane, corn crops, and vegetables (Fig. 2).
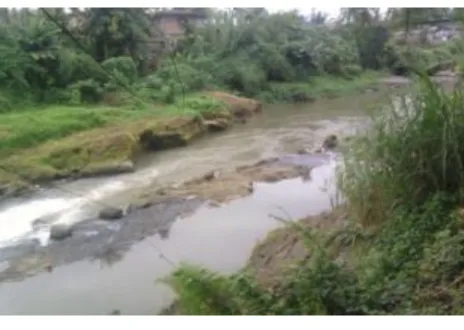
Watershed conditions were still well maintained and clean which attracted the surrounding community to conduct bathing and washing activities on the bank of the river (Fig. 3).
Figure 3. The condition of the upstream part of Belawan Watershed
According to Wijaya (2004) among factors causing changes in land cover are population growth, livelihood, accessibility and life support facilities, and government policy. According to the Central Bureau of Statistics of North Sumatra Province, Deli Serdang District in 2007 had 822,341,811.774 male inhabitants and 1,634,115 female inhabitants, with population growth rate of 2.25% per year. Population density in Deli
Serdang is 679.00 inhabitants per km2, which support the theory that the increase of
land use is caused by population increase.
2nd International Conference on Tropical Biology “Ecological Restoration in Southeast Asia: Challenges, Gains, and Future Directions”, SEAMEO BIOTROP, Bogor-INDONESIA, 12-13 OCTOBER 2015
Land Use Change Assessment as an Effort to Mitigate Climate Change in Belawan Watershed Using Integrated Approach by Rahmawaty, Khairat and Rauf | 8
and should have the consistency of less than 10% or 0.10 to be considered correct or accurate.
The weighted value was then recapitulated and ranked to obtain overall conclusions on factors causing land cover changes in Belawan Watershed.
Table 3. Criteria Considered to Cause Land Cover Change
Criteria Geometric Average Priority Rank
Social 0.20 0.28 2
Ecology 0.37 0.25 3
Economy 0.23 0.46 1
Total 0.81 1
The most dominant factor leading to land cover changes in Belawan Watershed was the economic criteria. According to Rustiadi (2001) in order to support higher economic growth, land resources management was often tactless and did not consider sustainability aspects (for short term). This study showed that if there is no efforts conducted to manage the land cover change, Belawan Watershed sustainability will be threatened and the resources of high-quality land will experience reduction and people will continue to depend on land resources in Belawan Watershed resulting to low quality of land. Education is among factors influencing people on how to sustainably utilize the existing land in Belawan Watershed. Most residents in the area of Belawan Watershed are in the elementary and secondary levels (Syahrial, 2009). In addition to educational factors, socio-cultural factors are also important to be considered in land management. Komarsa (2001) reported that socio-cultural factors are concerned with the educational background, occupation, age, motivation and perception, views or attitude to life and customs which greatly affects the changes occurred in Belawan Watershed. Economic factors are the dominant factor causing the change in land cover and can be anticipated by providing alternatives to reduce the damage in Belawan Watershed. Criteria and alternatives offered are the result of interviews on ten
respondents in order to obtain the respondents’ assessments on the six alternatives
offered to each respondent (Table 4).
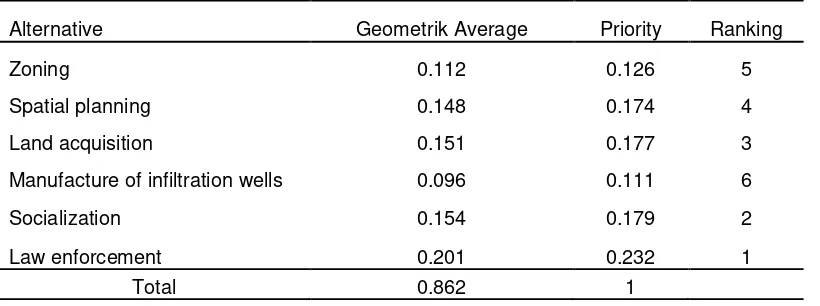
Tabel 4. Priority scale for alternatives offered using AHP
Alternative Geometrik Average Priority Ranking
Zoning 0.112 0.126 5
Spatial planning 0.148 0.174 4
Land acquisition 0.151 0.177 3
Manufacture of infiltration wells 0.096 0.111 6
Socialization 0.154 0.179 2
Law enforcement 0.201 0.232 1
Total 0.862 1
Land Use Change Assessment as an Effort to Mitigate Climate Change in Belawan Watershed Using Integrated Approach by Rahmawaty, Khairat and Rauf | 9
alternative to be offered (Table 4). Data summary will be used to determine alternatives to manage the factors causing land cover changes in Belawan Watershed.
Alternatives offered in solving problems of land cover change in Belawan Watershed were zoning, spatial planning, land acquisition, manufacture of infiltration wells, socialization, and law enforcement. Zoning is a barrier zone that essentially stipulated in the laws. Zoning is associated with the land use itself as a protected zone in conservation zone rules in the law firm. Spatial planning is more directed to local regulations that have been made and are planned based on region for each region. Land acquisition alternative was offered because watershed area must have 30% forest area of the total area as green open space in Belawan watershed.
The upstream part of Belawan Watershed contained sand mining along the riverbanks, therefore, alternative was offered to make infiltration wells to prevent erosion and flooding. Socialization leads to the liveliness of the public and to maintain public awareness of watershed areas. Law enforcement alternative was offered to guard the strictness of the rules that bind the community when breaking the existing policies. Hall of Watershed Management (BP DAS) has already publicly announced that the watershed areas must have 30% vegetation cover to be regenerated as a watershed. Among socialization activities carried out was planting one billion trees through collaboration with the Indonesian Heritage Foundation preceded by socializing greening plan to all communities in the Belawan Watershed covering 8 villages.
Business approach to the community has been done, but the people who live in the watershed areas are still conducting land conversion. There should be a decisive participation from government officials such as district head of each region, so that they can monitor the state of the watershed according to the function. There should also be firm enforced rules in the society as a tool to remind the community on how important it is to sustainably utilize the Belawan Watershed.
CONCLUSIONS
During eleven years period (2000- 2011), the extensive land use changes occurred on dry land farming/agriculture, followed by changes in secondary mangrove forest to become fishpond. The dominant factors causing land use changes in the Belawan Watershed based on AHP analysis was economy, while the law enforcement was the first rank as alternative offered to solve the land use change issue in Belawan Watershed.
REFERENCES
Irawan. 2005. Conversion of rice field: Potential Impact, Utilization Patterns and Determinant Factors (Konversi Lahan Sawah: Potensi Dampak, Pola Pemanfaatannya, dan Faktor Determinan). Forum Penelitian Agro Ekonomi Volume 23, Nomor, Juni 2005. Bogor: Pusat Analisis Sosial Ekonomi dan Kebijakan Pertanian.
Komarsa. G. 2001. Analisa Penggunaan Lahan sawah dan Tegalan di Daerah Aliran Sungai Cimanuk Hulu Jawa Bara. Disertasi. Institut Pertanian Bogor. IPB.
2nd International Conference on Tropical Biology “Ecological Restoration in Southeast Asia: Challenges, Gains, and Future Directions”, SEAMEO BIOTROP, Bogor-INDONESIA, 12-13 OCTOBER 2015
Land Use Change Assessment as an Effort to Mitigate Climate Change in Belawan Watershed Using Integrated Approach by Rahmawaty, Khairat and Rauf | 10
Rahmawaty, TR Villanueva, MG Carandang. 2011. Participatory Land Use Allocation.
LAP Lambert. Saarbrucken, Germany.
Rustiadi. 2001. Dinamika Spasial Perubahan Penggunaan Lahan dan Faktor - Faktor Penyebabnya di Kabupaten Serang Provinsi Banten. Tesis. Institut Pertanian Bogor. Bogor.
Syahrial, R. 2009. Analisis Peruntukan Lahan Daerah Aliran Sungai (DAS) Belawan Kaitannya dengan Tata Ruang. USU Press. Universitas. Medan.