iii
PARTICIPATORY LAND USE ALLOCATION
Case Study in Besitang Watershed,
Langkat, North Sumatra,
Indonesia
iv
To my beloved family, husband, Ramzi Sastra, son, Rizky Nabil Andhika, and daughter, Rahmi Nurul Andhini,for all their support and encouragement over the years and understanding especially during times when it was so difficult to carry on.
v
Preface
The study contained in this book was conducted to develop a framework for participatory and improved land use decision-making in Besitang Watershed, Langkat, North Sumatra, Indonesia. Specifically, it aimed to: assess land use changes, estimate soil erosion under different land uses, analyze the actual and potential suitability of the lands for several annual, estate and silvicultural crops, determine the current and potential land use suitability with stakeholder participation, and develop a spatial participatory land use allocation based on integrated approach to ensure sustainability. Socio-economic information and physical data were derived from interviews and field survey. Collective opinion was derived from the workshop with stakeholders. In this book, Geographic Information System (GIS) and Analytical Hierarchy Process (AHP) were used for land use allocation. The Universal Soil Loss Equation (USLE) was used to determine soil erosion in each land system. The significant contributions of integrated approach using GIS and AHP in land use decision-making were: as a tool for facilitating efficient land use allocation and sound policy formulation, as well as in advancing science-based investigations. This approach is efficient and reliable in land use allocation for watershed management, since it involves the use of physical components as well as participation of stakeholders to ensure sustainability of land uses.
Rahmawaty
Department of Forestry, Faculty of Agriculture, University of Sumatera Utara (USU), Medan, Indonesia
Teodoro R. Villanueva
College of Forestry and Natural Resources, University of the Philippines Los Baños (UPLB)
Myrna G. Carandang
vi
Acknowledgment
vii
CONTENTS
Preface iii
Acknowledgments iv
1 INTRODUCTION 1
1.1. Background of the Study 1
1.2. Statement of the Problem 3
1.3. Objectives of the Study 4
1.4. Importance of the Study 4
1.5. Conceptual Framework 5
1.6. Operational Definition of Terms 8
2 DESCRIPTION OF THE STUDY AREA 11
3 SOCIO-ECONOMIC CHARACTERISTICS OF THE STUDY AREA 15
3.1.Data Collection for Socio-Economic Information 15
3.2. Population of the Besitang Watershed 16
3.3. Demographic Characteristics of the Respondents 17
3.4. Source of Income of the Respondents in Besitang Watershed 19
3.5. Land Holding and Crop Production 20
3.6. Preferred and Use of the Land 21
3.7. Extension Workers 23
4 INTEGRATED APPROACH USING GIS AND AHP 25
4.1. Physical Information 25
4.2. Physical Characteristics Of The Study Area 27
4.2.1. Rainfall and Erosivity Factor 27
4.2.2. Soil Types and Soil Erodibility Factor 29
4.2.3. Land System and Decision Zone 30
4.2.4. Soil Depth 33
4.2.5.The Slopes and the Slope Length Factor and Slope Gradient Factor 34
4.2.6. TheCropping management factor and erosion control practice factor
35
4.3. Collective Opinion Information 39
4.4. Geographic Information System (GIS) 40
viii
4.6. Participatory Decision Support System 51
5 SOIL EROSION OF DIFFERENT LAND USES 54
5.1. Soil Erosion 54
5.2. Erosion Rate 60
5.3.Soil Erosion Index 66
6 LAND USE AND LAND COVER CHANGE 70
6.1. Methodology 70
6.2. Forest Land Use Change 70
6.3. Processes of Land Use Transitions 78
7 CLASSIFICATION OF FOREST AND LAND USE 82
7.1. Present Land Cover/Land Use In Besitang Watershed 83
7.2. The land use and forest classification in Besitang Watershed 88
7.3. Land use and land use planning 92
7.4. Land Capability Classification 93
7.5. Land Suitability Classification 99
8 LAND USE ALLOCATION 115
8.1. Potential Land Use Suitability Classification 116
8.2. Land Use Allocation in Besitang Watershed 118
9 SUMMARY, CONCLUSIONS, AND RECOMMENDATIONS 134
9.1. Summary 134
9.2. Conclusions 136
9.3. Recommendations 138
REFERENCES 139
APPENDICES 146
1
CHAPTER 1 INTRODUCTION 1.1. Background of the Study
Indonesia is located in 5,200-km-long chain of some 17,000 islands straddling the equator in the heart of Southeast Asia. Its 220 million people live in a land area of about 188 million Has (ITTO, 2005). Land is becoming scarce so that the more fragile upland areas are looked upon as the last frontier for the expansion of agriculture and other land uses. As a result, numerous problems have now been threatening the ecological stability of the uplands (Cruz, 1990). The increasing human population, the more consequent accelerating demands and intensity of human activities on the land have various degrees of impact on all of the material and natural resources in the world. Human population pressures have accelerated the increases of land value and the diversity of land use.
North Sumatra Province has a land area of 71,680 km² or 3.73% of Indonesia’s total area with 17 regencies. It is one of the provinces with big forest land and big palm fruit plantations, spread in several regencies. One of them is the Langkat Regency (626,329 ha) which is located close to Medan (capital of North Sumatra Province). There are six watersheds in Langkat Regency and one of them is Besitang Watershed which is the second biggest watershed after the Wampu Watershed. According
to the Ministry of Public Works’ Decree Number 39/PRT/1989 on River Allocation, the rivers in the North Sumatra Province can be grouped into six River Area Units/Satuan Wilayah Sungai (SWS), they are SWS Wampu-Besitang, SWS Belawan-Belumai-Ular, SWS Bah Bolon, SWS Asahan, SWS Barumun Kualuh, and SWS Batang Gadis-Batang Toru. As mentioned in the Decree, Besitang Watershed is located in SWS Wampu-Besitang.
The conditions of the watersheds in Indonesia are generally damaged to severely damaged based on the characterization conducted by the Ministry of Forestry, the Republic of Indonesia in 1999. There are 458 watersheds in critical condition in Indonesia, 60 of which are in Category I, damaged to severely damaged (16 of them are in Java), 222 watersheds are in Category II, from moderately to severely damaged and 176 watersheds are potentially damaged (Category III). Unfortunately, the number of severely damaged watersheds is now increasing and their condition has worsened due to catastrophe, flood and drought. According to the Ministry of Forestry (2005), Besitang Watershed is one of Priority II watersheds in Indonesia.
2
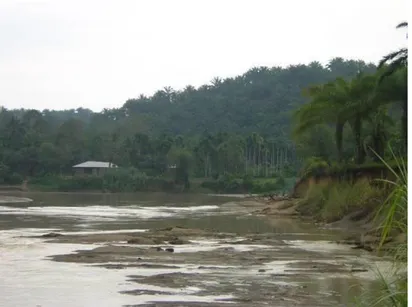
Besitang Watershed borders on Nanggroe Aceh Darussalam (NAD) Province, as a result this area has become a new place for refugees from NAD. Moreover, Gunung Leuser National Park (TNGL) as a protected area is a magnet for illegal loggers who do not realize the bad effects of their action. Many trees in upland stream sub-watershed have been cut down. According to the Ministry of Forestry (2005), in Besitang Watershed, the soil as categorized as sensitive to erosion so that it should be taken care further, in order to maintain its watershed ecosystem functions.
At the moment, there is a trend to make use of the land for the economic interests, which could increase the income. One of the favorite and high-economic-value plants in this area is oil palm. Another problem in Besitang Watershed that seems to be a major one is land conversion to oil palm plantation and fish pond in the mangrove forests by the surrounding community have decreased the size of remaining areas performing ecosystem services.. According to Ekanayake and Dayawansa (2003), land as resource cannot be measured by the surface area alone; hence the types of soil which is critical for productivity, underlying geology, topography, hydrology, and plants and animal population also has to be considered. These attributes limit the extent of land available for various purposes. The growing population, industrialization and misuse and overexploitation of land resources have in effect increased the demand for land.
According to Anderle et al. (1994), rising population pressure coupled with mounting competition by different types of land users is a major challenge faced by land use planners and policy-makers. Rational and sustainable land use is an issue concerning both the government and land users in preserving the land resources for the benefit of present and future generations. Land use decisions are based on comprehensive and quantified assessment of potential and development possibilities of the land resources taking into account the biophysical, environmental and socio-economic factors as well as the space and time dimensions of sustained land use (Antoine et al., 1997).
In Indonesia, the spatial management plan related to national land areas cited in the spatial management plan (RTRWN) is based on Republic of Indonesia Law Number 26 (2007) about Spatial Management. The spatial management plan related to provincial land areas (RTRWP) was derived from RTRWN. The spatial management plan related to regional land uses (RTRWK) was made using RTRWP as a reference. Because Besitang Watershed is included in Langkat Regency administrative area, the spatial management plan for Besitang was also referred to Langkat RTRWK. However, RTRWK in the area can be considered as efficient and effective. This is because, community involvement has not been optimized and there is lack of social awareness about this, so that very few people understand it. In addition RTRWK is sometimes different with the reality in the field.
3
develop the land resources in ways that capitalize on the local potential and suitability, avoid negative impacts and respond to present and future societal demand within the limits of the carrying capacity of the natural environment (FAO, 1995). Decision support system has been identified as a critical component to identify and solve problems, provide information and current scientific knowledge in watershed management decision making process.
Based on the Besitang Watershed’s condition, some thoughts on good steps or actions are needed to overcome these problems. Rehabilitation of watersheds is also needed so that it can support and enhance other environment functions. At present, researches on land use and land use planning have been carried out in the area but these have not fully looked into the driving forces of land use as influenced by development policies. There is a need for an approach that can involve the participation of stakeholders so that land use management planning can be effectively and efficiently done in accordance with Republic of Indonesia Law Number 26 (2007) about Spatial Management. The research about land use allocation with stakeholder participation and collaboration that is crucial for successful and sustainable watershed management has never been conducted previously in the area. For this reason, it is essential that research in this area be conducted.
1.2. Statement of the Problem
Considering that the status of Langkat Regency is autonomy and there are differences concerning the status of the region, then the government planned to manage the land for various activities. It is cited in RTRWK. For these activities, based on Republic of Indonesia Law Number 26 (2007) about Spatial Management, participation of the stakeholders from many sectors should be considered to achieve the maximum result and to minimize the problems about land use allocation in this area that was probably occurring.
Considering that Besitang Watershed constitutes one of Priority II watershed (it means that it is in a moderately to severely damaged class), the change in watershed condition emerged as result of deforestation in the TNGL area. Moreover, erosion and land conversion to oil palm areas and the extension of fish farming areas, the areas need special management to maintain the watersheds ecosystem. Hence, this study aims to develop an approach of land use allocation for the area based on integrated approach using Geographic Information System (GIS) and Analytical Hierarchy Process (AHP). The approach is expected to contribute to the advancement of science and technology in forestry and environment. Hopefully, the methodology would be useful as an area development approach to produce goods and services on the basis of sustainability and would contribute to policymakers in creating guidelines relevant to forestry, environment, and rural development sectors.
4
have to be found: What is the land use/cover changes in the area? What is the erosion hazard of different land uses in the watershed? What is the land capability and land suitability in the area? What is the actual and potential suitability of the lands for several annual crops, estate and silvicultural plants in the area? What is the current and potential land use suitability in the area? What is the spatial participatory land use allocation for the area that contributes to sustainability?
1.3. Objectives of the Study
This study generally aimed to develop a framework of participatory and improved land use decision-making in Besitang Watershed, Langkat, North Sumatra, Indonesia.
Specifically, the study aimed to: 1. assess land use changes in the area;
2. estimate soil erosion under different land uses in the area;
3. analyze the actual and potential suitability of the lands for several annual, estate and silvicultural crops in the area;
4. determine the current and potential land use suitability in the area with stakeholders; participation; and
5. develop a spatial participatory land use allocation approach for the area based on integrated approach to ensure sustainability.
1.4. Importance of the Study
The land use allocation framework would contribute to the development of the area. The results of the study would inform the stakeholders about the recommended best land use allocation particularly those of the area and contribute to promoting better understanding of driving forces of land use change, effects of national policies on agricultural land allocation in Asia, in general and in Indonesia, in particular. Findings of the study also would facilitate the improvement of the efficiency in land use of watersheds in Indonesia.
5
1.5. Conceptual Framework
The land is one of the resources that is important to supporting the development in Besitang Watershed, Langkat, North Sumatra. Consequently, the government should take land use planning in the area into account. It is realized in the spatial management plan related to regional land areas. As one of the primary priorities in this area, land should be managed wisely, in the case where sustainable land management is reached, there are three parameters that are needed, these are: social, economic, and environment. According to Erskine (1997), sustainability is distinguished based on economics, ecology, and social perspective. The key to successful economically sound land uses depends on the efficiency and the wise use of every parcel of land on which the activities are done.
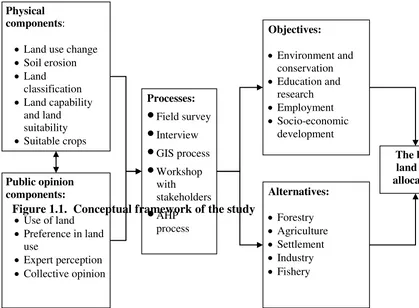
This study attempts to find out how to achieve the best land use allocation (BLUA) and what factors influence or affect land use allocation. The concept implies that the best land use allocation is influenced by integrated components, namely: physical components and public opinion components. The physical components in this study focused on the physical (environment) factors, which include land use/cover changes, soil erosion, land classification, land capability and land suitability classification, and suitable crops in the area. Land use changes were considered as loss (reduction) and gain (increase) of areas. The loss of area was measured as loss of area from dense area to open area and both dense and open area to other types of land use, such as: bush, swamp, fish pond, and paddy field. In contrast, gain in area was measured as an increase in the area due to restoration from open area to dense area, from bush to open area and from bush to dense area resulting in area plantation. The public opinion component focused on use of land, preference in land use, expert perception, and collective opinion (Figure 1).
According to Bantayan (1996), a spatial decision support system should take into consideration the three major attributes in land use decision-making, namely: objectives, alternatives, and land units. Hence, the first stage in the proposed method involves identification of objectives and alternatives. In this study, the objectives and the alternatives are defined as decision variables. The objectives form the basis by which alternatives were evaluated. They may contribute to environment and conservation, education and research, employment, and socio-economic development. The alternatives, in the context of land use planning, take the form of possible land uses or choice possibilities which may already exist or may be proposed for the area (Voogd, 1983 cited by Bantayan, 1996). The key question in land use suitability is how to determine the degree to which the alternatives contribute to the objectives in each land unit.
6
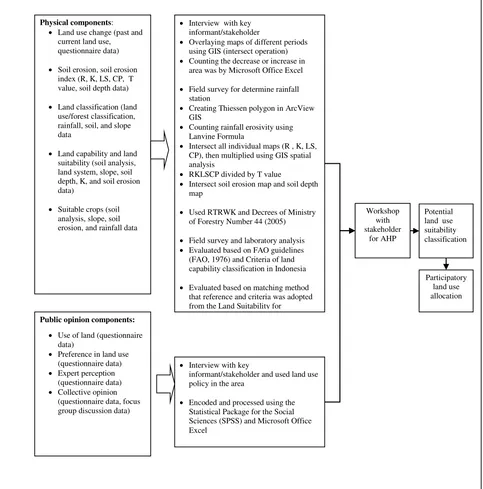
suitable crops in the area. The public opinion process was generated from the form of preference measures of individual or collective opinion. This process requires that individual preferences satisfy a measure of consistency. The results of these two processes were standardized and expressed as priorities. These priorities are related to the degree of suitability of a land unit with regard to the set of alternatives. Then, land allocation achieved from the results of land use suitability. Figure 1 shows the conceptual framework showing the relationship of the components, processes, objectives, and alternatives to realize the best land use allocation in Besitang Watershed, Langkat, North Sumatra, Indonesia. Furthermore, Figure 2 shows the flow diagram activities of the study.
Figure 1.1. Conceptual framework of the study
Objectives:
Environment and conservation Education and
research Employment Socio-economic
development
The best land use allocation Alternatives:
Forestry Agriculture Settlement Industry Fishery Physical
components:
Land use change Soil erosion Land
classification Land capability
and land suitability Suitable crops
Public opinion components:
Use of land Preference in land
use
Expert perception Collective opinion
Processes:
•
Field survey•
Interview•
GIS process•
Workshop withstakeholders
7 Public opinion components:
Use of land (questionnaire data)
Preference in land use (questionnaire data)
Expert perception (questionnaire data)
Collective opinion (questionnaire data, focus
Soil erosion, soil erosion index (R, K, LS, CP, T value, soil depth data)
Land classification (land use/forest classification, rainfall, soil, and slope data
Land capability and land suitability (soil analysis, land system, slope, soil depth, K, and soil erosion data)
Suitable crops (soil analysis, slope, soil erosion, and rainfall data
Interview with key informant/stakeholder
Overlaying maps of different periods using GIS (intersect operation)
Counting the decrease or increase in area was by Microsoft Office Excel
Field survey for determine rainfall station
Creating Thiessen polygon in ArcView GIS
Counting rainfall erosivity using Lanvine Formula
Intersect all individual maps (R , K, LS, CP), then multiplied using GIS spatial analysis
RKLSCP divided by T value
Intersect soil erosion map and soil depth map
Used RTRWK and Decrees of Ministry of Forestry Number 44 (2005)
Field survey and laboratory analysis
Evaluated based on FAO guidelines (FAO, 1976) and Criteria of land capability classification in Indonesia
Evaluated based on matching method that reference and criteria was adopted from the Land Suitability for
Potential
informant/stakeholder and used land use policy in the area
Encoded and processed using the Statistical Package for the Social Sciences(SPSS) and Microsoft Office Excel
Workshop with stakeholder
for AHP
8
1.6. Operational Definition of Terms
Analytical Hierarchy Process (AHP) is a method that can be used to establish measures in both the physical and social domains. In using the AHP to model problem, one needs a hierarchic or a network structure to represent that problem, as well as pairwise comparisons to establish relations within the structure. In the discrete case these comparisons lead to dominance matrices and in the continuous case to kernels of Fredholm Operators, from which ratio scales are derived in the form of principal eigenvectors, or eigenfunctions, as the case may be (Saaty, 1995).
ArcGIS is an integrated collection of GIS software products for building a complete GIS. ArcGIS enables users to deploy GIS functionality wherever it is needed in desktops, servers, or custom applications; over the web; or in the field (ESRI, 2007).
ArcView GIS is a powerful, easy to use tool that brings geographic information to desktop. It gives our power to visualize, explore, query and analyze data spatially; it is made by Environmental Systems Research Institute (ESRI), the leading GIS software (ESRI, 2007).
Attribute data describes the characteristics of the spatial features. These characteristics can be quantitative and/or qualitative in nature. Attribute data is often referred to as tabular data.
Current land use classification is a land use based on the spatial management plan related to regional land areas or regional spatial planning (RTRWK) organized by the local government, in this case is the regional development planning board of Langkat Regency (BAPPEDA).
Decision Support System (DSS) is a computerized system for helping make decisions. A decision is a choice between alternatives based on estimates of the values of those alternatives. Supporting a decision means helping people working alone or in a group gather intelligence, generate alternatives and make choices.
Geographic Information System (GIS) is a computer based information system used by people, which attempts to capture, store, manipulate, analyze and display spatially referenced and associated tabular attribute data, for solving complex research, planning and management problems. It is store and analysis spatial data (Godilano, 2001).
Household is a domestic unit consisting of the members of a family who live together along with non relatives such as servants. It is person or group of people occupying a single dwelling.
Integrated approach is an approach that was developed based on integrated information, such as: physical components (land use/cover change, soil erosion, land classification, land capability, land suitability, and suitable crops) and public opinion components from the stakeholders (socio-economic, collective opinion, and land use policy).
Land is a delineable area of the earth’s terrestrial surface, encompassing all surface climate,
9
animal population, the human settlement pattern and physical results of past and present human activity (terracing, water storage or drainage, structures, roads, building) (FAO, 1995).
Land capability is the inherent capacity of land to perform under a given use. Land capability classification (LCC) is the description of a landscape unit in terms of its inherent capacity to sustain a desirable combination of flora and fauna. It is the technical assessment of potential sustainable uses of landscape units based on inherent characteristics of the land (Villanueva, 2005).
Land cover represents the natural and artificial compositions covering the earth’s surface at a certain location (Avery and Berlin, 1985). It is also defined as attribute of parts of the earth surface including vegetation, soil, ground water, and topographical features (Manshard, 1998) and also refers to earth surface condition that reflects the feature land cover and vegetation cover (Ministry of Forestry, 2006).
Land suitability is the fitness of a given area for a specific land use (FAO, 1976). The land may be considered in its present condition or after improvements. Land suitability assessment is a carried out by matching land use requirements to landscape unit characteristics and measuring the environmental responses of the landscape to land use management technologies (Villanueva, 2005).
Land use encompasses several different aspects of man’s relationship to the environment
(Avery and Berlin, 1985). It also refers to the purpose for which land cover is exploited. These uses can be as varied as agriculture, industry, recreation, or even wildlife conservation (Manshard, 1998).
Land use allocation is a spatial allocation exercise, the best way to achieve the integrated approach working within the common framework of GIS to provide the solutions.
Land use change is a change in the use or management of land by humans, which may lead to a change in land cover. Land cover and land use change may have an impact on the albedo, evapotranspiration, sources, and sinks of greenhouse gases, or other properties of the climate system, and may thus have an impact on climate, locally or globally (Lambin et al., 2003).
Land use planning is the conscious process of selecting and developing the best course of action to accomplish the efficient intensive use of the land resources (Hudson, 1981 cited by Oszaer, 1994).
Multi-Criteria Analysis (MCA) is a decision support approach developed for complex problems involving tradeoffs between multiple objectives, where both quantitative and qualitative aspects of the problem can be addressed (Mendosa et al., 1999).
Participatory is a process in which the people (stakeholders) are directly involved in the study.
10
Primary data are data gathered by the on going activity or project. These data may be the result of field measurements (including sketches) from resource inventories and survey or from interviews (for example: focused group discussions, workshop, and meeting (Bantayan, 2006).
Priority is a relative position or degree of value in a graded group or the process of positioning items such as individuals, groups or businesses on an ordinal scale in relation to others. A list arranged in this way is said to be in priority order.
Secondary data are data that already exist in some form and only need to be collected, organized and encoded into a text editor, spreadsheet or database following some pre-determined format (Bantayan, 2006).
Spatial data describe the absolute and relative location of geographic features. Spatial data use location, within a coordinate system, as its reference base. The most common representation of spatial information is a map on which the location of any point could be given using latitude and longitude (Bantayan, 2006).
Stakeholder is a person with a specific stake, experience or interest in the topic addressed. A stakeholder can be a government official, research scientist, non government organization (NGO) member, extension officer or practitioner such as a fisher or a farmer.
11
CHAPTER 2
DESCRIPTION OF THE STUDY AREA
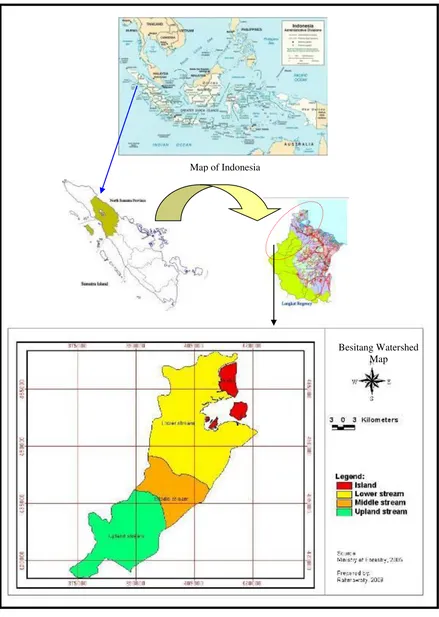
The study was conducted in the Besitang Watershed (Figure 2.1), from March to September 2008. Besitang Watershed has an area of 100,035 ha excluding the islands. In the border of Malaka Strait in the East, there are islands that have an area of 5,089 ha. Geographically, it is located between 97o 50’00” to 98o 20’ 00” east longitude and 03o45’ 00” to 04o15’ 20” north latitude. It is bordered by the Province of Nangroe Aceh Darussalam in the North, Sei Lepan Watershed in the South, Malaka Strait in the East, and the Province of Nangroe Aceh Darussalam in the West (Figure 2.2). It is divided by three sub-watersheds, namely: upland stream, middle stream, and lower stream (Ministry of Forestry, 2005). The area is shown in Table 2.1 and was delineated in Figure 2.2.
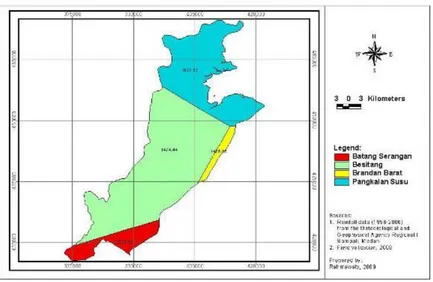
Administratively, Besitang Watershed lies in the Langkat Regency, North Sumatra Province, Indonesia. It consists of five sub-districts, namely: Besitang, Barandan Barat, Padang Tualang, Pangkalan Susu, and Sei Lepan (Table 2.2 and Figure 2.3). Each sub-district is divided into several villages, except in Padang Tualang Sub-district which has no village because of Gunung Leuser National Park. In Besitang Sub-district, there are 11 villages, namely: Bukit Kubu, Bukit Selamat, Halaban, Kampung Lama, Pekan Besitang, Salahaji, Sekoci, Serang Jaya, Suka Jaya, Bukit Mas, and PIR ADB Besitang. In Brandan Barat, there are four villages, namely: Lubuk Kertang, Pangkalan Batu, Lubuk Kasih, and Sei Tualang. In Pangkalan Susu (Figure 2.4), there are 14 villages, namely: Alur Cempedak, Beras Basah, Bukit Jengkol, Damar Condong, Limau Mungkur, Pangkalan Siata, Paya Tampak, Pematang Tengah, Pintu Air, Sei Meran, Sungai Siur, Tanjung Pasir, Perkebunan Damar Condong, and Perkebunan Perapen. Sei Lepan is one village, namely: Telaga Said (Appendix Table 1).
Table 2.1. The area of Besitang Sub-watershed
SUB-WATERSHED AREA
Ha %
Upland stream 30,815 30.80
Middle stream 16,722 16.72
Lower stream 52,497 52.48
12
Table 2.2. The five sub-districts included in the study area
SUB-DISTRICT
AREA
Ha %
Besitang 71,213 71.19
Brandan Barat 1,019 1.02
Padang Tualang 2,823 2.82
Pangkalan Susu 24,266 24.26
Sei Lepan 714 0.71
Total 100,035 100.00
13
Figure 2.2. Map of study area Map of Indonesia
14
Figure 2.3. Pangkalan Susu Sub-District in Besitang Watershed
15
CHAPTER 3
SOCIO-ECONOMIC CHARACTERISTICS OF THE STUDY AREA 3.1. Data Collection for Socio-Economic Information
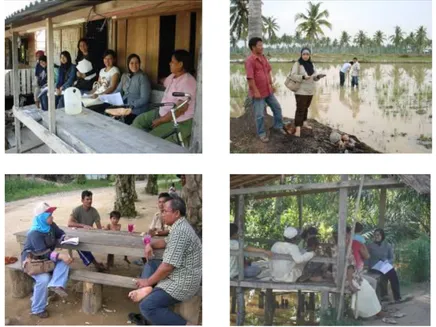
Socio-economic information were gathered based on primary and secondary data. Primary data were collected from interviews during field survey (Figure 3.1). The study largely relied on the use of questionnaire at village and household level. Secondary data were collected from the Regional Statistical Office which are related to the study, such as: Langkat Regency in Figure (2007), Besitang in Figure (2007), Brandan Barat in Figure (2007), Padang Tualang in Figure (2007), Pangkalan Susu in Figure (2007), and Sei Lepan in Figure (2007).
The sample selection was based on random sampling, using the Slovin’s Statistical Formula:
2
1 Ne
N n
(3.1)
where,
n = sample size (the number of household to be interviewed) N = population size (total number of household)
e = desired margin of error/level of precision (10% of margin error)
16
In this study, the level of precision or sampling error (e) was set at ten % because of time and budget constraints. The household heads or representatives of the families served as the respondents. The number of household was randomly selected. Based on the data and formula above, the number of samples (selected sample) was 100 respondents. To determine the sample size from each village in Besitang Watershed, the following formula was used:
N nN
n 1
1 (3.2)
where,
n1 = sample size determined from each sub-district
n = sample size for all sub-districts
N = total number of household in all sub-districts N1 = total number of household in each sub-district
The distribution of households based on sub-district of Besitang Watershed and the corresponding sample size per sub district as shown in Table 3.1.
Table 3.1. Sample size per sub-district
SUB-DISTRICT TOTAL HOUSEHOLD SELECTED SAMPLE
Besitang 12,979 46
Brandan Barat 2,985 10
Padang Tualang 0 0
Pangkalan Susu 11,592 41
Sei Lepan 814 3
Total 28,370 100
The socio-economic data needed to support the analysis in this study consist of population, farm land ownership, agricultural production, and other related data that were gathered from the area. The data gathered were encoded and processed in the computer using the Statistical Package for the
Social Sciences(SPSS) Program and Microsoft Office Excel.
3.2. Population of the Besitang Watershed
Sub-17
district in Besitang Watershed. This is because only a few area of Brandan Barat and Sei Lepan Sub-districts are included in Besitang Watershed. The majority of these areas are included in other watershed that are located near the Besitang Watershed. Padang Tualang Sub-district area which is included in Besitang Watershed is a protected area that is Gunung Leuser National Park.
Table 3.2. Population and number of household in the study area
SUB-DISTRICT POPULATION %
NUMBER OF
HOUSEHOLD %
Besitang 63,505 50.13 12,979 45.75
Brandan Barat 12,589 9.94 2,985 10.52
Padang Tualang 0 0.00 0 0.00
Pangkalan Susu 48,198 38.05 11,592 40.86
Sei Lepan 2,378 1.88 814 2.87
Total 126,670 100.00 28,370 100.00
3.3. Demographic Characteristics of the Respondents
Gender/Sex. Of the total of 100 respondents, 90 % are male and ten % were female (Table 3.3).
Age of respondent. The respondents range in age from 21 – 70 years. The majority of the respondents are 31-40 years old (38%), followed by 41-50 years old (37%) (Table 3.3).
Civil status. Of the total of 100 respondents, 97 % are married and two % were single. Only one % is widowed.
Time of stay in the area. Majority of respondents (44%) have stayed in the area for more than 20 years. About 22 % of the respondents have stayed in the area for 40-49 years and 22 % also for 30-39 years, followed by 30-30-39 and 10-19 years of stayed in Besitang Watershed (each 19%). Only ten % of the respondents have stayed in the area for more than 49 years and only eight % respondents have stayed in the area (Table 3.3).
Family size. Most of families (48%) have a family size of 3-4 members, while 28 % have 1-2 members. Other families (24%) have 5-6 members (Table 3.3).
Education. Survey findings revealed that 35 % of the respondents finished elementary school, 27 % were in senior high school, 22 % were in junior high school, 11 % were in college, and only 5 % had no formal schooling (Figure 3.2).
18
Table 3.3. Demographic characteristics of the respondents in Besitang Watershed
INFORMATION
NUMBER OF
RESPONDENT % Gender
Male 90 90
Female 10 10
Total 100 100 Age range (years)
<= 30 10 10
31-40 38 38
41-50 37 37
>=51 15 15
Total 100 100 Civil status
Married 97 97
Single 2 2
Widow/Widower 1 1
Total 100 100 Time of stay in the area (years)
< 10 8 8
10-19 years 19 19
20-29 years 19 19
30-39 years 22 22
40-49 years 22 22
> 49 years 10 10
Total 100 100 Number of people in household (people)
1-2 28 28
3-4 48 48
5-6 24 24
Total 100 100
Educational Attainment 5%
35%
22% 27%
11%
No formal schooling Elementary
Junior high school Senior high school College/university
19
Ethnic Groups 17%
4%
40% 13%
5% 19%
2%
Melayu
Karo Jaw a
Batak Aceh Banjar
Padang
Figure 3.3. Ethnicity of the respondents 3.4. Source of Income of the Respondents in Besitang Watershed
The people in Besitang Watershed obtain their income primarily from farming (67%), followed by other occupation such as: trader and service (14%), government employee (9%), fisherman (6), and private employee (4%). Majority of the people have worked in their primary occupation for more than 12 years (70%). Majority of the people have monthly income from primary occupation below 2,000,000 Rupiah (77%), as is shown in Table 3.4.
20
Table 3.4. Primary source of income of the respondents
INFORMATION
NUMBER OF
RESPONDENTS % Primary occupation
Farmer 67 67
Government employee 9 9
Fisherman 6 6
Private employee 4 4
Others (trader/service) 14 14
Total 100 100 Time of work in primary occupation (years)
1 – 3 7 7
4 – 6 13 13
7 – 9 2 2
10-12 8 8
> 12 70 70
Total 100 100 Monthly income from primary occupation (Rupiah)
< 1,000,000 41 41
1,000,000 – 1,999,000 36 36
2,000,000 – 2,999,000 15 15
3,000,000 – 3,999,000 1 1
4,000,000 – 4,999,000 2 2
5,.000,.000 5 5
Total 100 100
Note: 1 US Dollar equivalent of 10,500 Rupiah (2008)
3.5. Land Holding and Crop Production
21
Table 3.5. Secondary source of income of the respondents
INFORMATION
NUMBER OF
RESPONDENTS %
Secondary occupation
Farmer 17 17
Fisherman 2 2
Others (services and trader) 23 23
No secondary occupation 58 58
Total 100 100
Time of working secondary occupation (years)
1-3 13 13
4-6 13 13
7-9 2 2
10-12 6 6
> 12 8 8
No secondary occupation 58 58
Total 100 100
Monthly income from secondary occupation (Rupiah)
< 1,000,000 23 23
1,000,000 – 1,999,000 15 15
2,000,000 – 2,999,000 2 2
3,000,000 – 3,999,000 1 1
4,000,000 – 4,999,000 1 1
No secondary occupation 58 58
Total 100 100
Note: 1 US Dollar equivalent of 10,500 Rupiah (2008)
3.6. Preferred and Use of the Land
22
Table 3.6. Land holding and production level of the farm of the respondents
INFORMATION
NUMBER OF
RESPONDENTS %
Land ownership
Owner 22 22
Owner-operator 57 57
Lessee 19 19
No land 2 2
Total 100 100
Period of occupied the land (year)
< 1 1 1
1-2 10 10
3-4 9 9
5-6 1 1
> 6 77 77
No land 2 2
Total 100 100
Land holding of household (Ha)
< 3 49 49
3-5 42 42
6-8 7 7
No land 2 2
Total 100 100
Production level of the farm of household (ton/ha/year)
<3 23 23
3-5 51 51
6-8 15 15
9-11 3 3
> 11 6 6
No land 2 2
Total 100 100
23
Table 3.7. Preferred use of the landholding of the respondents
CHARACTERISTICS
NUMBER OF
RESPONDENTS %
Preferred land use
Agriculture land 68 68
Plantation land 16 16
Fish pond land 5 5
Agriculture and plantation 8 8
Agriculture and fish pond 3 3
Total 100 100
Use of land based on preferred land use
Source of primary income 72 72
Source of secondary income 17 17
Investment 3 3
Secondary income and investment 8 8
Total 100 100
Decision maker in deciding kind of crop to grow
Husband 25 25
Wife 2 2
Husband and wife 57 57
Government 6 6
All of family members 10 10
Total 100 100
3.7. Extension Workers
24
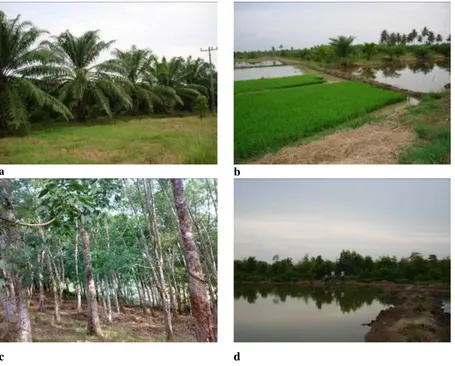
a b
c d
Figure 3. 4. Land use in Besitang Watershed: a. oil palm plantation, b. rice field, c. rubber plantation, and d. fish pond
Table 3.8. Extension workers in Besitang Watershed
CHARACTERISTICS
NUMBER OF
RESPONDENTS %
The extension worker attendance in the area
Attended 93 93
No attended 7 7
Total 100 100
Number of extension workers
1-2 77 77
3-4 16 16
No extension worker 7 7
Total 100 100
Time spent by extension worker in the area
1-4 times a week 72 72
1-4 times a month 12 12
1-4 times a year 9 9
Never 7 7
25
CHAPTER 4
INTEGRATED APPROACH USING GIS AND AHP
Information for integrated approach were gathered based on primary and secondary data. There are two information needed related to this approach, namely: physical information and collective opinion information. Physical information data were prossessed using Geographical Information System (GIS) and collective opinion information were prossessed using Analytical Hierarchy Process (AHP) as a tool.
4.1. Physical Information
Primary data were collected through a field survey. Ground survey was conducted to gather soil data. Rainfall data were collected from station points in the watershed area. To gather the soil data, the area was divided into three sub-watersheds (Table 2.1). Then, the area was divided into 12 decision zones (DZ). The upland stream sub-watershed was divided into four decision zones (DZ 1 to DZ 4), the middle stream sub-watershed was divided into three decision zones (DZ 5 to DZ 7), and lower stream sub-watershed was divided into five decision zones (DZ 8 to DZ 12). The decision zones are sites of more or less common features, that is, homogenous regions. This not only facilitated the analysis procedure, but also allowed the decision-maker to make well informed assessments regarding the area (Bantayan, 1996).
The decision zones were identified using land system. The basic concept of land system is to divide the landscape into area meaningful for development planning. The land system concept is based on ecological principles and presumes closely interdependent links between rock types, hydroclimatology, land form, soils and organism. The same land system is recognized wherever the same combination of such ecological or environmental factors occurs. A land system therefore, is not unique to one locality only, but in all areas having the same environmental properties. Furthermore, because a land system consists always of the same combination of rocks, soil and topography it has the same potential, and limitation, wherever it occurs.
In this study, soil samples were taken from the area based on land system/decision zone. The fifteen soil samples were analyzed to get physical characteristics. They include slope, flood hazard, soil dept, temperature, texture, cation exchangeable capacity (CEC), saturation, pH (H2O), and
Na-exchange.
26
secondary rainfall data 1996-2006 was retrieved from the Meteorological and Geophysical Agency Regional I Sampali, Medan, North Sumatra. They were used to derive the rainfall erosivity factor (R). Erosivity Map (R) is gained from rainfall stations point survey and monthly rainfall data. Generalizing the stations over the study area was done by creating Thiessen polygons in ArcView GIS. The rainfall erosivity factor (R) was calculated using Lanvine Formula:
36 . 1
) ( 21 .
2 m
m Rain
R (4.1)
where:
Rm = Monthly rainfall erosivity
(Rain)m = Monthly rainfall (cm)
Secondary data were gathered from different offices. These are:
1. Langkat administrative map (2003) was obtained from combination earth feature of Indonesia map/Peta Rupa Bumi Indonesia (RBI) or what is called as basic map with scale 1:50000. This map was released by Langkat District government which also relate with RBI map. This map covered all district boundaries, sub-district, and village map in Langkat.
2. Watershed boundary map was obtained from the Ministry of Forestry (2005) (the Wampu Sei Ular
Watershed Management Bureau).
3. Rainfall (Monthly) data (1996-2006) were retrieved from the Meteorological and Geophysical Agency Regional I Sampali, Medan.
4. Soils type and soil erodibility factor (K) were obtained from the Ministry of Forestry (2005).
5. Topography and slope maps were obtained from the National Coordinating Agency of Survey and
Mapping (BAKOSURTANAL) (1982) and the slope length factor (L) and slope gradient factor (S) were obtained from the Ministry of Forestry (2005).
6. Land use maps (1990, 2001, and 2006) and cropping management factor (C) and the erosion control practice factor (P) were obtained from Landsat image interpretation by BAKOSURTANAL and the Ministry of Forestry. They were gained from a guided satellite image interpretation and a visual interpretation. The geographical land use map coverage was based on Besitang Watershed boundary with the same extent as the previous point.
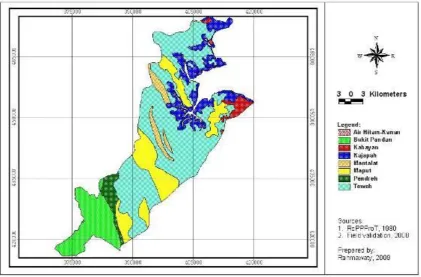
7. Land system map was based on Regional Physical Planning Programme for Transmigration
(RePPProT) survey in 1980 and which is still in use until now.
8. The land use/forest classification map based on Decrees of Ministry of Forestry Number 44 (2005)
27
9. Langkat Regional Spatial Management Planning map (RTRWK) based on the spatial management
planning related to regional land uses (2002-2011) was obtained from the Regional Development Planning Board of Langkat Regency (BAPPEDA).
10. Soil depth in Besitang Watershed was obtained from the Ministry of Forestry (2005).
Other informationsuch as: explanatory booklet of the land unit and soil map of the Medan sheet (0619) Sumatra (1990), the field technique planning for Land Rehabilitation and Soil Conservation in Besitang Watershed (2005), Main Report (Review of Phase I Result, Sumatra) of RePPProT (1988) Volume I and II, the Spatial Management Plan Related to Regional Land Uses in Langkat Regency (RTRWK) 2002-2011 and the Regional Langkat Government Regulation Number 03 (2006) about the Langkat Regency Development Planning (2006-2010) were obtained from BAPPEDA.
4.2. Physical Characteristics of the Study Area 4.2.1. Rainfall and Erosivity Factor (R)
Rainfall in Besitang Watershed was obtained from four metereological stations spread over the area, namely: Batang Serangan, Besitang, Brandan Barat, and Pangkalan Susu Station. The 11-year rainfall data (1996-2006) (Appendix Tables 2, 3, 4, and 5), show rainfall intensities in Besitang Watershed, Batang Serangan Station have the highest rainfall intensity (27.5 mm/day). Based on Decrees of Ministry of Agriculture Number 837/Kpts/Um/11/80 and Number 63/Kpts/Um/8/81, it was classified as Class 3 (moderate), followed by Besitang Station and Pangkalan Susu Station. Brandan Barat Station has the lowest rainfall intensity of the four stations as shown in Table 4.1.
Table 4.1. Mean rainfall intensity and its score value in Besitang Watershed
METEROLOGICAL STATION NAME
RAINFALL INTENSITY
(MM/DAY) CLASS SCORE DESCRIPTION
AREA
Ha %
Batang Serangan 27.5 3 30 Moderate 8,051.4 8.01
Besitang 18.6 2 20 Low 58,906.3 58.89
Brandan Barat 15.5 2 20 Low 2,473.9 2.47
Pangkalan Susu 18.2 2 20 Low 30,603.4 30.59
Total 100,035.0 100.00
28
Table 4.2. Mean annual rainfall, monthly rainfall, and erosivity in Besitang Watershed
METEOROLOGICAL STATION NAME
ANNUAL RAINFALL (MM/YEAR)
MONTHLY RAINFALL (CM/MONTH)
EROSIVITY (R) (MM/YEAR)
AREA
Ha %
Batang Serangan 3,483.5 29.0 3,230.0 8,051.4 8.01
Besitang 2,070.0 17.3 1,474.4 58,906.3 58.89
Brandan Barat 2,090.2 17.4 1,475.1 2,473.9 2.47
Pangkalan Susu 2,156.9 18.0 1,637.6 30,603.4 30.59
Total 100,035.0 100.00
Based on Tables 4.1, 4.2, and Figure 4.1, more than half of the area in Besitang Watershed is represented by Besitang Meteorological Station (59%), followed by Pangkalan Susu Meteorological Station (31%). Only 8% of area is represented by the Batang Serangan Meteorological Station and represented only 3% of area is by the Brandan Barat Meteorological Station.
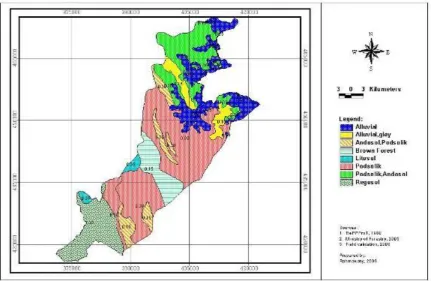
29 4.2.2. Soil Types and Soil Erodibility Factor (K)
Soil class according to susceptibility to erosion and score value are presented in Table 4.3. More than half of the soil type in Besitang Watershed is andosol-podsolik (53%), followed by alluvial-gley (16%), alluvial (15%), and regosol (13%). Only 3% is podsolik. The largest area is dominated by soil type Class 4 is susceptible to erosion (56%), followed by soil type Class 1 which is not susceptible to erosion (31%). Only 13% of soil type Class 5 is very susceptible to erosion.
There are three soil erodibility values varying from 0.05 (very low) up to 0.30 (moderate). The soils groups and soil erodibility factor (K) in Besitang Watershed are shown in Table 4.4. and Figure 4.2. The largest area is dominated by soil erodobility value of 0.3 (72%), which is classified as moderate, followed by soil erodobility value of 0.15 (16%), which is classified as low. Only 13% has soil erodibility value of 0.05 (very low).
30
Table 4.3. Soil types in Besitang Watershed
CLASS SOIL TYPE SCORE DESCRIPTION AREA
Ha %
1 Alluvial 15 Not susceptible 15,084.4 15.08
1 Alluvial, Gley 15 Not susceptible 15,649.3 15.64
4 Podsolik 60 Susceptible 3,150.6 3.15
4 Andosol, Podsolik 60 Susceptible 53,245.7 53.23
5 Regosol 75 Very susceptible 12,904.6 12.90
Total 100,034.6 100.00
Table 4.4. Soil groups and their soil erodibility factor (K) in Besitang Watershed
SOIL GROUP ERODIBILITY (K)
CLASS AREA Ha %
Dystropepts, Tropudults, Troportens 0.30 Moderate 12,904.6 12.90
Tropaquepts, Fluvaqurnts, Tropohemists 0.30 Moderate 2,249.5 2.25
Hydraquents, Sulfaquents 0.05 Very low 12,834.9 12.83
Dystropepts, Tropudults 0.30 Moderate 3,320.6 3.32
Dystropepts, Tropudults, Humitropepts 0.15 Low 15,649.3 15.64
Tropudults, Dystropepts 0.30 Moderate 3,150.6 3.15
Tropudults, Dystropepts, Eutropepts 0.30 Moderate 49,925.1 49.91
Total 100,034.6 100.00
4.2..3. Land Systems and Decision Zones
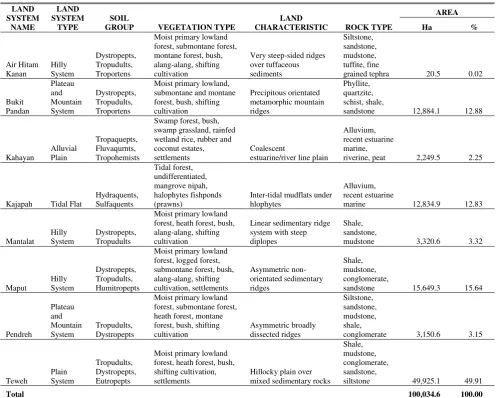
Land system is based on Regional Physical Planning Programme for Transmigration (RePPProT) survey in 1980 and still being used. Basic concept of land system is to divide the landscape into areas meaningful for development planning. The land system concept is based on ecological principles and presumes closely interdependent links between rock types, hydroclimatology, land form, soils and organism. The same land system is recognized wherever the same combination of such ecological or environmental factors occurs. A land system therefore, is not unique to one locality only, but considers all areas having the same environmental properties. Furthermore, because a land system consists always of the same combination of rocks, soil and topography it has the same potential, and limitation, wherever it occurs. In Besitang Watershed, there are eight land systems as presented in Table 4.5. and are shown in Figure 4.3.
31
Land Systems, Decision Zone 2 is located in Pendreh Land System, Decision Zones 3, 5, and 10 are located in Maput Land System, Decision Zones 4, 6, and 11 are located in Teweh Land System, Decision Zones 7 and 8 are located in Mantalat Land System, Decision Zone 9 is located in Kahayan Land System, and Decision Zone 12 is located in Kajapah Land System (Table 4.6. and Figure 4.4). Based on the explanation above, look that the decision zones areas were different each others and have broad scale. Hence, for detailed information and assessment (planning), need to rearrange the area of decision zone by stakeholder participation considering the interaction among land uses (ecological interaction).
Table 4.5. Land systems in Besitang Watershed
LAND
GROUP VEGETATION TYPE
LAND
CHARACTERISTIC ROCK TYPE
AREA
sandstone 12,884.1 12.88
Kahayan wetland rice, rubber and coconut estates,
Kajapah Tidal Flat
Hydraquents, forest, heath forest, bush, alang-alang, shifting
sandstone 15,649.3 15.64
Pendreh
conglomerate 3,150.6 3.15
Teweh forest, heath forest, bush, shifting cultivation,
siltstone 49,925.1 49.91
Total 100,034.6 100.00
32
Table 4.6. Decision zones and land systems in different sub-watersheds of Besitang Watershed
SUB-WATERSHED LAND SYSTEM DZ
AREA Ha %
Upland stream Air Hitam Kanan and
Bukit Pandan 1 12,904.6 12.90
Pendreh 2 3,150.6 3.15
Maput 3 3,490.5 3.49
Teweh 4 11,269.6 11.27
Middle stream Maput 5 7,402.2 7.40
Teweh 6 8,441.4 8.44
Mantalat 7 878.5 0.88
Lower stream Mantalat 8 2,442.1 2.44
Kahayan 9 2,249.5 2.25
Maput 10 4,756.6 4.75
Teweh 11 30,214.1 30.20
Kajapah 12 12,834.9 12.83
Total 100,034.6 100.00
Note: DZ = Decision zone
33 4.2.4. Soil Depth
Soil depth in Besitang Watershed as shown in Table 4.7., ranges from moderately deep class to deep class. The majority of the areas in Besitang Watershed has soil depth of more than 90 cm (87%) followed by 60-90 cm of soil deep (13%). Soil depth in Besitang Watershed is depicted in Figure 4.5.
Table 4.7. Soil depth in Besitang Watershed SOIL DEPTH
(CM)
SOIL DEPTH CLASS
AREA
Ha %
< 30 Very shallow - -
30 - 60 Shallow - -
60 - 90 Moderately deep 13,308.7 13.30
> 90 Deep 86,726.3 86.70
Total 100,035.0 100.00
34
4.2.5.The Slope Length Factor (L) and Slope Gradient Factor (S)
Topography and slope maps were obtained from the National Coordinating Agency of Survey and Mapping (BAKOSURTANAL) (1982) and the slope length factor (L) and slope gradient factor (S) were obtained from the Ministry of Forestry (2006) which are shown in Table 4.8. and depicted in Figure 4.6. The largest area is flat with 0 – 8% slope (73%). Only 27% of the area has a slope of greater than 8%.
The extent of slope classes and LS factor values in the computation of erosion rate with USLE formula of the watershed is listed in Table 4.8 and depicted in Figure 4.6. Slope or LS factor values used are based on the classification of the Ministry of Forestry (1993) through experimentation. It seems that the distribution of slope class value is an important factor affecting computed erosion rate. The higher the LS values, the higher the erosion rate, other factors being equal.
Table 4.8. Class of slope and LS values in Besitang Watershed CLASS SLOPE
(%)
SCORE DESCRIPTION LS
VALUES
AREA
Ha %
1 0 – 8 20 Flat 0.4 73,274.2 73.25
2 8 – 15 40 Moderate 1.4 6,542.6 6.54
3 15 – 25 60 Steep 3.1 4,751.5 4.75
4 25 – 40 80 Steeper 6.8 5,021.1 5.02
5 > 40 100 Steepest 9.5 10,445.7 10.44
Total 100,035.0 100.00
35
4.2.6. The Cropping management factor (C) and the erosion control practice factor (P)
The cropping management factor represents the ratio of soil loss from a specific cropping or cover condition to the soil loss from a tilled, continuous fallow condition for the same soil and slope and for the same rainfall. This factor includes the interrelated effects of cover crop sequence, productivity level, growing season length, cultural practices, residue management, and rainfall distribution (Kirkby and Morgan, 1980 cited by Ozsaer, 1994).
The cropping management factor of the USLE represents an integration of several factors that affect erosion including vegetation cover, plant litter, soil surface, and land management. Imbedded in the term is a reflection of how intercepted reformed raindrops on the plant canopy affect splash erosion. The binding effect of plant roots in preventing erosion and how the properties of soil change as it lie idle are considered (Brooks et al., 1991). Furthermore, the C factor represents how crops and management affect raindrops and flow of water or runoff to reduce soil erosion. The C factor value is actually how much that particular crop and management situation will reduce erosion. In Indonesia, the management cropping and C factor value are shown in Table 4.9.
The erosion control practice factor values for the three major mechanical practices as recommended by Wischmeier and Smith (1978) are shown in Table 4.10. The soil conservation
36
practices and their corresponding P values used by the Indonesian Soil Research Institute are presented in describing sediment yield as shown in Table 4.11. In Indonesia, the cropping management factor and conservation practice factor and their corresponding CP values are shown in Table 4.12.
Table 4.9. Management cropping and C value
NO. TYPE OF PLANT/LAND MANAGEMENT C VALUE
1 Grass (Brachiria sp.) 0.290
2 Monggo bean (Phaseolus radiatus) 0.35
3 Wheat (Triticum aestivum) 0.242
4 Cassava (Manihot esculenta) 0.363
5 Soy bean (Glycine maximum) 0.399
6 Vetiver root (Vetivera ziazinodes) 0.434
7 Dry land Paddy (Oriza sativa) 0.560
8 Wetland Paddy (Oriza sativa) 0.010
9 Corn (Zea mays) 0.637
10 Ginger (Zingiber officinale), Chili (Capsicum annuum) 0.900
11 Potato that plant follow the slopes 1.00
12 Potato that plant follow the contour 0.350
13 Planting system with rotated + mulch 0.079
14 Planting system without rotated + mulch 0.347
15 Planting system without rotated 0.398
16 cropping system with rotated + mulch 0.357
17 Mix garden
High density 0.1
Medium density 0.2
Low density 0.5
18 Sifting cultivation 0.4
19 Land with management 1.000
20 Empty land without management 0.950
21 primary forest
High ground cover 0.001
low ground cover 0.005
22 Forest production
Unselective cutting 0.5
Selective cutting 0.2
23 Primary bush/scrub 0.010
24 Coarse grass permanent 0.020
25 Coarse grass with burn 0.700
26 Paraserianthes falcataria with bush 0.012 27 Paraserianthes falcataria without bush and litter 1.000
29 Trees without bush 0.320
30 Rice field 0.01
37
Table 4.10. Erosion control practice factor value LAND SLOPE
%AGE
CONTOURING CONTOUR STRIP CROPPING AND
IRRIGATED FURROWS
TERRACING
1 - 2 0.60 0.30 0.12
3 – 8 0.50 0.25 0.10
9 – 12 0.60 0.30 0.12
13 – 16 0.70 0.35 0.14
17 – 20 0.80 0.40 0.16
21 - 25 0.90 0.45 0.18
Source: Kirkby and Morgan (1980) cited by Ozsaer (1994)
Table 4.11. Soil conservation practice and P value
TYPE OF SOIL CONSERVATION PRACTICE P-VALUE
Bench terrace
High standard 0.04
Medium standard 0.15
Low standard 0.35
Bench terrace: corn-cassava/soy been 0.056
Bench terrace: sorghum 0.024
Traditional terrace 0.40
Gulud terrace: paddy-corn 0.013
Gulud terrace: cassava 0.063
Gulud terrace: corn-peanut with mulch 0.006
Gulud terrace: soy been 0.105
Contour cropping
Slope gradient 0 – 8% 0.50
Slope gradient 9 – 20% 0.75
Slope gradient > 20% 0.90
Applied mulch
6 ton/ha/year 0.30
3 ton/ha/year 0.50
1 ton/ha/year 0.80
Plantation cropping
High ground cover 0.10
Medium ground cover 0.50
Grassland
High standard 0.04
Low standard 0.40
Sources: Hammer (1980) cited by Ozsaer (1994); Abdurrachman et al. (1984) cited by the Watershed Management Bureau (2005); Arsyad (2006)
38
Table 4.12. Estimation of CP factor values of different land uses
NO. MANAGEMENT CROPPING AND CONSERVATION CP VALUES
1 Forest
Primary 0.01
Without ground cover and litter 0.05
Without ground cover 0.50
2 Bush/Scrub
Primary 0.01
Bush with grass 0.20
3 Garden
Talon garden (kebun-talun) 0.01
Pekarangan garden (kebun-pekarangan) 0.07
4 Plantation
High ground cover 0.01
Medium ground cover with coarse grass 0.02
Coarse grass with burn once a year 0.06
Vetiver root (Vetivera ziazinodes) 0.65
5 Agriculture cropping
Corm (umbi-umbian) 0.51
Bulk (biji-bijian) 0.51
Legume (kacang-kacangan) 0.36
Mixture (campuran) 0.43
Irrigated paddy (padi irigasi) 0.02
6 Cultivation
1 year plant-1 year no plant 0.28
1 year plant-2 year no plant 0.19
7 Agriculture with conservation
Mulch 0.14
Bench terrace 0.04
Contour cropping 0.14
Sources: Abdurrachman et al. (1984); Ambar and Syafrudin (1979) cited by the Watershed Management Bureau (2005)
Crop management factor (C) and soil conservation practices factor (P) in Besitang Watershed are also presented in Table 4.13., based on the cropping pattern and existing land use, C and P values of the watershed. They were obtained from Ministry of Forestry. Figure 4.7. shows the existing or present land use of the watershed which serves as basis of values of crop management (C) and soil conservation practices (P) factors.
Table 4.13. CP factor of different land uses and their extent in Besitang Watershed
TYPES OF LANDUSE C FACTOR P VALUE
AREA
Ha %
Bush 0.25 0.40 5,029.3 5.03
Dry land agriculture 0.53 0.15 22,377.7 22.37
Primary forest 0.01 0.15 1,516.8 1.52
Secondary forest 0.01 0.60 36,571.5 36.56
Mangrove forest 0.17 0.40 5,362.8 5.36
Plantation 0.15 0.15 17,117.7 17.11
Wetland agriculture (rice field) 0.01 0.15 5,410.1 5.41
Swamp 0.09 0.40 372.5 0.37
Unvegetated 0.95 0.90 461.7 0.46
Fish pond 0.01 0.15 4,559.0 4.56
Water 0.00 0.00 1,255.7 1.26
39
4.3. Collective Opinion Information
Information for collective opinion were gathered from primary data (interviews during field survey and during the workshop) (Figure 4.8). The workshop was conducted to determine land use suitability allocation based on public opinion from stakeholders using AHP. The study largely relied on the use of questionnaire and key informant/stakeholder interviews. Key informants/stakeholders provided qualitative in-depth information about physical and socio-economic conditions of the study area. Key informants/stakeholders were local officers, extension workers, teachers, researchers, and people who know well the study sites at provincial, regional, sub-regional, and village level.
Secondary data were collected from offices which are related to the study. The following data and thematic layers were needed to support during the workshop, namely: socio-economic data, Langkat administrative map, watershed boundary map, land use (change) map, soil erosion map, land capability and land suitability classification map, land use classification map based on Decrees of Ministry of Agriculture Number 837/Kpts/Um/11/80 and Number 63/Kpts/Um/8/81 and RTRWK, forest function map based on Decrees of Ministry of Forestry Number 44 (2005), land system map, and decision zone map.
Figure 4.7. Map of CP values of different land uses in Besitang Watershed, Langkat, North Sumatra,
40
a b
c d
E f
Figure 4.8. Interviews and workshop with stakeholders for collective opinion Information: a. Head of Natural Resources and conservation Bureau b. Provincial Forestry Offices c. Head the Regional Development Planning Board of Langkat Regency (BAPPEDA). d. Plantation manager e,f. workshop at University of Sumatera Utara (USU).
4.4. Geographic Information System (GIS) 4.4.1. GIS Definition