WATER STATUS EVALUATION ON TERTIARY BLOCK FOR DEVELOPING LAND
USE PATTERN AND WATER MANAGEMENT STRATEGIES IN ACID SULFAT SOIL
OF SALEH TIDAL LOWLAND RECLAMATION AREAS OF SOUTH SUMATERA
Momon Sodik Imanudin*), M.E. Armanto, R.H. Susanto and S.T. Bernas Soil Science Department, Faculty of Agriculture, Sriwijaya University Campus of Sriwijaya University Indralaya Km 32 Palembang-Prabumulih
*)
Corresponding Author : Phone number : +62-711-580059 e-mail : [email protected] Received : April 1, 2009/Accepted : December 12, 2009
ABSTRACT
The aimed of the research is to evaluate the water status in the tertiary block of tidal lowland for developing cropping pattern and water management strategies for food crop agriculture. The research was conducted in tidal lowland reclamation areas of Delta Saleh South Sumatera. The methodology used this research was survey and monitoring. Data analysis was done by comparing the water status availability with the potential cropping pattern. Computer model of DRAINMOD had been used to estimate the water table status and to design water table control operation at tertiary blocks. Model adaptation for dry land condition (C-typhology) showed that the best scenario was land utilization pattern of rice-corn. This paper presented monthly water management operational plan for rice crop in first cropping season (MT1) during November-February period and for corn crop in second cropping season (MT2) during May-August period.
Keywords: Water status, Tidal lowland, acid sulfate soil, Surplus Excess Water (SEW-30) cm
INTRODUCTION
Tidal lowland development at South Sumatra has been conducted by government since 1969 through transmigration program, but the Bugis farmers had previously developed this area since 1930s. Tidal lowland areas in South Sumatra are located along eastern coast of Sumatra and approximately covered 2.92 million ha (Susanto, 2000). Total area of tidal lowland in South Sumatra that had
been reclaimed was 373000 ha. Recently was about 40% rice production at South Sumatra is currently produced from lowland areas and about 60% of this rice production was supplied from reclaimed tidal lowland areas (Susanto, 2007).
Most of reclaimed tidal swamp area in South Sumatra is located at the east coast. The land in this area is characterized by sulphate acid layers either in the potential or actual form. Field identification results showed that sulphate acid layers are affected by sea water fluctuation (tidal) and land hydrotophography classes. Reclaimed tidal swamp area of Delta Saleh is classified as potential sulphate acid land. Rice production level in this area was in average of 2.5-3.0 ton.ha-1 and cropping index was once per year (Imanudin et al., 2009). This low production was related to water status heterogenity found at farm tertiary blocks. Water availability in swamp area is directly related not only to crop evapotranspiration requirement, but also to dynamic of soil fertility status (Imanudin and Susanto, 2007).
during dry condition in which water table dropped below pyrite layer that produced oxidation process. Oxidation process produced sulphate acid which is followed by iron and aluminum precipitations that are harmful for plants. Land that had already experienced phyrite layer oxidation would be harmful for plants. Food crops in general are normally growth if phyrite was not oxidized. Food crops growth would be affected if pyrite layer was oxidized because of soil pH, low availability of Ca, Mg and P as well as excessive availability of Fe, Al, and Mn ions. It takes a long time to improve the land quality that experienced phyrite oxidation (Minh et al., 1998; Hussona et al., 2000). This is exaggerated due poor land leaching process because limited water availability and improper channel system (Bronswijk et al., 2000; Imanudin et al., 2009).
Tidal lowland development needs a proper planning, management, and utilization of land as well as proper technology application, especially water management aspect (Imanudin et al., 2009). The availability of acid sulphate layer is naturally occurred. This soil has a good potential for agricultural development through proper management. Proper planning of water management is certainly need data of daily soil water status, thus yearly monitoring of that data is essential. Water table dynamics below the crop root zone has highly significant influence on soil water Therefore, a field study to monitor water status at tertiary blocks is needed in order to develop water management and land utilization planning.
A computer model had been develepod to test the effectiveness of drainage system on micro levels. This model is called DRAINMOD (Skaggs, 1982). It was developed to evaluate water balance on shallow water table condition which made it very suitable to be used for tidal swamp areas (Susanto, 1999). This model was also well adapted to many land conditions according to characteristics of area
agro-climate. It was tested successfully at several countries such as America (Ale et al., 2008);
Australia (Xihua, 2006); Europe (Borin et al.,
2000), China (Zhonghua and Wan, 2006); and Indonesia (Susanto, 1999; Imanudin et al., 2009).
A study is needed to be done based on the above problems in order to evaluate the existing drainage system performance in controlling water table at tidal swamp areas by designing water management operational strategy at tertiary block levels. The use of computer model is need to be tested and developed because it can save time, labors, and cost. However, calibration process toward several parameters should be done in order to get a good result. The good result is represented by the similarity between model measurement results and field measurement results.
The study objective is to investigate the water table dynamics of tertiary blocks in order to determine suitable cropping pattern and operation for water table control. This data is important to develop water management strategy and cropping pattern potential of tidal lowland area in South Sumatra Indonesia.
MATERIALS AND METHODS
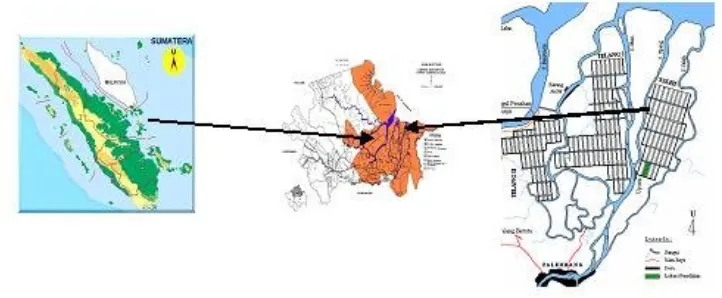
Study and field investigation was conducted in tidal lowland reclamation area. The demonstration plots (demplot) location is located at Primer 10, Delta Saleh, Banyuasin District (Figure 1). Study and field monitoring was conducted in two growing seasons consisting of wet and dry seasons. Observation period (water table monitoring) in the field was carried out from January to December 2005, whereas crop growth monitoring and field verification was conducted from November 2008 to November 2009.
Figure 1. Situation map of study area The research phases consisted of: 1) Survey
and monitoring, 2) Evaluation of water status at tertiary blocks, 3) Scenario design and computer simulation, and 4) Adaptation of DRAINMOD model. Soil survey is carried out to determine the physical characteristics of soil such as texture, bulk density, total pores volume, soil hydraulics conductivity, and acid sulphate layer depth.
The deficit and excess of water are aprroached using water excess concept above 30 cm rooting zone (Surplus Excess Water/SEW-30). According to Skaggs (1982), excess water at 30 cm depth will produce physiological disorder for most crops. It means that if soil water is above 30 cm, then there will be an excess water. This study used SEW 30 and corn as crop indicator as well as SEW 20 and rice as crop indicator (Imanudin et al, 2009). Excess water value above 30 cm can be calculated by the following relationship :
n
i i
x SEW
1 ) 30 (
30 [1]
where xi is water table depth at day i, i is the
first day and n is number of days during the crop growth.
DRAINMOD had been used as a tool for optimization and evaluation of water
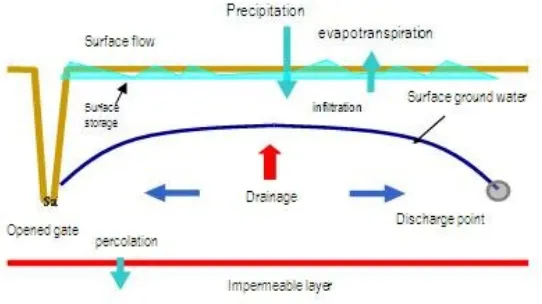
management system either in surface drainage or subsurface drainage. DRAINMOD model (Skaggs, 1982) is hydrological model to simulate water table fluctuation. The calculation base for this model is water balance analysis within a unit of vertical soil column per unit surface area starting from impermeable layer toward soil surface which is available between drainage channels. Calculation of water balance within soil profile at time DT is mathematically can be written as:
Ds D F Va
[2]
S RO F
P [3 ]
Figure 2. Components of water balance in DRAINMOD model
RESULTS AND DISCUSSION
General Overview of Land Physical Condition Delta Saleh reclamation area is classified into agroclimate type C1 based on Oldeman classification with monthly average temperature of 320C and yearly average rainfall of 2500-2800 mm. Rainy season is occured from October to April, whereas dry season is occured from May to September. Rainfall is relatively low and ineffective to fulfill the crop water requirement at dry season. This fresh water deficit problem is increase with the inflow of seawater or salt water during high tide.
Based on high tide water that overflow into the land, Delta Saleh lowland area in general is classified into C type overflow which means that it is not flooded during high tide or low tide. The land is not overflow by tide water, but the tide water still affected the water table in regular fashion. The available water is mostly from rainfall water because tide water can not enter the land which results in rain-fed characteristics of the land.
Soil characteristic at Delta Saleh is characterized by poor soil physical properties having bulk density less than 1 g/cm3, high total porosity (> 50%), and sandy clay texture at upper part (0-30 cm) and loamy clay texture at lower part (30-60 cm) as well as high soil hydraulic conductivity in the range of 6-9 cm/h. This characteristic produces very high water losses. The impermeable layer in this area was not developed yet due to low soil tillage intensity.
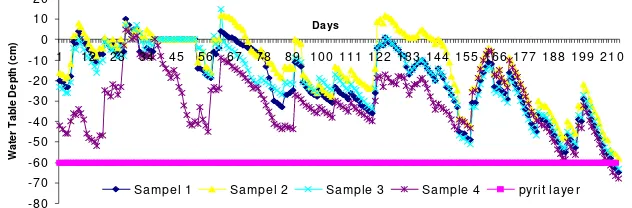
Water Table Dynamics on Tertiary Blocks Results of daily water table analysis showed (Figure 3) that water table depth is sharply drawdown more than 1.2 m below soil surface at dry season. This condition made crop cultivation is impossible even for the second crops. Crops will experience water stress as well as may experience toxicity. If the water table drawdown is below 1.0 m, then the pyrite layer oxidation will occur. The crop planting management is a key factor to prevent this condition.
Figure 3. Daily fluctuation of water table in tertiary block (November 2008-July 2009). The areas having C typology relative to pyrite layer depth in 60 below soil surface (dash-line).
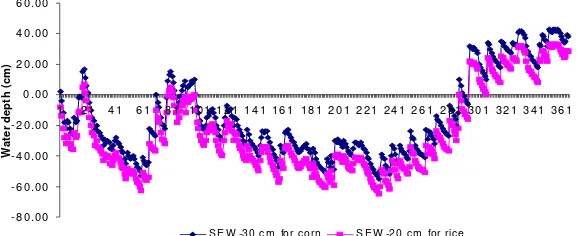
Excess water analysis at 30 cm of root zone during one year (SEW-30) showed that land with C typology experienced water deficit (Figure 4) about more than 6 months. Positive value of excess water is starting from October to January. This condition creates the opportunity for rice planting. However, SEW value is dropped again near the end of January which made the decrease of rice production because generative growth period experience water deficiency. In general Figure 2 showed that land experience longer period of water deficit (soil water is retained longer below the critical zone).Observation showed that soil water condition has positive value only for three months. This is the main constraint for crop planting at tidal lowland area of C typology which mean that land experience water deficit and most of water table depth is located below 30 cm depth. This figure is a critical threshold for most food crops; even rice crop has tolerance at 20 cm depth no more than 3 days. Cumulative calculation by summing up total positive and negative values during one year is shown in Figure 4. Yearly cumulative value that showed soil water deficit at 30 cm critical threshold was 5.434 cm. It is clear that water at this condition is insufficient to leach the land. The land will experience toxicity from iron and aluminum due to pyrite oxidation result that can be disposed into
channels through land leaching process without water management effort.
It is obvious from water availability analysis at the crop root zone that the land experience water deficit. Extended drawdown of soil water results in higher water volume that is needed for recharge process. Soil water condition above 30 cm zone is fulfilled at October. High hydraulics conductivity of soil due to high porosity made water difficult to be retained within long period, water is difficult to overflow, and lack of water for land leaching process.
Figure 4. Calculation results of excess water at 20 cm and 30 cm zones below the soil surface.
Developing Land Use Pattern
Field experimental showed that the water status in the farm unit strongly depended on the rainfall. It was due to the tide water could not be irrigated to the land. It means that the water level in the canal was still lower than farm level. Therefore the water management objective was to retain the water as much as possible. For that purpose, the installation of gate for water control in the tertiary canal is very essential.
To increase the water level in the tertiary canal and reducing water loses in rooting zone, the water control is required not only in tertiary canal but also in secondary canal. It was shown by the significant effect to maintenance ground water level in farm level. The evaluation result of SEW-30 (Figure 5), after improvement the water system showed that the water surplus occurred in the rainy season (November-February). Finally the rice growing performance is better than before making dam in drainage secondary canal.
Water management scenario based on cropping pattern plan that may be applied at study area that consisted of fallow, rice-corn, and corn-corn. Moreover, water management objectives that might be
conducted are water retention (permanently-closed gates) and water table control (controlled drainage) in which the gates is partly opened and channel water is not solely discharged to allow tidal water entering the channel. Based on water availability in the field the rice-corn is more suitable than rice-rice (Table 1). However socially this pattern is still difficult to applied and till now rice-fallow is still dominated the land use pattern.
For corn cultivation may start in April or May. The best time for planting is actually in April. However the main problems are due to the high ground water table and saturated condition of the soil, so to reduce soil moisture the drainage is required. Micro drainage system was applied, in the field and the best design was 8 m drain spacing with 30 cm depth. The concepts for drainage design could be intensive shallow drainage. It was made to avoid over drainage and pyrite oxidations. Actually the farmers do not agree with this, the reason is too hard work for making drainage canal. And they decided to delay planting and to start planting in May. This condition caused the land getting deficit water in the generative phase. And the crop failed due to water stress.
- 8 0 .0 0 - 6 0 .0 0 - 4 0 .0 0 - 2 0 .0 0 0 .0 0 2 0 .0 0 4 0 .0 0 6 0 .0 0
1 2 1 4 1 6 1 8 1 1 0 1 1 2 1 1 4 1 1 6 1 1 8 1 2 0 1 2 2 1 2 4 1 2 6 1 2 8 1 3 0 1 3 2 1 3 4 1 3 6 1
D a ys ( J a n u a r y- D e s e m b e r 2 0 0 5 )
W
a
te
r
d
e
p
th
(
c
m
)
Table 1. Cropping pattern potential in tidal lowland agriculture of C tipology Month
Type of
crop 11 12 1 2 3 4 5 6 7 8 9 10 11
Rice
Corn
Table 2. Adaptation of DRAINMOD model in developing land utilization pattern guidance at C-typology land (dry)
Water status condition in land No Months
Observation DRAINMOD simulation
Recommendation of land utilization
1 January Saturation Saturation Rice
2 February Saturation Saturation Rice
3 March Drop below soil surface, below zone of 30 cm
Drop below soil surface, below zone of 30 cm
Rice
4 April Saturation Saturation Bare soil
5 May Drop below soil surface, above zone of 30 cm
Drop below soil surface, above zone of 30 cm
Land preparation for corn
6 June Drop below soil surface, below zone of 30 cm
Drop below soil surface, below zone of 30 cm
Corn cultivation 7 July Drop below soil surface, below
zone of 30 cm
Drop below soil surface, below zone of 30 cm
Corn cultivation 8 August Drop below soil surface, below
zone of 30 cm
Drop below soil surface, below zone of 30 cm
Bare soil 9 September Drop below soil surface, above
zone of 30 cm
Drop below soil surface, above zone of 30 cm
Land preparation for rice
10 October Saturation Saturation Land preparation
for rice in first cropping system 11 November Flooding Saturation Rice cultivation in
first cropping 12 December Flooding Saturation Rice cultivation in
first cropping Model Drainmod model is sensitive to water table above 10 cm, flooding land is considered as water saturated soil (excess water status)
Figure 5. The calculated surplus excess water at 20 cm and 30 cm zones below soil surface after improving the water management (November-August 2009)
- 1 0 0 ,0 0 - 8 0 ,0 0 - 6 0 ,0 0 - 4 0 ,0 0 - 2 0 ,0 0 0 ,0 0 2 0 ,0 0 4 0 ,0 0 6 0 ,0 0 8 0 ,0 0
1 1 7 3 3 4 9 6 5 8 1 9 7 1 1 3 1 2 9 1 4 5 1 6 1 1 7 7 1 9 3 2 0 9 2 2 5 2 4 1 2 5 7 2 7 3 2 8 9
D a ys N o v e m b e r 2 0 0 8 - Ag u s t u s 2 0 0 9
W
a
te
r
T
a
b
le
(c
m
)
S E W - 2 0 c m S E W - 3 0
Developing Water Management Strategies using DRAINMOD
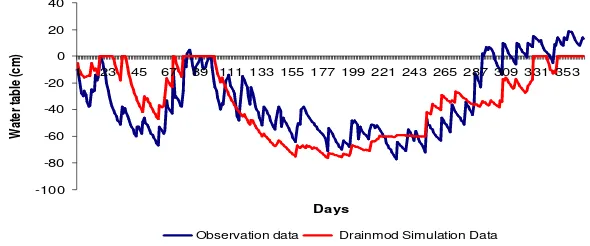
Analysis of water table depth variation either from computer simulation of DRAINMOD results or field measurement results can be referred to Figure 6. Water table fluctuations in general showed the similar pattern. Water table during rainfall period was located above phyrite layer, whereas it was located below phyrite layer during dry season. Land utilization scenario of C-type could be designed as shown in Table 2. The recommended land utilization pattern was rice-corn. The main target if farmers could carry out this scenario was that the frequency of crop planting could be doubled (IP 200).
The recommended water management scenario was land cultivation using cropping pattern of rice-corn in which rice was planted in first cropping season in November-January/February and corn was planted in April to June/July. Problem for corn crop cultivation was that soil still in water saturated condition in February, March and April which required drainage outflow. On the other hand, the water table dropped below 30 cm in early May that created water stress for corn. This condition required water retention in channels and irrigation if possible. Water table dynamics from DRAINMOD simulation result is shown in Figure 6.
Results of soil water status evaluation presented in Table 2 showed that under minimum water table control condition (conventional), the land still experienced significant water table drawdown although during condition of wet period. This was shown during rice crop reproductive phase (February) in which land experienced water table drawdown below zone of 30 cm so that plants faced water stress and decrease in production.
Experience in tidal swamp areas management of Vietnam showed that water table control was very important, i.e. the negative effect would be produced if water table dropped in zone of 60-90 cm below soil surface that represented by increase of aluminium accumulation and soil pH compared to water table control in zone of 30 cm below soil surface (Minh et al., 1998). Meanwhile, water manage-ment objectives that could be conducted was water retention (permanent water gate closing) and controlled drainage in which gates were partly opened and water in channel was not totally drained and there was possibility of high tidal water to enter the channel. Farmers are frequently kept the water by using plastic sack in height of 40-50 cm. This height provides high tide water to enter plastic sack weirs and some water are retained at tertiary channels during low tide water period.
Figure 6. Water table dynamics pattern from computer simulation DRAINMOD and field measurements
-100 -80 -60 -40 -20 0 20 40
1 23 45 67 89 111 133 155 177 199 221 243 265 287 309 331 353
Days
W
at
er
ta
bl
e
(c
m
)
Figure 7. Daily water dynamics from water table control using computer simulation of DRAINMOD model
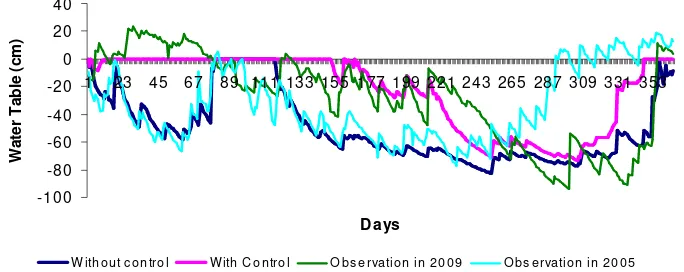
DRAINMOD was capable to estimate water table fluctuations in order to develop water management plan for application in the year of 2009 (Figure 7) only by using rainfall and soil physical characteristics data. Results of yearly water table observation showed deficit condition in which water table in land was frequently existed below zone of 30 cm even in wet season. This condition created water stress for rice crops. Computer simulation using DRAINMOD model recommended water gate operation at tertiary channel through water retention mode. The results indicated upward movement of water table located in zone of 30 cm and land was water saturated. This provides a good environment for a better growth of rice.
The model adaptation in field that was conducted in 2009 cropping season showed good results in which the effect of water gate retention and holding gate in secondary channels produced significant upward movement of water table (Figure 7). The availability of water in tertiary channel created condition of controlled water table and water could be retained in the field during rainfall period, which in turn made flooding land condition and had impact toward increasing of crops production. Production for the year of 2005 in average was 2.5 ton/ha, whereas production for 2009 increased with average of 4 ton/ha.
In the Figure 7 is clearly showed that there was water deficit in Delta Saleh area without water table control operation (data of 2005). The water table dropped far below acid
sulphate layer and the land practically could not be cultivated for almost a year. Computer simulation results showed that water table dropped below root zone of 0 cm even in wet season without water retention measure in tertiary channel. Therefore, most farmers agree to hold water during wet season, especially during rice crop cultivation.
Monthly water gates operation in tertiary level according to crop growth was shown in root zone. Water retention process was started since soil puddling up to seed sowing operation. The water disposal was conducted in seed sowing phase in which quarterly gates were opened so that water in land could be disposed through quarterly channels into tertiary channels.
Water gates were closed in tertiary channels during rice growth period from December to February. The closing operation was not fully closed but only about 40-50 cm. It is hoped that water can enter during high tide and water in tertiary block was not all disposed due to the retention action of gates at height of 40-50 cm during the low tide.
The recommended cropping pattern based on field study and suggestion from farmers was rice-corn. The gates operation
was mostly hold during rice crop cultivation that was started from October-December and January-February. The holding was done at 50 cm height. The water gate operation system is by holding water at 50 cm depth. This depth might provide water in tertiary channel be kept at 50 cm height, whereas water surface in tertiary channel upstream would be raised into 60 cm that made the entering of high tidal water to fill tertiary channel. The entering of high tidal water could also improved water quality and raised water surface in tertiary channel. This concept is known as combination of water retention and water supply.
Corn cultivation can be started if water table was dropped 30 cm below root zone. This can not be done directly after rice harvesting period because water table is still high that made soil layer within root zone was in saturated water condition. Therefore, the water gate was totally opened in March in order to flush accumulated acid elements during water retention at rice growth period. Computer simulation of DRAINMOD model had succeeded to develop monthly operational plan for water table control. The result of required water table for corn crops as an impact of water table control was shown in Figure 8.
Figure 8. Results of DRAINMOD simulation in term of water gate effect on water table control for corn crop
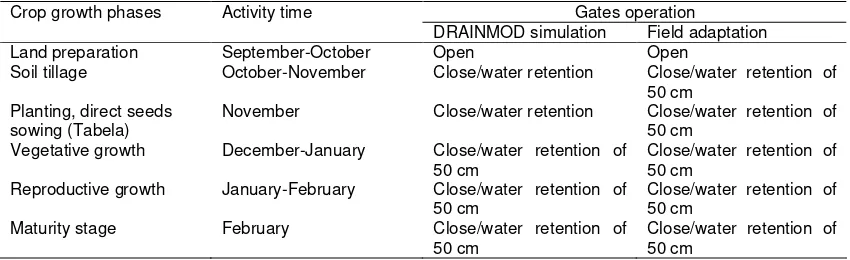
Table 3. Tertiary gate operation in the field for first cropping season of rice in December-February 2009 period.
Gates operation Crop growth phases Activity time
DRAINMOD simulation Field adaptation Land preparation September-October Open Open
Soil tillage October-November Close/water retention Close/water retention of 50 cm
Planting, direct seeds sowing (Tabela)
November Close/water retention Close/water retention of 50 cm
Vegetative growth December-January Close/water retention of 50 cm
Close/water retention of 50 cm
Reproductive growth January-February Close/water retention of 50 cm
Close/water retention of 50 cm
Maturity stage February Close/water retention of 50 cm
Close/water retention of 50 cm
-90 -80 -70 -60 -50 -40 -30 -20 -10 0
1 20 39 58 77 96 115 134 153 172 191 210 229 248 267 286 305 324 343 362
Days
W
a
te
r
T
a
b
le
(
c
m
)
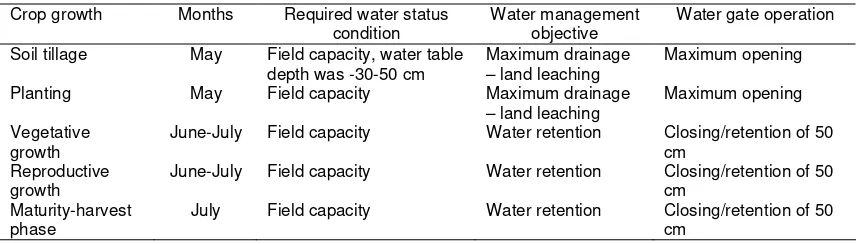
Table 4. Water management operational strategy for corn crop at C-typology land (dry condition) at Delta Saleh
Crop growth Months Required water status condition
Water management objective
Water gate operation Soil tillage May Field capacity, water table
depth was -30-50 cm
Maximum drainage – land leaching
Maximum opening Planting May Field capacity Maximum drainage
– land leaching
Maximum opening Vegetative
growth
June-July Field capacity Water retention Closing/retention of 50 cm
Reproductive growth
June-July Field capacity Water retention Closing/retention of 50 cm
Maturity-harvest phase
July Field capacity Water retention Closing/retention of 50 cm
Water table control operation for corn is shown in Table 4. Water gates were opened and tertiary channel should be equipped with smaller channels to lower water table during early corn planting. The water retention facilities and the entering of high tidal water were needed during generative phase of corn that was occurred in May-June. The efforts to control water table for corn had many constraints. Shallow condition of tertiary channel due to sedimentation made the water from quarterly channel and paddy field could not be discharged so that land was in water saturated condition on April. Farmers can do planting in the end of May. This made crop experienced water stress during generative phase because water table dropped below 60 cm in June-July. According to Zwart and Bastiaansen (2004), capillary water movement was not sufficient to fulfill crop evapotranspiration requirement if water table depth was dropped below 60 cm.
The effort to maintain field condition where water table depth was 40-50 cm below soil surface in dry season was very difficult. Recommended results of DRAINMOD simulation showed that to maintain field condition with water table close to 30 cm zone dictated water surface in tertiary channel should be in height of 40-50 cm. However, field fact showed that water in tertiary channel is always empty because high tidal water during dry season was not totally entering tertiary channel. The only way to maintain water table condition was that by closing the secondary drainage channel (DAM).
The strategy for corn crop cultivation was to accelerated cropping season so that
corn was not experience water stress in reproductive phase. Soil tillage should be started in April and crops can be planted in May. However, rainfall intensity in April was still available and soil was in water-saturated condition that required channel discharge at tertiary blocks. The above conditions dictated that network improvement for corn cultivation was by acceleration of corn cultivation in April retention through maximum utilization of rainfall water.
The potential cropping pattern at C-typology land was rice-corn based on water availability in land. Soil physical properties such as high porosity produced high hydraulic conductivity that create main problem of water losses.
Determination of water table dynamics at tertiary block could be conducted by using DRAINMOD program. Evaluation results show that this model could be used as a tool for estimating water status at tertiary blocks. Results of water table dynamics pattern from simulation was tend to be similar. These data showed that DRAINMOD model was acceptable.
land utilization pattern by using rice-bare soil. Monthly operational plan of water management for rice crop (first cropping season) was as follows: Water gates was opened (maximum drainage) at early phase of soil tillage (plowing); water control was needed by operating water gates as combination of supply and water retention in tertiary channel (kept at 50 cm) near the end of soil tillage. Water gates were opened (maximum drainage) in seeds sowing phase which was followed by operation of water gates as combination of supply and water retention until ripening stage. Field test showed that this operational system was capable to maintain water table condition in zone of 20 cm above soil surface.
Recommended operation for corn crop was dominated by water table control system in tertiary channel (water retention) where all water gates operation at all corn crop growth phases was as water retention and as water supply before the entering of salt water (June-July).
SUGGESTIONS
Application of water management in field should be supported by complete water management infrastructures, especially the availability of water gates in tertiary channel.
Water gates in tertiary channel are absolutely needed to hold water during crop growth period.
In order to minimize environment degradation and to accelerate land remediation process, water management operation should always be conducted even though land was not be cultivated.
ACKNOWLEDGEMENTS
We thank the Center for Land and Water Management Sriwijaya University, particularly Bakri and P. Bambang for their assistance and cooperation. We also thank P. Agus and Lowland and Coastal Data Information Center of South Sumatera for assistance with developing and installing the monitoring system in the field. The contribution of making to many aspects of the fieldwork is also gratefully acknowledged. This study was funded by Directorat Higher Education, Ministry of National Education.
REFERENCES
Ale, S., L.C. Bowling, S.M. Brouder, J.R. Frankenberger, and M.A. Youssef.
2008. Simulated effect of drainage
water management operational
strategy on hydrology and crop yield for drummer soil in the Midwestern United States. Journal of Agricultural Water Management 96: 653-665.
Borin M., F. Morari,G. Bonaiti , M. Paasch, and W.R. Skaggs. 2000. Analysis of AINMOD performances with different detail of soil input data in the Veneto region of Italy. Agricultural Water Management Journal. Agricultural Water Management 42: 259-272 Bronswijk, J.J.B., J.E. Groenenberg, C.J.
Ritsema, A.L.M. van Wijk, and K. Nugroho. 2000. Evaluation of water management strategies for acid sulphate soils using a simulation model: A case study in Indonesia. Agricultural Water Management 45: 127-143
Hussona, O., Mai Thanh Phungb and M.E.F. Van Mensvoort. 2000. Soil and water indicators for optimal practices when reclaiming acid sulphate soils in the Plain of Reeds, Viet Nam. Agricultural Water Management 45: 127-143 Imanudin, M.S. and R.H. Susanto 2007.
Potensi peningkatan produktivitas lahan pada beberapa kelas hidrotofografi lahan rawa pasang surut Sumatera Selatan. Prosiding Kongres Ilmu Pengetahuan Wilayah Indonesia Bagian Barat. Universitas Sriwijaya dan Lembaga Ilmu Pengetahuan Indonesia. Palembang.
Imanudin, M.S., R.H. Susanto, E. Armanto and S.M. Bernas. 2009. The use of drainmod model for developing strategic operation of water manage-ment in the tidal lowland agriculture areas of South Sumatera Indonesia. Proceeding of International Seminar on Wetland and Sustainability, Kota Kinabalu Sabah Malaysia.
sulphate soil in Vietnam. Agriculture, Ecosystems and Environment 255-262.
Skaggs, R.W. 1982. Field evaluation of water management simulation Model. Trans-action of the ASAE 25 (3): 666-674 Skaggs, R.W.1991. Drainage (in Hanks, J and
J.T. Ritchie, 1991). Modeling plant and soil system. ASA, CSSA, SSSA. Madison, Wisconsin.
Suryadi, F.X., dan B. Schultz, 2001. Effects of operation rules on water management in Tidal Lowlands. In: Proceedings Workshop On the Agricultural Based Development of Tidal Swamps and Estuaries and Environmental Consi-derations, Seoul, Korea.
Susanto, R.H 1999. Model area SSSIP: Landasan pro-OP jaringan reklamasi di Pulau Rimau dan Air Sugihan Kiri, Sumatera Selatan. Prosiding Seminar Hasil Penelitian BKS-PTN Barat Susanto, R.H,. 2000. Dampak South
Sumatera Swamp Improvement Project (SSSIP) di Sugihan Kiri Terhadap Pembangunan Pertanian. Prosiding Seminar-Lokakarya Nasional (SEMILOKA) Manajemen Daerah
Rawa dan Kawasan Pesisir, Palembang.
Susanto, R.H. 2007. Manajemen rawa terpadu untuk pembangunan berkelanjutan. Prosiding Kongres Ilmu Pengetahuan Wilayah Indonesia Bagian Barat. Unsri-LIPI. Palembang.
Xihua, Y. 2006. Evaluation and application of DRAINMOD in an Australian sugar-cane field. April 2006, Agricultural Water Management.95: 439- 446. Zhonghua, J. and L. Wan. 2006. Modeling net
water requirements for wetlands in semi-arid regions. Agricultural Water Management 8: 282–294.