Tina Memo No. 2000-006 Short Version published in:
British Journal of Radiology, 74, 234-242, 2001.
Mathematical Segmentation of Grey Matter, White Matter
and Cerebral Spinal Fluid from MR image Pairs.
N.A.Thacker, A.Jackson, X.P.Zhu and K.L.Li.
Last updated
2 / 3 / 2000
Imaging Science and Biomedical Engineering Division,
Medical School, University of Manchester,
Abstract
There have been many approaches to grey and white matter measurement in NMR images [1, 2, 4, 5]. For clinical use the estimated values must be reliable and accurate. Unfortunately, many techniques fail on these criteria in an unrestricted clinical environment. A recent method for tissue quantification in NMR image analysis has the advantage of great simplicity, while at the same time taking account of partial volume effects [3]. This technique makes use of two imaging sequences to provide three linearly independent linear equations. We show that, although the original mathematical solution could still be used with a specific set of modern sequences, there are advantages to generalising the solution which give far more scope for application and greater accuracy. A theoretical analysis is presented here, which is backed up with real images.
Background
The quantities of CSF, grey matter and white matter (pc, pg and pw respectively) can be used to estimate each
pixel grey levelg,
g1 = pcG1c + pgG1g + pwG1w
and
g2 = pcG2c + pgG2g + pwG2w
whereG1c ,G1g andG1w are the mean grey levels of pure tissue. These equations follow directly from the Bloch
equations for the NMR imaging process for a wide range of sequences and together with the constraint that the total quantity of matter must be equal to the volume, ie:
pc + pg + pw = 1
give enough information to solve for the three tissue quantities within any volume. Clearly the assumption that a pure tissue will give a constant signal response is a simplification in practice, particularly as field strength effects can produce position dependent sensitivity. Assuming that these effects can be appropriately removed we can go on to solve these equations to recover tissue proportions.
The method presented in [3] used a particular imaging sequence to generates an image in which the average proportion of tissueP within a volume generate a contribution to the average grey levelPgG1g + PwG1w which
averages out to zero. The average value ofG1 within the volume can then be used directly to estimatePc. Given
this and the other two equations, it is then a relatively easy matter to estimate Pc and Pw within the volume of
V voxels.
The second image was chosen to give good contrast between grey and white matter in order to give good accuracy for this process. However, the first image was selected to simplify the solution of the linear system. Unfortunately, although this was a relatively recent publication, the suggested imaging sequence has generally been replaced in clinical situations by Turbo/Spin-Echo for reasons of speed. This paper addresses the issue of updating the method to make use of modern imaging sequences.
Staying for a while within the solution framework adopted by Rusinek, can we find an imaging sequence for which the assumptions used in the solution will still hold, ie: is there a sequence for which the real signal intensity of the grey and white matter tissues produce grey level values which are approximately equal, opposite and small compared to CFS.
The expression for the signal intensities of brain tissues in an inversion recovery spin-echo (IRSE) sequence follows directly from the Bloch equations and is
S = N(H)(1−2×exp(−T I/T1) + 2×exp(−(T R−τ)/T1) − exp(−T R/T1))exp(−T E/T2)
where
τ = T E/2
by Rusinek for one of his imaging sequences. The modern equivalent to (IRSE) is the inversion recovery turbo spin-echo (IRTSE) sequence. The expression for the signal intensities of brain tissues in an IRTSE sequence
S = N(H)(1−2×exp(−T I/T1) + 2×exp(−(T R−TsNf)/T1) − exp(−T R/T1))exp(−T Eef f/T2)
whereTsis echo spacing andNf is the factor number of the TSE train.
The bloch equation has very similar form to that for IRSE and by careful selection of parameters we can achieve the same signal curves. We can use the same scan parameters (T Eef f = T E) and on the assumption thatN(H)
is the same for grey and white matter we will get equal amplitudes but different sign atT I = 600ms. The longer time delays for short echo train TSE read-out causes little differences in T1 weightings provided that long T R’s
are used (T R > 4000ms).
However, it is well known that IRTSE has different contrast to conventional ITSE, in particular:
• there is more crosstalk between slices due to a shorter 180o
rf pulse.
• there is more noise due to the wider bandwidth
• longT2 substance tends to be brighter because of averaging of later echoes.
• there is more magnetization transfer so that fat and grey matter are brighter on IRTSE images.
these four are the most important effects here are those that tend to increase the noise in the image and in practice modern scanners can produce images which are comparable to those used in the original work.
Methods
In the table below we give the parameters for seven scanning sequences used here.
Sequence TR(ms) TE(ms) TI(ms) TSE factor echo space (ms) CSF Grey White error
IRSE (R1) 5000 100 490 7 25 -1900 -100 100 60
IRSE (R2) 1400 30 425 3 15 -500 -50 400 90
IRTSE 6850 18 300 9 18 -1800 -650 -200 60
VE (PD) 5500 20 - 8 13.3 1475 1270 970 80
VE (T2) 5500 100 - 8 13.3 1450 435 320 80
Flair 6000 100 2200 19 10 250 750 550 30
CSF 8000 250 - 45 10.9 2070 100 100 30
Table 1
Given the correct NMR images, Rusinek’s method provides a straight-forward way of estimating tissue quantities in the brain. The calculation is simple and the method can be performed using a pocket calculator and some basic image display software, as the calculation is based upon mean grey levels within a region of interest. Unfortunately, it is not possible to generate pixel level partial volume probabilities, (ie: an image segmentation for visualisation), because the CSF measurement has to be averaged over a volume containing equal grey and white matter proportions for the assumption of grey and white matter cancellation to be valid. Any calculation performed at a particular pixel which contains mainly one tissue type will be biased. The general problem of cancellation may be quite common, as mean grey level values for nominally the same sequences can vary from machine to machine and due to brain disease. It is unfortunate that the technique is likely to give innacurate results for the very people for which an accurate measurement is most important.
However, these problems can be eliminated, and pixel level segmentation can be achieved, if the assumption of grey matter/white matter cancellation is not made and the tri-linear equations solved (using accurate mean grey level values for each tissue) within each voxelv as follows:
and
These equations revert to the original solution if we make the assumption thatG1g = G1w = 0. Once again
these equations are based directly upon the property of linear additivity of tissue to the image signal, which follows directly from Bloch equations for a wide variety of NMR sequences. As this solution takes no account of the noise process during image formation it is possible for these solutions to take non-physical values ie: Pi < 0 or
Pi > 1. These numbers cannot be interpreted directly as probabilities, though they are unbiased estimates of
tissue proportion. This is the correct solution for any pair of NMR images for which the mean tissue grey levels are linearly independent and we can use this algorithm on any other images which satisfy the same constraint. This also opens up the possibility of using the method for any triplet of tissues, not just CSF, white matter and grey matter in brain images. Also, we are free to select any pair of images which might deliver the required partial volumes with the best statistical accuracy. As we will now show, these are unlikely to be those used in the original method.
The process of NMR image formation contains several factors which can be modeled in a series of stages. The Bloch equations establish mean grey level values for particular tissues. Partial volume effects are modeled linearly, as in the assumptions for the derivation of the method described above. Finally there is the process of noise which perturbs the grey level values away from their nominal values. For the purposes of the following analysis we assume that the noise source can be modeled as the expected linearly weighted means plus a uniform measurement noise. This can be observed to be generally true for a wide range of NMR image sequences. Thus, the grey level that we observe in imageiis given byg′
iv = giv +nwherenis a normally distributed random variable with characteristic
width σi. We can compute the expected accuracy on the calculation of pcv using these numbers; assuming that
the mean grey level values are much more accurate than individual pixel measurements, it is possible to estimate the expected accuracy of per pixel partial volume measurement.
δcv =
As the noise process in each voxel is independent of all others, the expected accuracy of the estimatesPtfor tissue
tare given by ∆t = δt/ √
V Thus the accuracy of proportion of tissue measurement increases as the square root of the measured volume. We are now in a position to evaluate the choice of image sequences in the standard Rusinek method. Assuming that the second image has been selected in order to give the best contrast between the three tissues, the question is: will the choice of a second image withGw = Gg = 0 give the best statistical accuracy
on the final estimates of tissue proportion? What is clear from the expressions forδct(and also the others) is that
the best noise performance will be obtained when the numerator is as large as possible, while this choice of grey levels reduces the negative term to zero we can actually go further than this by inverting the order ofGw andGg.
Thus, the freedom to solve these equations without having to make the standard assumption gives us the potential of greater statistical accuracy. Although it is a difficult process to optimise this expression, to get the best possible accuracy from a physically valid pair of NMR images, we can show that the standard selection is not the best choice simply by finding an alternative pair of sequences for which the statistical accuracy of the technique would be greater.
are commonly available in a clinical environment. The estimated grey level value for the three tissues, together with an estimate of the rms noise in these MRI image sequences, are given in Table 1. The calculated grey and white matter pixel accuracies (δg and δw) are given in the following table; the upper diagonal is for grey matter
and the lower diagonal is for white matter.
Sequence IRSE (R1) IRSE (R2) IRTSE VE (PD) VE (T2) FLAIR CSF
IRSE (R1) - 0.26 0.26 0.33 - 0.14 0.34
As can be seen, several combinations of images are predicted to be theoretically superior to the original pair. Best results are obtained when one of the combination is the FLAIR image sequence, due to the inversion of tissue grey level order. Though in practice this sequence may cause a problem due to flow artifacts, the next best alternative is the one we have called CSF. The grey matter volume, which is particularly important in monitoring development of degenerative diseases, can be a factor of 2.5 more accurate with some pairings of sequences. Interestingly, the standard variable echo pair would also seem to give quite a reasonable segmentation, even though these images have not been specifically designed for use in this way.
Results
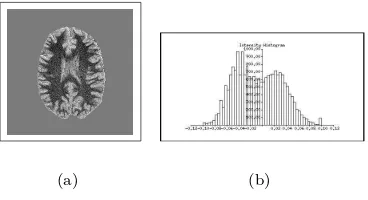
We have tested the new pixel level classifiaction algorithm on scans from a normal subject. Firstly, we obtained data according to the original published technique 1(a) 1(b). Nominal tissue values were obtained by curve fitting the histogram of pixel intensities with a function composed of three Gaussian peaks with flat between peak components to account for partial volume effects. The image data was then processed using the new equations. We obtained pixel level probability images for grey matter and white matter 1(c) 1(d) masked in the area of the brain1
. The full solution for the set of equations now allows us to visualise the effects of improved accuracy and reduction of bias (typically 4 %) in a pixel level segmentation. We recreated the effect of assuming equal grey levels for grey matter and white matter in the original solution by setting the assumed grey level values for these tissues equal to the average2
. Note the bias in the original solution 2(a) 2(b) which is bi-modal due to the systematic dependency on tissue type which has a typical value of 4 %.
The above analysis suggests that there are four pairs of images which are of interest. The turbo spin echo equivalent of the original Rusinek pair (IRSE (R1) and (R2) ), the pair with the best predicted accuracy (FLAIR and IRTSE), the next best combination excluding FLAR (IRTSE and CSF) and the variable echos (VE (PD) and VE(T2)). We analysed these images 1(e) and 1(f), 1(e) and 1(i), 1(l) and 1(m) computing once again the grey and white matter probability maps 1(g) 1(h) 1(j) 1(k) 1(n) 1(o) . These maps have statistical errors which are consistent with our predicted values. The improvement in stability of probability estimation from the new sequences is plainly visible. A subtraction of corresponding probability maps from these two data sets shows that these estimates are consistent except for the improvement in statistical noise.
Discussion and Conclusions
The results and analysis presented here have concentrated mainly on the effects of bias and statistical error. One such effect is now visible in the probability map for white matter. There are some areas of white matter which have a systematically lower probability than others. Although these effects are also present in the solution from the first pair of images, it only becomes clearly visible once the noise level has been reduced. Such problems were discussed in the original work; however, in most situations, systematic effects do not hinder the effect of quantifying change. We have generalised a recent technique for estimating tissue proportions from NMR image sequences. The new technique is more powerful as it can be applied to any combination of NMR image pairs. Also this technique can be made more accurate than the original solution by careful selection of image sequences, using the freedom that this new solution provides. A pair of sequences has been found which gives a potential improvement of a factor of
1The calclation for tissue types other than the three modelled is undefined
2.5 in accuracy of tissue volume measurement over the original technique. This has been illustrated graphically by a pixel level segmentation which is also made possible by the new approach. We believe that this work illustrates the importance of being able to select imaging protocols according to the requirements of processing algorithms. Though the image sequences we suggest are significantly better than those in the original publication we do not suggest that this is an optimal combination. However, the analysis technique outlined in this paper provides a framework for the comparison of other possible alternatives and shows that there is potentially much to be gained both in terms of accuracy, speed and utility by having the extra flexibility delivered by the new solution.
(a) IRSE(R1) (b) IRSE(R2) (c) Grey matter (d) White
Mat-ter
(e) IRTSE (f) FLAIR
(g) Grey matter (h) White Mat-ter
(i) CSF (j) Grey matter (k) White
Mat-ter
(l) VE (PD)
(m) VE (T2) (n) Grey matter (o) White
Mat-ter
Figure 1: Image Sequences and Probability Maps
(a) (b)
References
1. Clarke, et. al. MRI: Stability of Three Supervised Segmentation Techniques. Mag. Res. Imag.11,1,pp 95-106, 1993.
2. Cohen,et.al., Segmentation Techniques for the Classification of Brain Tissue Using MR Images. Psych. Res.,45,1, pp 33-51.
3. H.Rusinek, et. al. Alzheimer’s Disease: measuring loss of cerebral grey matter with MR imaging. Radiology, 178(1), pp 109-14, 1991.
4. Vaidyanathan, et. al., Normal Brain Volume Measurements using Multispectral MRI Segmentation. Mag. Res. Imag., 15, 87-97, 1997.