DOI 10.1007/s11235-008-9129-6
Multimodal, multicommodity international freight simultaneous
transportation network equilibrium model
Mohamad K. Hasan
Published online: 8 October 2008
© Springer Science+Business Media, LLC 2008
Abstract An implementation of the International Freight Simultaneous Transportation Equilibrium Model (IFSTEM) that developed in United Nations Economic and Social Commission for Western Asia (ESCWA), to the goods trade through the ports and lands of Jordon, Syria, and Lebanon is presented. Although some socio-economic variables, which are not available, were required for IFSTEM model calibra-tion, some reasonable assumptions were made and it was good enough to draw the following main findings: the IF-STEM model was able to replicate the observed path and O-D pair goods flows for year 2001 through its initial so-lution; the IFSTEM final solution suggested that the path distribution for most observed O-D pairs flows is not op-timal due to the exporters depend only one some measure of attractiveness in their path choice and it should be redis-tributed to have a great saving in the total freight cost; the IFSTEM can be consider as a good decision support tool that is able to evaluate the value of any scenario that can be reflected through any change in the costs and/or times of its link cost function or any change in the socio-economic variables, as the case of year 2007 prediction.
Keywords International multimodal multicommodity network·Simultaneous transportation network equilibrium model·Integrated transport network·Integrated transport system·Globalization and regional integration·
International freight transport·Exporters·Importers
M.K. Hasan (
)
Department of Quantitative Methods and Information Systems, College of Business Administration, Kuwait University, P.O. Box 5486, Safat 13055, Kuwait
e-mail:[email protected]
Introduction
The United Nations Economic and Social Commission for Western Asia (ESCWA) is one of five UN regional eco-nomic commissions in the world that was established in 1973. While other regional commissions cover entire con-tinents, ESCWA is made up of only 13 member countries, namely: Bahrain, Egypt, Iraq, Jordan, Kuwait, Lebanon, Oman, Palestine, Qatar, Saudi Arabia, Syria, United Arab Emirates and Yemen.
40 M.K. Hasan complexity of border procedures and formalities and the
im-position of high tariffs between ESCWA member countries [4]. The same trends continue to prevail until the present time.
The ESCWA secretariat recognizes the important role transport plays in supporting sustainable development processes. The integration of transport networks, the eas-ing of border procedures and formalities, and the reduction or elimination of tariffs are vital to facilitating the move-ment of goods and passengers within and between ESCWA member countries and between those countries and the rest of the world. Effective transport connections can serve mar-kets and communities and create or strengthen links between centers of production and consumption. In addition, facili-tating regional and international transport flows through the member States is likely to contribute significantly to improv-ing the international trade competitiveness of local industrial and agricultural products and services.
In the present context of increasing globalization, the ES-CWA secretariat is playing a key role in promoting an in-tegrated transportation system linking all the countries of the region, Bahrain, Egypt, Iraq, Jordan, Kuwait, Lebanon, Oman, Palestine, Qatar, Saudi Arabia, Syria, United Arab Emirates and Yemen. The system is designed not only to facilitate intraregional trade and promote greater eco-nomic integration, but also to connect the ESCWA members with neighboring countries and regions and further integrate Western Asia into the global economy. This is an essential component of efforts to achieve sustainable socio-economic development and prosperity in an era characterized by inter-connectedness.
During the twentieth session of ESCWA, held at United Nations House in Beirut on 27 and 28 May 1999, the Com-mission, in its resolution 221 (XX) of 27 May 1999, took note of the contents of the summary reports submitted by the subsidiary bodies of ESCWA to that session, including, by implication, the statement on the adoption and development of an Integrated Transport System in the Arab Mashreq (IT-SAM). Conceptually, the contribution of the ESCWA secre-tariat to the development of ITSAM comprises the following three basic components:
1. ITSAM-NETWORK, an integrated transport network; 2. ITSAM-INFOSYS, an associated information system; 3. ITSAM-FRAMEWORK, a methodological framework
for issue analysis and policy formulation.
The above-mentioned statement included a declaration by member States regarding the development of ITSAM and the adoption of an integrated transport network for that system in the region. The first edition of the ITSAM-NETWORK map, incorporating the statement in its entirety, was officially approved and presented at the Commission’s twentieth session and was published in June 1999.
With regard to ITSAM-INFOSYS, the second major component, several schemes at various stages of maturity have been proposed by regional institutions, and prospects for their implementation will be determined. A working pa-per by Farahat [10] provides details on the purpose, scope and structure of this information system.
A comprehensive methodological framework was re-quired in order to develop the integrated transport system in the region and achieve specific goals in line with a com-prehensive and integrated analytical method that can be ap-plied in a systematic and sustained manner. As part of its program of work for the biennium 2000–2001, the Trans-port Section of Globalization and Regional Integration Divi-sion has therefore begun preparation of that methodological framework, in two volumes. Volume I [5] is entitled Gen-eral Outline and Main Featuresand volume II [6] is enti-tled A Policy-sensitive Model for Predicting International Freight Flows (Trade).Volume I draw a broad outline of the proposed methodological framework and review the main hypotheses, variables, relationships and groups used in the analysis, together with the options, anticipated effects and prediction process. It also deals in some detail with the main features of the proposed methodological framework and de-velopment priorities.
Volume II reviews a mathematical model for predict-ing international freight flows (trade) in the Arab Mashreq. The review describes the basic hypothesis of the model, the method used to represent the integrated transport network in order to apply that model; and the results obtained, using an example that demonstrates the capacity of the model to pre-dict freight flows over the network and analyze policies and options for improving performance levels and increasing de-mand for international freight transport.
Volume I was prepared by Dr. Nabil Safwat, Chief of the ESCWA Transport Section and immediate supervisor of the study. Dr. Safwat was also involved in the preparation of Volume II, together with Dr. Mohamad K. Hasan, First Economic Affairs Officer in the Section from March to July 2000.
To increase the economic integration between some ES-CWA countries, the ministers of Transport in Jordon, Syria, and Lebanon requested from ESCWA to prepare a study about the economic feasibility to facilitate the trade of goods through the ports and land of the three countries. A team to facilitate transport and trade from the Transport Section of Globalization and Regional Integration Division under the supervision of Dr. Nabil Safwat, Chief of the ESCWA Trans-port Section prepared the following three studies:
1. An Economic Feasibility Study to Facilitate Goods Trade through the Ports and Lands of Jordon, Syria, and Lebanon [5].
Sit-uation for Good Trade through the Ports and Lands of Jordon, Syria, and Lebanon [6].
3. Methodological Framework for The Integrated Transport System In The Arab Mashreq (Volume III): Methodol-ogy For Future Prediction And Economic Evaluation of Different Scenarios of Goods Trade facilitation through the Ports and Lands of Jordon, Syria, and Lebanon [9].
In ESCWA, [9] study, the authors sequentially used only the trip generation and the trip distribution models of the International Freight Simultaneous Transportation Equilib-rium Model (IFSTEM) that was developed in ESCWA, [6] (see also [22]) in their prediction methodology.
The prediction of multi-commodity freight flows on a multimodal network has attracted substantial interest in re-cent years. The prediction of passenger flows on multimodal urban transportation networks has been studied extensively, and many of the research results have been applied at the practical level [3,13–21,23]. Boyce [1] gives very good re-views and prospects for network equilibrium models. Boyce [2] gives a good view for future research on urban trans-portation network modeling. However, the study of freight flows at the national, regional and international levels, per-haps owing to inherent difficulties and complexities, has received less attention. A good review of freight transport modelling may be found in [11]. Ham et al. [12] develop an interregional commodity flow model, incorporating input– output relationships, and integrated with a transportation network model. The model was implemented for the US highway and railway networks to forecast flows of 11 com-modity sectors. The model was solved using a partial lin-earization algorithm, and provided estimates of intraregional and interregional flows and link flows by mode for each sec-tor.
In this research a fully implementation of the IFSTEM methodology, as it is described in [6] and [22], to the goods trade through the ports and lands of Jordon, Syria, and Lebanon are carried out. The analysis and the demonstration of the IFSTEM ability to simulate the existing situation and future prediction of goods flows are presented. The model capability to evaluate different scenarios that will facilitate goods grade through the ports and lands of Jordon, Syria, and Lebanon are also presented.
1 The existing goods flows system through the ports and lands of Jordon, Syria, and Lebanon
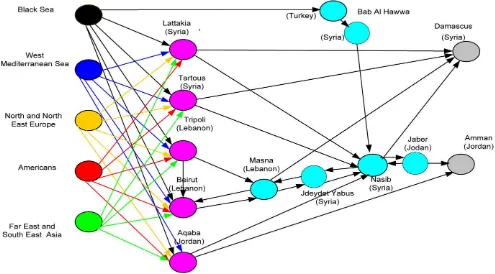
According to the Information of the Existing Situation for Good Trade through the Ports and Lands of Jordon, Syria, and Lebanon study [8], the existing goods flows network, as shown in Fig.1, consists of six origin-destination (O-D) pairs. Each O-D has its own paths as shown in theAppendix TableA.1. For each path, there are specifications for:
1. Loading ports represent the origin of the goods
2. Unloading port represents the first entry point for the good to any of the three counties
3. Shipment type represents the procedure type that will be required at the unloading port
4. Countries pass through represents the countries that the good will be transported by land through it to reach its destination
5. Borders points that goods pass through it during its land transport route to reach its destination
6. Observed goods flows in tons for year 2001.
TableA.2shows the legal cost for each path that consists of the following:
1. Maritime transport cost from the loading port to the un-loading port
2. Total costs inside the unloading port that consist of port service costs and maritime dealer costs
3. Land transport cost from the unloading port to the desti-nation
4. Border producers and fees costs at each land border point.
TableA.3shows the time taken to deliver the goods from the origin to the destination for each path and it includes:
1. Maritime transport time from the loading port to the un-loading port
2. Total procedures times inside the unloading port to re-lease goods
3. Land transport time from the unloading port to the desti-nation
4. Total border producers time at each land border point to release goods.
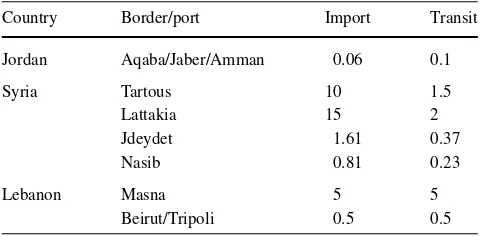
TableA.4shows the illegal costs for the three countries in the unloading ports and land border points in case of im-port or transit goods. These costs represent how much the goods owner or the shipping dealers pay to the employees in different authorities in terms of money or gifts to facilitate the good release procedures.
2 IFSTEM model description
42 M.K. Hasan
Fig. 1 Original network for goods flows through the ports and lands of Jordon, Syria, and Lebanon
For each commodityr∈C,
Sir=max
0,ln j∈Dri
exp(−θirurij+Arj)
∀i∈Ir
Gri =αrSir+Eri ∀i∈Ir
Trij= ⎧ ⎨
⎩
Gri exp(−θ
r iurij+Arj)
k∈Driexp(−θirurik+Ark) if
imc≥0,
0 otherwise
∀ij∈Rr
Crp =u
r
ij ifHpr>0,
≥urij ifHpr=0 ∀p∈P m(r) ij , ij∈R
r
where
(N, A)=A multimodal multi-commodities network consisting of a set ofN nodes and a set ofA
links andN=
r∈CNr andA=
r∈CAr
C=Set of all commodity types
M=Set of all mode types,M=
r∈Cm(r)
O=Set of all Administrative and Logistical Operations ALO types,O=
r∈Co(r)
m(r)=a set of mode types possible for commodity typer(combinations of road, rail, air and/or maritime modes)
o(r)=a set of ALO types for commodity type
r(combinations of export, import, transit-in, transit-out, pre-export, pre-import and/or
transfer operations)
I=Set of origin (export) nodesI=
r∈CIr andNr⊇Ir
Ir=Set of origin (export) nodes for commodityr i=An origin (export) node in the setIr
Dri =Set of destination (import) nodes that are feasible for importing commodityrfrom origini
j=A destination (import) node in the setDri
Rr=Set of origin-destination pairs (ij )for commodityr R=Set of all origin-destination pairs (ij )in the system,
whereR= r∈CRr
p=A simple (i.e., no node repeated) multimodal path (i.e., it may include a combination of links with different modesm(r))for commodityr
in the network(Nr, Ar)
Pijm(r)=Set of simple paths that can be used to transport commodityrfrom originito destinationj using onlym(r)modes of transport
Pr =Set of simple paths in the network(Nr, Ar), i.e.,(Pr =
ij∈RrPijm(r))
a=A link in the setA. Each link is identified by (k, l, q), i.e., the link connects nodekto nodelby
mode/operationq
Sir=the accessibility of the exporter of commodityr
at origini
Gri =the number of tons of commodityrexported from origini
Hpr=the flow of commodityron multimodal pathp Eir=a composite measure of the effect the socio-economic
variables, which are exogenous to the transport system, have on the number of tons of commodity
rexported from origini
Elir =the value of thelth socio-economic variable that influences the number of tons of commodityr
exported from origini
ql(Erli)=a given function specifying how thelth socio-economic variable,Elir, influences the number of tons of commodity
rexported from origini
Arj=a composite measure of the effect that
socio-economic variables exogenous to the transport system have on the number of tons of commodity
rimported at destinationj Arj=W
w=1θiwr gw(A r wj)
Arwj =the value of thewth socio-economic variable that influences the number of tons of commodity
rimported at destinationj
gw(Arwj)=a given function specifying how thewth socio-economic variableArwj influences the number of tons of commodityrimported at destinationj
Crp=the total perceived delivery cost for commodity
rtransported from export origin nodeito import destination nodejon any multimodal pathp∈Pijm(r)
The quantitiesαr andαlr forl=1,2, . . . , Land the quanti-tiesθir (θir>0)andθiwr forw=1,2, . . . , Ware coefficients to be estimated.
The model decision variables for commodity r∈C are
Sir, Tijr andHpr, which are interrelated through the minimum delivery cost urij. These interrelationships allow a simulta-neous prediction of trip generation, trip distribution, modal choice and trip assignment.
3 IFSTEM modelling procedures and assumptions for goods flows system through the ports and lands of Jordon, Syria, and Lebanon
3.1 IFSTEM network representation
To adapt the goods flows network of Fig. 1 for IFSTEM methodology we modified this network as shown in Fig.2 where we considered the following:
1. Each destination node connected to a number of dummy destinations; depend on the maximum number of paths that reach this destination, through dummy links with link cost equal to zero on all of them.
2. Each origin node connected to the same number of dummy destinations as its corresponding destination
through dummy links with link cost equal to very big value.
For example, Amman destination (node number 500) is connected to six dummy destinations nodes number 501, 502, 503, 504, 505, and 506 with six dummy links. And the origin Black Sea (node number 810) is connected to the same destinations 501, 502, 503, 504, 505, and 506 with six dummy links. The links cost of any of the links 500→501, 500→502, 500→503, 500→504, 500→ 505, 500→506 is equal to zero, and the link cost of any of the links 810→501, 810→502, 810→503, 810→504, 810→505, 810→506 is equal to 999999999.
By this network presentation each original path for any original O-D can be consider as a new origin-destination pair that has exactly two paths, the first one from the orig-inal origin to the dummy destination and the second one is from the original origin to the same dummy destination. For example, the original path 1 of the original O-D 1, 810-500, that represented by the sequence
• 810→421→413→511→500 will be the new O-D 810-501 that has exactly two paths,
• 810→421→413→ 511→500→501 and 810→ 501.
Considering the network representation in Fig.2as the basic network and using the same concepts of network rep-resentation of ESCWA, 2000b study, we were able to create a multimodal network (sea and road) for each new O-D pair (original path) that include four Administrative and Logis-tics Operations (ALO) (export, import, transit in, and transit out). There is no interaction between any O-D pairs, that is, the goods are forced to move through its own O-D network only which represent the physical movements of goods.
3.2 Demand models assumptions
We assumed that only one general commodity is transported from the origins to destinations of the network in Fig.2.
Recalling the IFSTEM description in Sect. 2, we have two demand models, trip generation and trip distribution. To have a real calibration for these models, we should havel
socio-economic variablesEli, for each exporter, that influ-ences the number of tons of the general goods that exported from that origin, i.e., at each of the following origins: Black Sea (node 810), West Mediterranean Sea (node 710), North and North East Europe (node 910), North and South Amer-ica (node 310), Far East and South East Asia (node 210). These socio-economic variables were not available and we assumed the following to compute the exogenous variables
Eifor each originifrom the equation
Ei= L
l=1
44
M.K.
Hasan
1. l=1
2. E1i=Goi (observed trip generation at origini) 3. α1=.60 for all origins.
Hence
Eio=0.60Goi ∀i∈I
That is the observed composite measure of the effect of the socio-economic variables, which are exogenous to the trans-port system, is counted for 60% of the number of tons of the general goods that exported from that origin. Also, thew ex-ogenous socio-economic variables Awj that influences the number of tons of the general goods imported at each desti-nationj, Amman, Damascus, and Beirut, were not available to compute
Aj= W
w=1
θiwgw(Awj)
We assumed that
Aij=lnTijo ∀ij∈R
the a proxy measure of Aj as a composite measure of the effect that socio-economic variables exogenous to the trans-port system have on the number of tons of the general goods imported at each destinationj that is exported from the ori-ginionly. By this assumption each destination has deferent attractive with respect different origins. We assume that this attractive composite measure is the dominate of the exporter observed utility function
Vij= −θiuij+Aij
That is, as the observed path flow shown in the next analysis, the exporter at originiis concern only by this at-tractive measure and he didn’t consider the delivery costuij to be effective in his choice of the destination (the path in the original network). This will be similar to the IFSTEM initial solution as we will explain next.
Therefore, the accessibility measure for this behavior will be
Sio=ln j∈Di
exp(−θiuij+Aij) ∀i∈I
Sio=ln j∈Di
exp(ln(Tijo)) ∀i∈I
Sio=lnGoi ∀i∈I
and the trip generation model will be
Goi =αiSio+Ei0 ∀i∈I
Goi =αiLn(Goi)+0.60G0i ∀i∈I
Now we can estimateαi ∀i∈I from the observed trip gen-eration as follows:
αi= 0.4Goi
Ln(Goi) ∀i∈I
We estimateθi =θ=0.0000005 for all origins by the fol-lowing method:
We run the computer code that solve IFSTEM model for different values forθ till we got this value(θ=.0000005)
that satisfied the condition
i∈IGoi
i∈IG p i
≈1.40
whereGpi is the predicted trip generation for origini for year 2001. This value ofθ will keep the affect of system performance (supply), as measure by the delivery costuij, on the predicted trip generated from origin to be 40% in av-erage less than the observed trip generation.
This 40% decrease is what we gain when we assumed before thatuij=0 to represent the observed trip generation behavior of exporters as an initial solution to IFSTEM.
3.3 Link cost functions assumptions
As described in the network representation in Fig. 2 and using the network representation of ESCWA, [6] study, we have the following kinds of links:
1. Modal links include:
• Maritime links from any of Black Sea, West Mediter-ranean Sea, North and North East Europe, North and South America, or Far East and South East Asia ori-gins to any of Lattakia, Tartous, Tripoli, Beirut, or Aqaba ports.
• Land transport links from Lattakia, Tartous, Tripoli, Beirut, or Aqaba ports direct or through Nasib–Jaber, or Masna-Jdeydet border points to Amman, Damas-cus, or Beirut destinations.
• Land transport links from Black Sea origin to Bab Al Hawwa at Turkey-Syria border and from Bab Al Hawwa to Nasib–Jaber border point and then from Nasib–Jaber to Amman destination.
2. Operations links include:
• Import or transit-in artificial links at Lattakia, Tartous, Tripoli, Beirut, and Aqaba ports.
• Export artificial link at Bab Al Hawwa border point from Turkey side and transit-in artificial link at Bab Al Hawwa border point from Syria side.
• Import, transit-in, or transit-out artificial links at Na-sib, Jaber, Masna, and Jdeydet border points.
46 M.K. Hasan • Pre-import artificial links at the dummy destinations
401, 402, 403, 404, 405, 501, 502, 503, 504, 505, 506, 601, 602, and 603.
3. Modal Transfer include:
• Artificial links at Lattakia, Tartous, Tripoli, Beirut, and Aqaba ports to transfer between maritime transport mode and land transport mode.
The following link cost function was used:
C(x)=(lc+ic)x+vt x
where
x=number of tons of general goods
C(x)=Cost ofxtons of general goods in US dollar
lc=legal transport or operation cost per ton in US dollar
ic=illegal transport or operation cost per ton in US dollar
i=transportation or operation time in days
v=3.7, the value of time per ton per day as estimated in ESCWA, [7] study.
The valueslc, ic, andifor each import, export, transit-in, and transit-out operational link and maritime transport were obtained from TablesA.2–A.4.
The cost function for any of pre-export, per-import, and transfer link was set to zero since there no data for them.
In TablesA.2–A.4, the land transport time are at the paths level in the original network. The following procedure was used to compute these values at the link level:
The distance of land transport for each path and all its links were computed, then the land transport timeifor each link was computed as follows:
i= link distance
path distance ×path land transport time
Using the above assumptions for different link type, dif-ferent networks one for each origin-destination are built with no interaction between any of them. In this way each link could belongs to different origin-destination network with different characteristics.
4 IFSTEM future prediction analysis for goods flows through the ports and lands of Jordon, Syria, and Lebanon
Based on the assumptions described in Sect.3, the computer code that solve the IFSTEM model is modified and run for ten iterations to obtain the output shown in Tables1–5. The path flows for the original network presented in Fig.1 are corresponding to the O-D flowsTij for the network in Fig.2 while the O-D flows in these tables are corresponding to trip generationGi for the network in Fig.2.
4.1 The output prediction results for year 2001
Tables1–3show the output results for this application for year 2001 for two types of results:
Results for legal and illegal costs These results considered both, legal transport or operation cost per ton,lcand illegal transport or operation cost per tonic for each link in each path for a given origin-destination pair.
Based on the IFSTEM demand models assumption that described in Sect.3.2, the initial paths flow solution results, perfectly; replicate the observed path flows in last column of Table A1 that represent the real exporters’ behavior. Recall that in this observed or initial solution we assumed that the exporters consider only the attractiveness (uij=0)of paths (destinations in the network in Fig.2) Aij as measure of observed utilityVij to distribute their goods through these paths. But they should in addition take into account the de-livery costuij in their observed utility as
Vij= −θiuij+Aij
to distribute their goods through the different paths of the given O-D pair.
To evaluate the results of the final solution, the results are compared with its corresponding observed values to give the following findings:
The O-D flows (the trip generation for IFSTEM) de-creases from 984492.00 to 752001.06 for O-D 1, from 660405.00 to 507237.61 for O-D 2, from 422467.00 to 320847.82 for O-D 3, from 1443743.00 to 945609.10 for O-D 4, from 805484.00 to 522465.15 for O-D 5, and from 525185.00 to 344711.23 for O-D 6 and
i∈IGoi
i∈IG p i
= 984492+660405+422467+1443743+805484+525185 752001.06+507237.61+320847.82+945609.1+522465.15+344711.23
=4841776.00
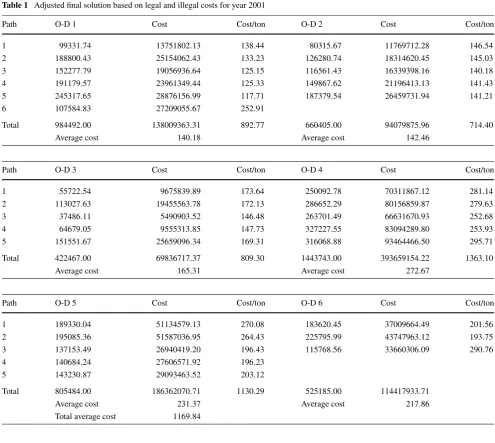
Table 1 Adjusted final solution based on legal and illegal costs for year 2001
Path O-D 1 Cost Cost/ton O-D 2 Cost Cost/ton
1 99331.74 13751802.13 138.44 80315.67 11769712.28 146.54
2 188800.43 25154062.43 133.23 126280.74 18314620.45 145.03
3 152277.79 19056936.64 125.15 116561.43 16339398.16 140.18
4 191179.57 23961349.44 125.33 149867.62 21196413.13 141.43
5 245317.65 28876156.99 117.71 187379.54 26459731.94 141.21
6 107584.83 27209055.67 252.91
Total 984492.00 138009363.31 892.77 660405.00 94079875.96 714.40
Average cost 140.18 Average cost 142.46
Path O-D 3 Cost Cost/ton O-D 4 Cost Cost/ton
1 55722.54 9675839.89 173.64 250092.78 70311867.12 281.14
2 113027.63 19455563.78 172.13 286652.29 80156859.87 279.63
3 37486.11 5490903.52 146.48 263701.49 66631670.93 252.68
4 64679.05 9555313.85 147.73 327227.55 83094289.80 253.93
5 151551.67 25659096.34 169.31 316068.88 93464466.50 295.71
Total 422467.00 69836717.37 809.30 1443743.00 393659154.22 1363.10
Average cost 165.31 Average cost 272.67
Path O-D 5 Cost Cost/ton O-D 6 Cost Cost/ton
1 189330.04 51134579.13 270.08 183620.45 37009664.49 201.56
2 195085.36 51587036.95 264.43 225795.99 43747963.12 193.75
3 137153.49 26940419.20 196.43 115768.56 33660306.09 290.76
4 140684.24 27606571.92 196.23
5 143230.87 29093463.52 203.12
Total 805484.00 186362070.71 1130.29 525185.00 114417933.71
Average cost 231.37 Average cost 217.86
Total average cost 1169.84
Table 2 Comparison between observed and adjusted IFSTEM final solution based on legal and illegal costs for year 2001
O-D Observed average Predicted average Observed Saving in the total cost cost per ton cost per ton O-D flows
1 139.7304751 140.1833263 984492 −445,828.44
2 141.3222818 142.4578493 660405 −749,934.47
3 169.4769156 165.3069172 422467 1,761,686.74
4 295.5521543 272.6656713 1443743 33,042,199.65
5 266.8040219 231.3665706 805484 28,544,300.02
6 195.6931669 217.8621509 525185 −11,642,817.83
Total 1208.579016 1169.842485 4841776 50,509,605.67
as mentioned in Sect.3for the choice of θ=.0000005 to satisfy the above equation. These decreases in the trip gen-erations for all origins support the IFSTEM model concepts that state: if the observed utilityVij decreases, the number of trip generation will decrease.
The above finding doesn’t mean that only the predicted
trip generation should be distributed, but we can keep the
relative paths distribution and distribute all observed trip
48 M.K. Hasan Table 3 Comparison between
observed and IFSTEM final solution based on legal costs only for year 2001
O-D Observed average Predicted average Observed Saving in the total cost cost per ton cost per ton O-D flows
1 139.0997441 138.5581836 984492 533,161.92
2 141.0280027 140.9379905 660405 59,444.47
3 169.261728 163.8659082 422467 2,279,555.82
4 295.4742529 270.6974938 1443743 35,771,272.61
5 254.6557169 224.6689715 805484 24,153,843.65
6 195.0256607 215.3559631 525185 −10,677,169.88
Total 1194.545105 1154.084511 4841776 52,120,108.58
Table 4 Comparison between IFSTEM final solution based on legal and illegal cost and IFSTEM final solution based on legal costs only for year 2001
O-D Predicted average Predicted flows Predicted average Predicted flows Observed O-D Saving in cost per ton bases bases on legal cost per ton bases bases on legal flows the total cost on legal and illegal and illegal costs on legal costs only costs only
costs
1 140.1833263 752001.06 138.5581836 753489.02 984492 1,599,939.99
2 142.4578493 507237.61 140.9379905 508223.26 660405 1,003,722.33
3 165.3069172 320847.82 163.8659082 321361.64 422467 608,778.73
4 272.6656713 945609.1 270.6974938 945895.2 1443743 2,841,542.49
5 231.3665706 522465.15 224.6689715 523458.71 805484 5,394,808.89
6 217.8621509 344711.23 215.3559631 345608.54 525185 1,316,212.21
Total 1169.842485 3392871.97 1154.084511 3398036.37 4841776 12,765,004.64
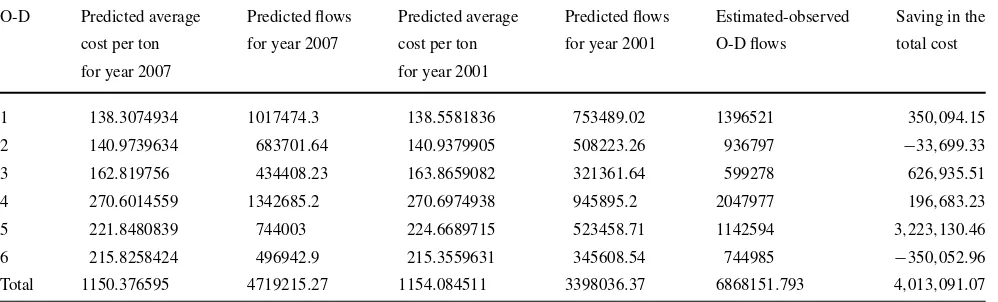
Table 5 Comparison between IFSTEM final solution based on legal costs only for year 2001 and IFSTEM final solution based on legal costs only for year 2007
O-D Predicted average Predicted flows Predicted average Predicted flows Estimated-observed Saving in the cost per ton for year 2007 cost per ton for year 2001 O-D flows total cost
for year 2007 for year 2001
1 138.3074934 1017474.3 138.5581836 753489.02 1396521 350,094.15
2 140.9739634 683701.64 140.9379905 508223.26 936797 −33,699.33
3 162.819756 434408.23 163.8659082 321361.64 599278 626,935.51
4 270.6014559 1342685.2 270.6974938 945895.2 2047977 196,683.23
5 221.8480839 744003 224.6689715 523458.71 1142594 3,223,130.46
6 215.8258424 496942.9 215.3559631 345608.54 744985 −350,052.96
Total 1150.376595 4719215.27 1154.084511 3398036.37 6868151.793 4,013,091.07
Adjusted predicted path flow
=predicted path flow
predicted O-D flow×observed O-D flows
Table1 shows the results of the adjusted final solution based on legal and illegal costs for year 2001 for different paths for the six O-D pairs where the path cost per ton is
The increase or decrease in the total cost is computed as follows:
Increase/Decrease in Total cost
=(observed average cost per ton −predicted average cost per ton) ×observed O-D flows
Table2shows a comparison between observed (or initial) and adjusted IFSTEM final solution. It also shows that the overall saving for all O-D pairs is $50,509,605.67 and sug-gested that the path distribution of O-D 3, O-D 4, and O-D 5 should be redistributed as the IFSTEM model suggested.
Results for legal costs only To evaluate the effect of the scenario of canceling all the illegal costs, the illegal cost termicwas deleted from the link cost function and we run the modified computer code for IFSTEM model for the same 10 iterations. Tables3show the results of this scenario for observed (or initial) and final solutions where all O-D pairs average cost per ton were decreased except O-D 6. It may need to consider O-D 6’s observed path distribution due to the special factor that Beirut is a port and the destination for this O-D pair and it is preferable to export most of Lebanon goods from Far East and South East Asia direct to Beirut. The results show an overall saving of $52,120,108.58. The improvement in the average cost per ton of O-D 1 and O-D 2 is due to that the illegal costs had significance effect on these O-D pairs.
Table4show a comparison between IFSTEM final tion based on legal and illegal Cost and IFSTEM final solu-tion based on legal costs only for year 2001. These results show that canceling the illegal cost will results an overall saving of $12,765,004.64 for all O-D pairs and the total pre-dicted O-D pairs flows increased from 3392871.97 tons to 3398036.37 tons, i.e., an increase of 5164.4 tons in the total predicted flows which is equivalent to
4841776
3398036.37×5164.4=7358.62 tons
These results are very encourage and support for the sce-nario of canceling the illegal costs that result in increasing more goods to be imported to Jordon, Syria and Lebanon with less overall costs and it demonstrate the ability of IF-STEM model as a policy-sensitive model in predicting in-ternational freight flows under different scenarios.
Different others scenario or combination of scenarios can be evaluated by the IFSTEM model if any of these scenarios can be reflected by increase or decrease in the cost or the time on any modal or operational links. For example, we can evaluate the effect of the scenario of reducing the number of procedures and signatures by 50% if we know how much it
cost and how long it take each procedure and each signature and we add this term in the link cost function. Then running the IFSTEM model before and after the reduction will help in evaluating this scenario.
4.2 The output prediction results for year 2007
After we tested and validated IFSTEM model using the base year 2001 data, we assumed that there will be 6% an-nual growth in the socio-economic activities. The estimated-observed O-D pair flows for year 2007 are computed as fol-lows:
Estimated-Observed O-D pair flows for year 2007
=(Observed O-D pair flows for year 2001)×(1.06)6
For IFSTEM model application, the growth is reflected through new values for the socio-economic variablesEiand
Aij as follows:
for year 2007=(for year 2001)×(1.06)6
for year 2007=(for year 2001)×(1.06)6
We assumed also the modal and operational link costs and times will be the same as those of year 2001. The results for year 2007 have the same pattern as those of year 2001. Table5show a comparison between IFSTEM final solution based on legal costs only for year 2001 and IFSTEM final solution based on legal costs only for year 2007. The re-sults shows that all O-D flows are increased with total in-creases of about 39% and the overall saving in the cost is $4,013,091.07 based on the Estimated-Observed O-D pair flows for year 2007 (that we can adjusted the IFSTEM pre-dicted O-D pair flows to its value as explained earlier).
The assumption that the modal and operational link costs and times for year 2007 will be the same as those of year 2001 is due to there is no available projected data for these costs and times. The modal and/or the operational link costs may increase or decrease due to the shippers competitive-ness, improve in the transport technology, improvement in the port or border points producers and regulations and use of information technology. But modal and operational link times may not increase due to these factors.
5 Conclusions and future activities
5.1 Conclusions
50 M.K. Hasan the goods trade through the ports and lands of Jordon,
Syria, and Lebanon. Although some socio-economic vari-ables, which are not available, were required for IFSTEM model calibration, some reasonable assumptions were made and it were good enough to draw the following main find-ings:
1. The IFSTEM model was able to replicate the observed path and O-D pair goods flows for year 2001 through its initial solution.
2. The IFSTEM final solution suggested that the path distri-bution for most observed O-D pairs flows is not optimal due to the exporters depend only one some measure of attractiveness in their path choice and it should be redis-tributed to save in the total cost.
3. The IFSTEM can be consider as a good decision support tool that is able to evaluate the value of any scenario that can be reflected through any change in the costs and/or times of its link cost function, as the case of canceling il-legal cost, or any change in the socio-economic variables, as the case of year 2007 prediction.
4. The three countries of Jordon, Syria, and Lebanon im-port only goods from countries outside the ESCWA re-gion which is not the main objective of the development of IFSTEM and ITSAM to increase the trade between ESCWA countries. It is also very difficult to collect the socio-economic data that required for IFSTEM method-ology for these outsider countries.
5.2 Future activities
A limitation of a full implementation of IFSTEM to all ES-CWA countries or a group of them is suggested and should include all of the following:
1. Data collection program to collect all the socio-economic data needed to perform a real calibration of the trip gen-eration and trip distribution models parameters.
2. Data collection program to collect data needed to per-form a real calibration of the link perper-formance (general-ized cost) function for different mode and different oper-ation.
3. Implement IFSTEM using the data collected in activities 1 and 2.
Integrating the above future activities with the following current activities:
1. The integration of IFSTEM with its Geographic Informa-tion System (GIS) database.
2. The development of a user-friendly interface to perform graphic policy scenario analyses on ITSAM using IF-STEM
multicommodity
international
freight
simultaneous
transportation
netw
ork
equilibrium
model
5
1
Appendix
Table A.1 Existing paths and origin-destination pairs system and its observed goods flows
Origin-Destination (O–D) Path Loading Unloading Shipment Countries Borders points that goods pass through it Observed ports port type pass through Entry Exit Entry Exit flows (tons)
O–D 1: 1 Odessa–Constantia Lattakia Transit Syria Nasib Jaber – – 758 From: Black Sea 2 Odessa–Constantia Tartous Transit Syria Nasib Jaber – – 116894 To: Amman (Jordan) 3 Odessa–Constantia Tripoli Transit Lebanon– Syria Masna Jdeydet Nasib Jaber 8988 4 Odessa–Constantia Beirut Transit Lebanon– Syria Masna Jdeydet Nasib Jaber 75546
5 Odessa–Constantia Aqaba Import – – – – – 640243
6 Odessa–Constantia By land Transit Turkey–Syria – Bab Al Hawwa Nasib Jaber 142063
O–D 2: 1 Barcelona–Valencia Lattakia Transit Syria Nasib Jaber – – 838 From: West Mediterranean Sea 2 Barcelona–Valencia Tartous Transit Syria Nasib Jaber – – 16737 To: Amman (Jordan) 3 Barcelona–Valencia Tripoli Transit Lebanon– Syria Masna Jdeydet Nasib Jaber 7192 4 Barcelona–Valencia Beirut Transit Lebanon–Syria Masna Jdeydet Nasib Jaber 60458 5 Barcelona–Valencia Aqaba Import – – – – – 575180
O–D 3: 1 Rotterdam–Hamburg–Entrup Lattakia Transit Syria Nasib Jaber – – 324 From: North and North East Europe 2 Rotterdam–Hamburg–Entrup Tartous Transit Syria Nasib Jaber – – 27700 To: Amman (Jordan) 3 Rotterdam–Hamburg–Entrup Tripoli Transit Lebanon–Syria Masna Jdeydet Nasib Jaber 43 4 Rotterdam–Hamburg–Entrup Beirut Transit Lebanon–Syria Masna Jdeydet Nasib Jaber 359 5 Rotterdam–Hamburg–Entrup Aqaba Import – – – – – 394041
O–D 4: 1 Baltimore–Houston–Santos Lattakia Transit Syria Nasib Jaber 1163 From: North and South America 2 Baltimore–Houston–Santos Tartous Transit Syria Nasib Jaber 8557 To: Amman (Jordan) 3 Baltimore–Houston–Santos Tripoli Transit Lebanon–Syria Masna Jdeydet Nasib Jaber 183 4 Baltimore–Houston–Santos Beirut Transit Lebanon–Syria Masna Jdeydet Nasib Jaber 1539 5 Baltimore–Houston–Santos Aqaba Import – – – – – 1432301
O–D 5: 1 Yokohama–Hong Kong Lattakia Import – – – – – 347330
From: Far East and South East Asia 2 Yokohama–Hong Kong Tartous Import – – – – – 457349 To: Damascus (Syria) 3 Yokohama–Hong Kong Tripoli Transit Lebanon Masna Jdeydet – – 185 4 Yokohama–Hong Kong Beirut Transit Lebanon Masna Jdeydet – – 235 5 Yokohama–Hong Kong Aqaba Transit Jordan Jaber Nasib – – 385
O–D 6: 1 Yokohama–Hong Kong Tripoli Import – – – – – 35178
52
M.K.
Hasan
Table A.2 Paths legal costs for each origin-destination
Origin-Destination (O-D) Path Unloading Shipment Maritime Total costs inside port Land transport Border producers and fees costs port type transport cost cost Lebanon Syria Jordan
O-D 1: 1 Lattakia Transit 17 29 3 16 8.43
From: Black Sea 2 Tartous Transit 17 29 3 15 8.43
To: Amman (Jordan) 3 Tripoli Transit 15 3 5 19 2.93 7.68
4 Beirut Transit 15 3 5 19 3.93 7.68
5 Aqaba Import 30 13.6 0.60 17.2
6 By land Transit 7.68
O-D 2: 1 Lattakia Transit 14 29 3 16 8.43
From: West Mediterranean Sea 2 Tartous Transit 14 29 3 15 8.43
To: Amman (Jordan) 3 Tripoli Transit 20 3 5 18 3.93 7.68
4 Beirut Transit 20 3 5 19 3.93 7.68
5 Aqaba Import 35 13.6 0.60 17.2
O-D 3: 1 Lattakia Transit 30 29 3 16 8.43
From: North and North East Europe 2 Tartous Transit 30 29 3 15 8.43 To: Amman (Jordan) 3 Tripoli Transit 30 3 5.50 18 3.93 7.68
4 Beirut Transit 30 3 5.50 19 3.93 7.68
5 Aqaba Import 52 13.6 0.80 17.2
O-D 4: 1 Lattakia Transit 45 29 3 16 8.43
From: North and South America 2 Tartous Transit 45 29 3 15 8.43 To: Amman (Jordan) 3 Tripoli Transit 40 3 5.50 18 3.93 7.68
4 Beirut Transit 40 3 5.50 19 3.93 7.68
5 Aqaba Import 60 13.6 0.80 17.2
O-D 5: 1 Lattakia Import 75 29 2.50 16 2.86
From: Far East and South East Asia 2 Tartous Import 75 29 2.50 16 2.86
To: Damascus (Syria) 3 Tripoli Transit 65 3 5 6 3.14 2.86
4 Beirut Transit 65 3 5 6 3.14 2.86
5 Aqaba Transit 55 13.60 0.80 25 2.86 8.78
O-D 6: 1 Tripoli Import 85 3 3.5 7.60
From: Far East and South East Asia 2 Beirut Import 85 3 3.5 3
multicommodity
international
freight
simultaneous
transportation
netw
ork
equilibrium
model
5
3
Table A.3 Paths transportation and port and border procedures times for each origin-destination
Origin-Destination (O-D) Path Unloading Maritime transport Total time Land transport Land border time
port time inside port time (hours) Exit Entry Exit Entry Exit Entry
O-D 1: 1 Lattakia 9 5 8.19 2 0.5
From: Black Sea 2 Tartous 8 5 7 2 0.5
To: Amman (Jordan) 3 Tripoli 7 2-3 4.67 0.5 2 0.5
4 Beirut 7 2-3 4.37 0.5 2 0.5
5 Aqaba 10 4-6 4.86
6 By land 8 72 0.5 0.5
O-D 2: 1 Lattakia 12 5 8.19 2 0.5
From: West Mediterranean Sea 2 Tartous 12 5 7 2 0.5
To: Amman (Jordan) 3 Tripoli 10 2-3 5.67 0.5 2 0.5
4 Beirut 10 2-3 4.37 0.5 2 0.5
5 Aqaba 15 4-6 4.86
O-D 3: 1 Lattakia 15 5 8.19 2 5
From: North and North East Europe 2 Tartous 15 5 7 2 0.5
To: Amman (Jordan) 3 Tripoli 8-10 2-3 5.67 0.5 2 0.5
4 Beirut 8-10 2-3 4.37 0.5 2 0.5
5 Aqaba 15-21 4-6 4.86
O-D 4: 1 Lattakia 40 5 8-19 2 0.5
From: North and South America 2 Tartous 40 5 7 2 0.5
To: Amman (Jordan) 3 Tripoli 35 2-3 5.67 0.5 0.2 0.5 0.5
4 Beirut 35 2-3 4.37 0.5 0.2 0.5 0.5
5 Aqaba 50 4-6 4.86
O-D 5: 1 Lattakia 30 5-6 8
From: Far East and South East Asia 2 Tartous 30 5-6 3.76
To: Damascus (Syria) 3 Tripoli 22-25 2-3 2.83 0.5 2
4 Beirut 22-25 2-3 1.53 0.5 2
5 Aqaba 20 3-4 8 0.5 2
O-D 6: 1 Tripoli 22-25 1-7 1.3
From: Far East and South East Asia 2 Beirut 22-25 1-7
54 M.K. Hasan Table A.4 Illegal costs at the ports and borders of the three countries
Country Border/port Import Transit
1. Boyce, D. (2007a). Forecasting travel on congested urban trans-portation networks: review and prospects for network equilibrium models.Networks and Spatial Economics,7, 99–128.
2. Boyce, D. (2007b). Future research on urban transportation net-work modeling.Regional Science and Urban Economics,37, 472– 481.
3. Boyce, D., & Xiong, C. (2007). Forecasting travel for very large cities: challenges and opportunities for China.Transportmetrica,
3, 1–19.
4. ESCWA (United Nations Economic and Social Commission for Western Asia) (1999). Survey of economic and social de-velopments in the ESCWA region 1996–1997 (Report Number E/ESCWA/ED/1999/5).
5. ESCWA (United Nations Economic and Social Commission for Western Asia) (2000a).Methodological framework of the inte-grated transport system in the Arab Mashreq(Vol. I):general out-line and main features(E/ESCWA/TRANS/2000/2).
6. ESCWA (United Nations Economic and Social Commission for Western Asia) (2000b).Methodological framework for the inte-grated transport system in the Arab Mashreq(Vol. II):a policy-sensitive model for predicting international freight flows (trade)
(E/ESCWA/TRANS/2000/2/Add.1).
7. ESCWA (United Nations Economic and Social Commission for Western Asia) (2003a).An economic feasibility study to facili-tate goods trade through the ports and lands of Jordon, Syria, and Lebanon(E/ESCWA/GRID/2003/33).
8. ESCWA (United Nations Economic and Social Commission for Western Asia) (2003b). Information system for the integrated transport system in the Arab Mashreq: information of the existing situation for good trade through the ports and lands of Jordon, Syria, and Lebanon(E/ESCWA/GRID/2003/34).
9. ESCWA (United Nations Economic and Social Commission for Western Asia) (2003c).Methodological framework for the inte-grated transport system in the Arab Mashreq (Vol. III): method-ology for future prediction and economic evaluation of different scenarios of goods trade facilitation through the ports and lands of Jordon, Syria, and Lebanon(E/ESCWA/GRID/2003/35). 10. Farahat, A. M. (1999).Preliminary thoughts on ITSAM
informa-tion system (ITSAM-IS). Paper presented at the expert group meet-ing on the harmonization of transport norms and legislative in-struments for regional cooperation in the ESCWA region, includ-ing UN/EDIFACT, held in Beirut from 16 to 18 November 1999 (E/ESCWA/TRANS/1999/WG. 2/10).
11. Friesz, T. L., & Harker, P. T. (1985). Freight network equilibrium: a review of the state of the art. In A. F. Daughety (Ed.),Analytical studies in transport economics. Cambridge: MIT Press.
12. Ham, H., Kim, T. J., & Boyce, D. (2005). Implementation and es-timation of a combined model of interregional, multimodal com-modity shipments and transportation network flows. Transporta-tion Research39B, 65–79.
13. Hasan, M. K. (1991)Comparative analysis of alternative simul-taneous transportation network equilibrium models. Doctoral dis-sertation, Texas A&M University, Texas, USA.
14. Hasan, M. K., & AlGadhi, S. A. (1998).Application of simulta-neous and sequential transportation network equilibrium models to Riyadh, Saudi Arabia(Transportation Research Record 1645). TRB, National Research Council, Washington, D.C. (pp. 127– 132).
15. Hasan, M. K., & Safwat, K. N. A. (2000). Comparison of two transportation network equilibrium modeling approaches.Journal of Transportation Engineering,126(1), 35–40.
16. Hasan, M. K., & Dashti, H. M. (2007).A multiclass simultane-ous transportation equilibrium model.Networks and spatial eco-nomics(Vol. 7(3), pp. 197–211). New York: Springer.
17. Safwat, K. N. A. (1987a)Application of simultaneous transporta-tion equilibrium model to intercity passenger travel in Egypt
(Transportation Research Record 1120). TRB, National Research Council, Washington, D.C. (pp. 52–59).
18. Safwat, K. N. A. (1987b).Computational experience with applica-tion of simultaneous transportaapplica-tion equilibrium model to intercity passenger travel in Egypt(Transportation Research Record 1120). TRB, National Research Council, Washington, D.C. (pp. 60–67). 19. Safwat, K. N. A., & Walton, C. M. (1988). Computational
expe-rience with and application of a simultaneous transportation equi-librium model to urban travel in Austin, Texas: Computational re-sults.Transportation Research B,22B(6), 457–467.
20. Safwat, K. N. A., & Magnanti, T. L. (1988). A combined trip gen-eration, trip distribution, modal split and traffic assignment model.
Transportation Science,22(1), 14–30.
21. Safwat, K. N. A., & Hasan, M. K. (1989).Computational expe-rience with simultaneous transportation equilibrium model under varying parameters(Transportation Research Record 1251). TRB, National Research Council, Washington, D.C. (pp. 17–23). 22. Safwat, K. N. A., & Hasan, M. K. (2004).Predicting international
freight flows for trade: simultaneous multimodal, multicommod-ity, network equilibrium model(Transportation Research Record 1882) (pp. 129–139).
23. Siegel, J. D., Cea, J., Fernández, J. E., Rodríquez, E. E., & Boyce, D. (2006). Comparisons of urban travel forecasts prepared with the sequential procedure and a combined model.Networks and Spatial Economics,6, 135–148.