VERIFICATION OF 3D BUILDING MODELS USING MUTUAL INFORMATION IN
AIRBORNE OBLIQUE IMAGES
A. P. Nyaruhuma a,b *, M. Gerke a, G. Vosselman a
a
Faculty of Geoinformation Science and Earth Observation (ITC), University of Twente, Hengelosestraat 99, P.O.Box 6, 7500AA, Enschede, the Netherlands - (nyaruhuma09656, gerke, vosselman)@itc.nl
b
School of Geospatial Sciences and Technology (SGST), Ardhi University, P.O.Box 35176, Dar es salaam, Tanzania
Commission III, WG III/4
KEY WORDS: Building, Revision, Edge, Matching, Fuzzy Logic
ABSTRACT:
This paper describes a method for automatic verification of 3D building models using airborne oblique images. The problem being tackled is identifying buildings that are demolished or changed since the models were constructed or identifying wrong models using the images. The models verified are of CityGML LOD2 or higher since their edges are expected to coincide with actual
building edges. The verification approach is based on information theory. Corresponding variables between building models and
oblique images are used for deriving mutual information for individual edges, faces or whole buildings, and combined for all perspective images available for the building. The wireframe model edges are projected to images and verified using low level image features - the image pixel gradient directions. A building part is only checked against images in which it may be visible. The method has been tested with models constructed using laser points against Pictometry images that are available for most cities of Europe and may be publically viewed in the so called Birds Eye view of the Microsoft Bing Maps. Results are that nearly all buildings are correctly categorised as existing or demolished. Because we now concentrate only on roofs we also used the method to test and compare results from nadir images. This comparison made clear that especially height errors in models can be more reliably detected in oblique images because of the tilted view. Besides overall building verification, results per individual edges can be used for improving the 3D building models.* Corresponding author
1. INTRODUCTION
This paper describes a method for automatic verification of 3D building models using oblique airborne images. The problem being tackled is identifying buildings that are demolished or changed since the models were constructed or to identify wrong models. This is important for maintaining correct datasets.
Already some methods have been proposed for 3D building verification. Huertas and Nevatia (2000) projected 3D models to images for detecting changes. Information from one image could not be confirmed in another image because only one image was available for a scene. The approach of Suveg and Vosselman (2004) used nadir images (stereo pairs) in the verification step of their 3D model reconstruction method. Height information was limited because of narrow side views in vertical images. Knudsen (2007) used supervised classification in airborne images. Although the dataset for verification contained simple roofs for buildings apart from each other and with similar roofing materials, some buildings were wrongly categorised due to roof colours that were not present in the training dataset.
Nakagawa and Shibasaki (2008) projected the old 3D models into both old and new oblique images and then analysed texture of the models in both images using cross correlation. However, old images are not always available and if available may not be very useful due to differences in illumination and seasons. Taneja et al (2011) avoided these complications by utilising multi-view images taken at the same period. They explored
texture invariance of building faces in multi-view terrestrial images. However, texture comparison methods may not give good results if model faces contain small objects such dormer windows or chimneys and terrestrial images captured by mobile vehicles contain only the sides of buildings facing streets.
Our method uses mutual information between model edges and oblique airborne images. The concept of mutual information was first introduced by (Shannon, 1948) for optimising information transfer in communication channels with disturbances between the source and the receiver. Mutual information has been used for many applications as a way of modelling uncertainty between related variables. For example, Vosselman (1992) used mutual information for relational matching and Suveg and Vosselman (2002) developed a method for modelling mutual information between 3D building model contours and image pixel gradient magnitude and used the method for evaluating building models constructed using aerial images and maps (Suveg and Vosselman, 2004).
Our method includes the following aspects. Firstly, we use oblique images and although in this paper only roof verification is addressed, it has already been shown that oblique images are also valuable for verification of walls (Nyaruhuma et al., 2010; forthcoming 2012). The work is part of a larger procedure which will combine wall and roof evidence. Secondly, the images used are captured with multiple overlap and from very different perspectives which allows for better identification of imaged objects. Thirdly, we propose different variables for obtaining mutual information. Instead of pixel gradient
magnitude, we propose the use of gradient direction. Fourthly, we do visibility analysis so as to concentrate only on roof edges that are not occluded by other objects. Lastly, we statistically find out the minimum amount of mutual information required for our verification purpose. The building models verified are expected to be detailed and not generalised (CityGML LOD2 and above). The images are also expected to be of large scale where the edges of the building parts are available.
In section 2 we describe the approach for identifying images in which building edges are visible if the building is not demolished. A model part is verified in images in which it is visible. In section 3 we describe our mutual information based approach to building verification. Section 4 is for experiments conducted. We first describe the data used and then give results and discussion. For comparison purpose we also conducted verification using vertical images. Lastly, section 5 provides concluding remarks and suggestion for future work.
2. VISIBILITY ANALYSIS
An important step in our verification method is to determine if an edge of a building is imaged given camera position and a possibility of occluding objects. The visibility analysis is done in two steps. The first step considers only orientation of the edge relative to the camera. Edges of surfaces that are not facing the camera are identified and eliminated. The second step checks if an edge is occluded by objects such as other buildings or trees. For this purpose we use a point cloud obtained by dense matching in oblique images (Furukawa and Ponce, 2010). Although the existing models could be used as well to check whether buildings occlude others, we employ the point cloud: we are independent from possible errors in the model, and occlusion by other objects such as trees will be identified as well. The visibility analysis for wall faces was described in (Nyaruhuma et al., 2010; forthcoming 2012). We have developed a similar approach for analysing visibility of individual roof edges.
B
P
A
B
P
A
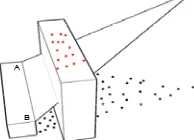
Figure 1. The edge defined by line AB is occluded because the points on the large building are above the plane ABP
Edge visibility analysis is illustrated in Figure 1. The camera position is P and the model edge being tested for visibility is AB. The visibility analysis is done by testing the presence or absence of objects obstructing rays from the camera to the edge. We first isolate all points that belong to connected components and are in between the camera and a buffer around the edge. The connected components are composed by constraining on a maximum distance between points and a minimum number of points for a component. The points that do not belong to a component are discarded as noise points. The points in between the camera and the wall are obtained by testing containment in the triangle defined by XY coordinates of points A, B and P. In the second step, the points in between the camera and the edge are tested whether they are above or below the 3D plane through points A, B and P. If the edge is occluded there will be points above the plane.
3. MUTUAL INFORMATION MODELLING
Given a 3D building model and an image or a number of images in which the building is expected, we need a method for automatically concluding that the model is correct. For our purpose, the results of verification of a model are of two types: (a) the model is correct within the specified accuracy (considering uncertainties in Section 4.1) or (b) the model is incorrect in which case the building has been demolished or changed or there were errors in the construction of the model. The idea used in the verification is to project the model in images and to find out if model edges coincide with lines in the images. The coincidence of model edges to image lines is expected to contain uncertainties due to image orientation information and errors accepted in the model reconstruction. The model errors are due to the imperfect methods used in constructing the models and due to the fact that building edges and plane faces modelled are not smooth in reality because of tiles or other materials that are not smooth and can not be captured as such in the image. We describe our method for using mutual information between the models and images. The mutual information approach takes into account the uncertainties in the models and the images. The idea for using mutual information is to learn and use the general nature of image pixels along the projected model in comparison to the general nature of the pixels in the whole image.
3.1 Mutual information
With two variables and ,
mutual information is defined (Shannon, 1948) as:
(1) In this equation is the joint probability and and
are marginal probabilities. Mutual information can also be computed by substituting from the conditional probability concept:
(2)
Thus mutual information is then
(3)
In this case, mutual information is the difference between self information and conditional information :
(4)
Where and
The self information gives the amount of information about a variable irrespective of the other variable and the conditional information models the dependency of the two variables. When the self information and conditional information are the same, the mutual information is 0. This happens when the variables are independent. Higher differences between conditional information and self information results to mutual information much above zero or much below zero.
Because of the ability to handle uncertainties, mutual information has been used for many applications, including the original analysis of information sent over noisy channels and computation of collocations (sequences of words that occur together more often than would be expected by chance). In our case, image pixels are used to obtain information about building
models. Using mutual information we identify a correct model edge in the presence of some random noise pixels that do not support the existence of the edge.
We use Equation (3) for obtaining mutual information between 3D models and images. We model image features that give evidence for presence of a building into the two probability densities and . The probability density for is obtained by using image information for the variable at random positions while for is obtained for image positions with the model. Features used are discussed below.
3.2 Mutual information using model edges
This part describes our procedure for obtaining mutual information between image and building models. We use image pixel gradients from the Sobel operator. Instead of gradient magnitude, we use the gradient direction. The reasons for this choice are discussed in Section 3.3 below.
To obtain mutual information using model edges we first estimate the pixel gradient direction probability density and edge pixel gradient direction (conditional) probability density as follows. Some model edges (such as 500 in total) used for training are projected into images and the direction
of each of the projected edge is computed. From the images we also compute gradient directions for pixels a) chosen at random image positions and b) along the projected edges. Intuitively, gradient directions computed for pixels at random image positions are equivalent to gradient directions for pixels along random segments placed in the image.
Then, we compute two sets of angles and their distributions. The first is a set of angles each between a random pixel gradient direction and the direction of projected edge chosen randomly. The second is a set of angles each between a pixel along a projected edge and the direction of the edge. Each angle is computed as:
(5)
For each of the two sets, we make a histogram with classes of angles such as 1 degree (180 classes) and assign every angle a class in order to obtain a distribution of the angles. The two distributions are the pixel gradient direction probability density and the edge pixel gradient direction probability density .
From pixel direction probability density and edge pixel direction probability density we compute mutual information for each of the angles as:
(6)
The pixel gradient direction probability density and edge pixel direction (conditional) probability density are shown in Figure 2. From the two densities we may note three aspects. Firstly, we note the uniform distribution of the pixel gradient direction. This is as expected because pixels randomly selected from a scene containing buildings, roads, trees etc should have gradients facing all directions. Secondly, the highest probability of the edge pixel directions is around 90 degrees. This is also as expected because pixel gradient directions along an edge are ideally in normal direction to the edge. The distribution exhibits the characteristics of the von Mises distribution with some standard deviation depending on the signal to noise ratio and the uncertainties in the model edges. Lastly, the two
distributions have clear difference which is an important element for mutual information.
The mutual information from the densities on Figure 2 is shown in Figure 3. From the figure, it can be noted that mutual information is highest around 90 degrees. For each pixel on the edge being verified we compute the amount of mutual information. In Section 3.4 we describe the combination of mutual information from different pixels and discuss the procedure for setting the minimum amount of mutual information required for categorising a model edge as existing in the image.
Figure 2: Pixel gradient direction probability density and the edge pixel gradient direction probability density
-2.5
Figure 3. Mutual information for different angles between projected model edges and pixel gradient directions
3.3 Robustness of the gradient directions with respect to illumination change
For our purpose, gradient directions are preferred over gradient magnitude. The main reason is that the gradient magnitude differs with change of illumination while the directions are not affected.
The other reason for not using gradient magnitude for edge verification is that the magnitude may be higher irrespective of direction. Example cases are when an edge being verified does not exist in the image but its position intersects other edges facing different directions. The pixels on this intersection will have high gradient magnitude.
3.4 Verification using mutual information
Using results shown in Figure 3 we compute mutual information for all pixels (P) along an edge projected to an image. We assume that image pixels are independent and compute mutual information for a whole model edge as a sum for all pixels along the edge. We also sum up mutual information for all edges (E) projected into an image. We also assume independence of pixels from image taken from different perspectives. Even when an edge of a demolished building model coincides with an arbitrary line in the image, the wrong result is suppressed by the absence of the same line in images
from other perspectives. Thus, the sum is also computed over all images (G) in which model edges may be visible. Thus the mutual information for a model M is obtained as
(7) Mutual information is computed taking into consideration uncertainties in model edge position and image orientation. Edge pixel gradient directions are computed not only along the projected edge but also for some lines constructed - at one pixel distance each - within a buffer of the projected edge. The buffer is determined taking into account the uncertainties, in the image orientation and the model construction, discussed in Section 4.1. Then the mutual information of the line with the maximum mutual information among the lines in the buffer is selected.
For categorising a model edge for verification we use a statistical test on the amount of mutual information that is sufficient within a confidence limit (Vosselman, 1992, p. 138-141). Consider the mutual information in Figure 3 and the edge pixel gradient direction probability density in Figure 2. By combining the function in Figure 2 and in Figure 3 one can calculate the probability that a certain amount of mutual information will be found for an edge pixel:
(8)
From this one can derive the probability that the mutual information will be within a certain range r.
(9)
Equation (9) is for a continuous case but in our case the distribution is discrete and thus the probability for the range of mutual information is:
(10)
Using equation (10) the required minimum mutual information for classifying a pixel as being on an existing model edge is obtained by considering a threshold based on an acceptable type I error such as 0.05 (i.e ). That is, we seek which satisfies the equation:
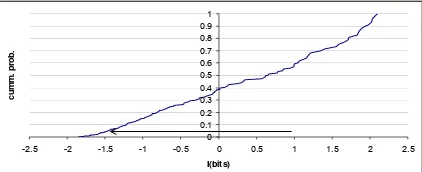
(11) For practical computation of the threshold we use the cumulative distribution of mutual information. For one pixel the cumulative distribution is as shown in Figure 4. Given different numbers of edge pixels, we obtain different distributions computed as in (Vosselman, 1992). A combination of more pixels results to less negative mutual information and the 0.05 threshold should be at more bits. A building model with 400 pixels (for all edges in all images) will be accepted as correct with 95% confidence if the aggregate mutual information is above 633 bits (Figure 5). For each model, an individual threshold for its acceptance will be computed according to the number of pixels for all edges and for all images where it is visible. For computational reasons, a look-up table was obtained beforehand.
4. EXPERIMENTS
4.1 Data and pre-processing
Oblique images: Pictometry images from Blom are used. The system captures five images at the same time (Wang et al., 2008; Petrie, 2009). These images are captured at nadir, left, right, back and forward orientations. However, nadir images are
0
Figure 4. Mutual information cumulative distribution for one pixel – the arrow indicates the 0.05 threshold (95% confidence)
0.0
Figure 5. Mutual information distribution for 400 pixels
not available for this research. A portion of one of the images is shown in Figure 6 (left). The exterior and interior orientation parameters were obtained by incorporating scene constraints in the triangulation of oblique images (Gerke, 2011). The RMSE at check points in object space was around 20 cm in x, y and z components after the self-calibration bundle adjustment. A point cloud was also obtained by matching in the oblique images (Furukawa and Ponce, 2010). Figure 6 (right) shows a portion of the point cloud overlaid with building models.
Figure 6. Portions of an oblique image ©Blom of the city centre of Enschede, a nadir looking image from UltracamD and a point cloud obtained from oblique images overlaid with 3D models
Nadir looking images: Since roof faces used in our verification are also available in vertical views, conducted verification experiments not only for the oblique but also by using nadir looking images. The intention is to find out how the method works for nadir images and to compare the results with those obtained from oblique images. We expect results from oblique images to be better because of the tilted view where height changes are more obvious and should be detected more reliably. The nadir images are stereo pairs taken with UltracamD and with spatial resolution comparable to the oblique images (the ground sample distance is 11 cm while it is varying between 10 cm to 16 cm for the oblique images). A portion of one of the nadir images is shown in Figure 6 (middle).
Buildings verified: For this study we used 3D building models for a part of the city of Enschede in the Netherlands. The model construction is not part of this work. They were already constructed using the target based graph matching approach (Oude Elberink and Vosselman, 2009). The models have detailed faces of roofs (Figure 7). However, these models
contain errors not only because the buildings are changed in reality but also because of data gaps and the difficulty of ascertaining roof outlines using laser points (Oude Elberink and Vosselman, 2011). We intend to identify these errors as well by our edge-based verification method.
The developed verification method takes into account uncertainties in the image orientation parameters and model errors above mentioned. By using a sample from well defined model edges we have estimated the standard deviation of the position of the edges in images at around 0.5 pixels. For our experiments, we have therefore used one pixel (2 times 0.5) as the tolerance with 95% confidence.
Figure 7. 3D building models sample for verification
4.2 Experimental results
The following are results obtained by using our method applied on existing and demolished buildings (i.e. correct and wrong models). Because there were not many demolished buildings in reality, others were simulated by shifting existing models to arbitrary locations. The results for individual edges are combined per roof face and per building model as discussed in Section 3.4. There are 98 existing, 114 demolished buildings in oblique images and 94, existing, 118 demolished buildings in vertical images. The images were not taken at the same period and some buildings were changed (actually 4 were demolished) in between. The results for the actual buildings are shown in Figure 8. For the simulated buildings the results are also shown at per-roof-face level in Figure 9. The results, per-roof-face and per-building, are summarised in Table 1.
Image type
Actually Existing
Actually Demolished
Results exists demoli
shed
demolis hed
exists
Oblique 450 0 577 9
Per roof
face Vertical 411 0 569 40
Oblique 98 0 114 0
Per
building Vertical 94 0 115 3
Table 1. Building verification results
Looking at the per-roof-face results all existing faces are correctly identified in both oblique and vertical images. For the actually demolished (or wrong faces), 9 are wrongly categorised as existing for oblique images while for vertical images there were 40 faces. For the oblique image the 9 (2% of the total of 586) error faces were due to face edges being on some lines in images coincidentally. All these errors occurred in the simulated data. For the nadir images the problem is mainly due to the fact that when a building height is changed (vertical extension), or a model edge is correct in 2D position but wrong in height, the roof face is imaged in nearly the same position
and the height change is difficult to detect while the height difference is clearly captured in oblique images. This is illustrated in Figure 10 where a wrong face was identified in oblique images but was accepted as correct in vertical images.
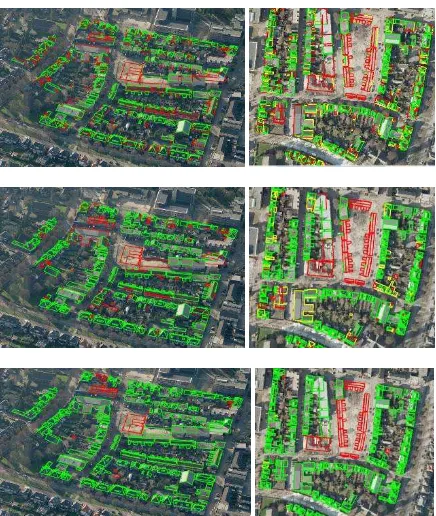
Figure 8. Verification results using oblique ©Blom (left) and nadir images (right) - per edge (top), per roof face (middle) and
per building (bottom) – the green are existing, red are demolished and yellow are demolished but wrongly identified
Figure 9. Verification results for simulated demolished buildings in oblique ©Blom and vertical images – red for
demolished
Looking at the per building results, all buildings that are categorised as existing in oblique images actually exist, i.e. no demolished building is wrongly identified as existing and all existing buildings are correctly identified. For the nadir images, 3 small demolished buildings were categorised as existing and all existing buildings were identified. These good per-building results are mainly due to the fact that even when a few edges of a model are incorrect due to automatic reconstruction their verification results will be suppressed when the majority of the edges indicate that the building exists.
Although the primary idea for our method was to classify buildings as demolished or existing, the per-edge results may be useful for improving the models. Figure 11 shows two example of wrong model lines. In both cases, some lines are correct and some are wrong. In the first case the wrong lines could not be verified because they were far outside the buffer region defined by the accepted error. In the second case, the model lines constructed at a proper 2D position but wrong height were far away from their actual position and could not also be verified.
Figure 10. A wrong face identified in oblique image ©Blom (red in the right image) but not identified in nadir images (left)
Figure 11. Building models with some correct and wrong edges - red lines are correctly identified as wrong - images©Blom
5. CONCLUSION AND OUTLOOK
Results in this work indicate that oblique images are useful for verification of 3D building models. The results from oblique images are similar to nadir images for most cases and better in the cases where the differences or changes are in vertical direction. The method developed is useful for identifying buildings that were changed since models were acquired. The changes may have occurred due to normal urban redevelopment or during disasters such as tsunami or earthquakes.
The results obtained per individual edge or face can also be used for checking the quality of 3D building modelling. If the building exists and most faces are correct the verification results for a 3D model automatically reconstructed will indicate that the building exists. Individual faces with results contrary to the overall may be updated. This may be done manually but automatic updating of 3D models using image information is an interesting future work.
The results reported were obtained only from roofs. We intend to extend the method in order to take advantage of an important characteristic of oblique images: the presence of both top (roof) and side views (walls) of buildings. Good results were reported on verification of building outlines using wall information in oblique image (Nyaruhuma et al., 2010; forthcoming 2012). A similar approach may be used for verification of 3D models but in this case a strategy is required for combining wall and roof evidence.
ACKNOWLEDGEMENTS
We would like to thank BLOM Aerofilms for providing the Enschede images. We also thank the anonymous reviewers for their comments.
REFERENCES
Furukawa, Y. and J. Ponce, 2010. Accurate, Dense, and Robust Multi-View Stereopsis, IEEE Transactions on Pattern Analysis and Machine Intelligence 32(8): 1362-1376.
Gerke, M., 2011. Using horizontal and vertical building structure to constrain indirect sensor orientation, ISPRS Journal of Photogrammetry and Remote Sensing 66(3): 307-316.
Huertas, A. and R. Nevatia, 2000. Detecting changes in aerial views of man-made structures, Image and Vision Computing
18(8): 583-596.
Knudsen, T., 2007. An algorithm for verification and change detection between 3D geospatial databases and aerial images,
International Archives of Photogrammetry, Remote Sensing and Spatial Information Sciences 36-1/W51.
Nakagawa, M. and R. Shibasaki, 2008. Building Change Detection Using 3-D Texture Model, International Archives of Photogrammetry, Remote Sensing and Spatial Information Sciences 37 (Part B3a): 173-178.
Nyaruhuma, A.P., M. Gerke and G. Vosselman, 2010. Evidence of walls in oblique images for automatic verification of buildings, International Archives of Photogrammetry, Remote Sensing and Spatial Information Sciences 38(Part 3A): 263-268.
Nyaruhuma, A.P., M. Gerke and G. Vosselman, forthcoming 2012. Verification of 2D building outlines using oblique airborne images, ISPRS Journal of Photogrammetry and Remote Sensing accepted for publication.
Oude Elberink, S. and G. Vosselman, 2009. Building Reconstruction by Target Based Graph Matching on Incomplete Laser Data: Analysis and Limitations, Sensors 9(8): 6101-6118.
Oude Elberink, S. and G. Vosselman, 2011. Quality analysis on 3D building models reconstructed from airborne laser scanning data, ISPRS Journal of Photogrammetry and Remote Sensing
66(2): 157-165.
Petrie, G., 2009. Systematic oblique aerial photography using multi frame cameras, Photogrammetric Engineering & Remote Sensing 75(2): 102-108.
Shannon, C.E., 1948. A mathematical theory of communication,
Bell Systems Technical Journal 27: 379-423 and 623-656.
Suveg, I. and G. Vosselman, 2002. Mutual information based evaluation of 3D building models, Pattern Recognition, 2002. Proceedings. 16th International Conference on.
Suveg, I. and M.G. Vosselman, 2004. Reconstruction of 3D building models from aerial images and maps, ISPRS Journal of Photogrammetry and Remote Sensing 58(3-4): 202-224.
Taneja, A., L. Ballan and M. Pollefeys, 2011. Image Based Detection of Geometric Changes in Urban Environments. 13th International Conference on Computer Vision (ICCV2011). Barcelona, Spain: (on CDROM).
Vosselman, G., 1992. Relational matching, Berlin, Springer.
Wang, Y., S. Schultz and F. Giuffrida, 2008. Pictometry's Proprietary Airborne Digital Imaging System and its Application in 3D City Modelling, International Archives of Photogrammetry, Remote Sensing and Spatial Information Sciences 37 (Part B1): 1065-1070.