Principal component analysis of chewing sounds to detect
differences in apple crispness
N. De Belie *, V. De Smedt, J. De Baerdemaeker
Department of Agro-engineering and-economics,Katholieke Uni6ersiteit Leu6en,Kardinaal Mercierlaan92,
B-3001He6erlee,Belgium
Received 10 May 1999; accepted 11 October 1999
Abstract
An investigation was made to establish the basic relationship between the crispness of ‘Cox’s Orange Pippin’ apples (Malus domestica Borkh.) and recorded chewing sounds. Crispness groups were created by submitting apples to varying storage conditions. After carrying out a fast Fourier transformation on the time signal of the generated sound, principal component analysis (PCA) was carried out on the power spectra of a training set, and a calibration matrix for group prediction was created. The PC values were compared with mechanical parameters, including apple firmness measured with the acoustic impulse response technique, maximum force and slope of the force-deformation curve during a penetrometer measurement, and tensile strength in a ring tensile test. PCA on Fourier-transformed chewing sounds appeared to be a promising technique to separate apple crispness groups. By further development this technique has potential as an objective measure for crispness evaluation. Mealy and crisp apples could be distinguished by PCA. The frequencies between 100 and 500 Hz and between 800 and 1100 Hz contributed most to the PCs calculated from the original power spectra, corresponding to peaks in power spectra of crisp apples. When PCA was carried out on the logarithm of the original power spectra, all frequencies contributed to some degree to the PCs. In further experiments on a variety of stored fruit, the position of the power spectra in the PC1 – PC2 space was correlated with apple tensile strength. Prediction of group belonging, using a calibration matrix based on the first 15 PCs, gave much better results for the logarithm of the power spectra than for the original signals. Chewing sounds from apples stored under normal air composition or under ULO conditions could be distinguished relatively well, while two RH groups could not be separated. This corresponded to results from sensory analysis. © 2000 Elsevier Science B.V. All rights reserved.
Keywords:Chewing sound; Acoustic; FFT; Principal component analysis; Crispness; Apple
www.elsevier.com/locate/postharvbio
1. Introduction
Since 1963, biting and chewing sounds have been recorded and studied to obtain more infor-mation on food texture. Various techniques have been used to record the sounds. Drake (1963) * Corresponding author. Tel.: +32-16-321446; fax: +
32-16-321994.
E-mail address:[email protected] (N. De Be-lie)
compared different pick-up devices: a microphone pressed against the cheek, the microphone held 2 inches in front of the open mouth, and a hearing-aid earphone connected to the ear canal via short plastic tubing. Vickers and Bourne used a micro-phone held 1 inch in front of the mouth (Vickers and Bourne, 1976) or against the outer ear imme-diately above the opening of the ear canal (Vickers, 1981, 1983). Lee et al. (1988) recorded chewing sounds on chips with a microphone positioned in front of the subject’s mouth. Dacremont et al. (1991) estimated bone conduction by recording chewing sounds with a microphone pressed against the subject’s cheek, near the maxillar angle. Air conduction was measured with a microphone held in front of the ear canal opening at 8 cm. De Belie et al. (1999) recorded bone-conducted chewing sounds by placing a microphone, fixed in an earmuff, over the ear canal at the side where the apple pieces would be chewed.
All techniques might give an empirical measure of differences between foodstuffs. Nevertheless some disadvantages are still connected with the different techniques and it is not always easy to interpret the sounds in terms of the actual vibra-tions of the foodstuffs and the jaw. The soft tissues in the mouth tend to absorb or damp the higher frequencies of the sound (Vickers, 1991). Interfer-ence between chewing movements in general, and specific food crushing sounds, can occur. Drake (1963) situated the mouth opening sounds in a broad region around 160 Hz. Kapur (1971) mea-sured the resonance frequency of the jaw by placing a very fine needle directly on the bone surface and found it to be about 160 Hz. The bone-conducted sound travelling through teeth and jaws to the ear is therefore amplified at this frequency. On the other hand, when air-conducted sounds are recorded with a microphone held in front of the open mouth, this does not necessarily give a true picture of normal chewing.
Drake (1963) found that the breakdown of the structure of a foodstuff during normal chewing was paralleled by a decline in the average amplitude of successive bursts of mastication sounds. Crisper products would produce a louder noise. Other than possessing a broad frequency range and very irreg-ular amplitude versus time picture, there was no
frequency characteristic unique to crisp sound (Vickers and Bourne, 1976). In the time domain the crisper samples showed higher sound amplitude and/or a greater density of sound occurrence. Lee et al. (1988) found significant differences in the sounds produced when eating fresh or stale potato and tortilla chips. Sounds from fresh samples were typically louder and displayed greater amounts of higher frequency components. Other authors also found that crisp food generated high-pitched sounds (Vickers, 1984, 1985; Dacremont, 1995).
Different parameters have been used to judge a chewing sound. This includes the number of sound bursts n in a bite or chew, the mean height or amplitude of the burstsA, which is correlated with the loudness (Drake, 1965), and the product nA
andnA/duration (Vickers, 1983). Lee et al. (1988) applied fast Fourier transformation (FFT) with Hanning weighting and exponential averaging fol-lowed by data reduction (1 kHz segments) and averaging of different spectra. Al Chakra et al. (1996) also divided the 100 Hz to 12 kHz signal into frequency bands of 2 kHz, thus characterizing every spectrum by a 6-component vector. Seymour and Hamann (1988) used mean sound pressure, pressure level and intensity in different frequency ranges of sounds produced while the sample was fragmented by a shear/compression cell. Also, combinations of mechanical and acoustic parame-ters have been determined (Vickers, 1987; Seymour and Hamann, 1988). More recently, texture of dry-crisp food has also been analysed by fractal analysis on food crushing sounds produced during compression in a testing device or during biting (Barrett et al., 1994; Tesch et al., 1995; Duizer et al., 1998).
Most researchers working with acoustic record-ings of chewing sounds have compared a large range of different products or concentrated on specific dry-crisp products, for instance, at several
previous research programme of De Belie et al. (1999) on ‘Royal Gala’ apples, high amounts of frequency components between 700 and 900 Hz and to a lesser extent between 1200 and 1400 Hz were attributed to general chewing movements and teeth contact. After FFT and data segmenta-tion per 100 Hz, the amplitude-frequency data of both first bite and first chew contained a ‘hump’ around 4000 Hz. The minimum in the spectra around 3000 Hz would be caused by the damping properties of the soft tissues in the mouth. The best correlation with sensory crispness could be found by combining the information from differ-ent frequency bands (correlation coefficidiffer-ents up to 0.83). However, the significant frequency bands differed from panelist to panelist, which made it extremely difficult to use single or combined fre-quency bands as a common measure of crispness. Changes in fractal dimension could not be corre-lated with sensory crispness.
The current research aimed to investigate whether a better distinction between apples with different texture could be obtained through prin-cipal component analysis (PCA) on chewing sounds. As such the study was intended to in-crease basic understanding of chewing sounds, as well as to make a base for further development of a method for objective crispness evaluation. At-tention was also paid to the correlation between chewing sound parameters and instrumental measurements.
2. Materials and methods
2.1. Apples
‘Cox’s Orange Pippin’ apples (Malus domestica
Borkh.) at commercial maturity were harvested on 15 September 1998, from a Belgian orchard. The apples were divided in two groups according to size: ‘small’ with a diameter of 60 – 70 mm and ‘large’ with a diameter of 70 – 80 mm. The apples were stored at 3°C and under three combinations of relative humidity (RH) and atmosphere com-position: (1) 95% RH/air; (2) 85% RH/ULO; (3) 95% RH/ULO (ULO, ultra low oxygen: B0.7% CO2, 2.2% O2). Some standard measurements
were performed during the storage period to char-acterize the apples. The values for soluble solids content (°Brix) of the apple juice, determined with a digital refractometer (PR-101, Palette Series, ATAGO CO., Ltd., Japan), implied that after 6 weeks of storage most of the starch had been converted into soluble sugars. After 12 weeks of storage no further increases in soluble solids con-tent could be registered for the different storage conditions. Relative weight losses of about 6, 8 and 4% were measured for apples stored under the 95% RH/air, 85% RH/ULO and 95% RH/ ULO conditions, respectively.
2.1.1. Experiment with mealiness induction
The aim of the first experiment was to investi-gate whether rather large differences in apple texture could be recognized through analysis of chewing sounds. Therefore, after 6 weeks of stor-age, 20 large apples were removed from the 95% RH/air storage and submitted to conditions of 20°C and 95% RH for 2 weeks. This treatment was supposed to induce a mealy texture in the apples, confirmed through benchtop tasting by the authors. Mealy apples have lost their crispness by solubilization of the pectins (Reeve, 1970). Degra-dation of the cementing substances holding the cells together results in an easy separation of the cells when the apple is bitten, instead of breaking across their walls (Harker and Hallett, 1992; Harker et al., 1997c). This implies a loss of crisp-ness without a significant moisture loss. These apples were, at 8 weeks after harvest, compared with ten apples taken from the 95% RH/ULO group, which were supposed to have retained a crisp texture and with 20 apples from the 95% RH/air group, which were considered as having an intermediate crispness.
2.1.2. Experiment on different storage conditions
differ-ent textural, taste and external appearance at-tributes, including crispness, hardness, juiciness, dryness, flouriness and granularity. These texture attributes are (unlike the term mealiness) fre-quently used by English consumers to describe apple texture. However, dryness, granularity, and especially flouriness, are related to mealiness. The sensory tests revealed that apples from the air
group were less crisp, less hard and less juicy than apples stored under ULO conditions, while they were also more dry, floury and granular. Although the differences were not always significant (PB 0.05), small apples were in general scored as being more crisp, hard and juicy than larger apples. In the current programme, it was investigated whether the different size and storage groups could be distinguished by analysis of the chewing sounds.
Different mechanical tests were performed on the same apples and the relationship between chewing sounds and mechanical parameters deter-mined. All the different measurements on one apple were carried out on the same day. After mechanical testing, the remaining apple halves were covered with a plastic sheet and chewing sounds were recorded within 1 h.
2.2. Mechanical testing
Apple firmness was measured by means of the acoustic impulse response technique as described by Chen (1993). The apples were placed on a support with the stalk sidewards. In this support, at a few mm from the fruit surface, an upward directed microphone was mounted (ECM-2005, Monacor). The apple was excited by gently im-pacting it on the equator at the opposite side of the microphone with a full plastic rod. The re-sponse frequency spectrum was calculated with a fast Fourier transformation. The first resonance frequency was selected (De Baerdemaeker, 1989; Chen et al., 1992) and the stiffness factor S was calculated as S=f2
m2/3 where
f is the first reso-nance frequency (Hz) and mis the fruit mass (g) (Cooke and Rand, 1973). To reduce local effects caused by the variance in shape inherent in horti-cultural products, the average of three measure-ments equally spaced around the fruit equator was
taken (Chen, 1993).
For each tested apple, a penetrometer measure-ment was made with a universal testing machine (UTS Testsysteme GmbH, Ulm, Germany). The skin was pared and an 11.1 mm diameter Effegi probe was driven into the fruit to a depth of 8 mm at a speed of 20 mm/min. The maximum force
Fc,max was recorded, and the slope of the force – deformation curve was calculated by linear regres-sion between 1/3 and 2/3 of the first maximum.
A ring tensile test was performed on ring-shaped samples with an outer diameter of 17 mm, a wall thickness of 4 mm, and a height of 11 mm, taken from a disc of apple flesh from the equato-rial plane of the apple. The sample axis was parallel to the apple axis. The samples were slid over two half ring shaped cylinders, which could be pulled apart by the UTS. The sample was precharged with a force of 1 N and then stretched with a constant deformation speed of 20 mm/min until rupture. The maximum force Ft,max, which occurs just before breakage of the sample, was registered (Verlinden and De Baerdemaeker, 1994).
2.3. Recording and analysing of chewing sounds
From each half apple, remaining after mechani-cal testing, a 2 cm thick piece was cut, the freshly cut surfaces being parallel to the longitudinal apple axis. After removal of the skin the test person positioned the apple piece against the in-cisors and a bite (with the inin-cisors) and different chews (with the molars) were recorded at a chew-ing rate of one chew per second. This chewchew-ing rate could be easily controlled with a stopwatch and was also used by Lee et al. (1990). The chewing sounds were recorded by placing a microphone (ECM-2005, Monacor) over the ear canal at the side where the apple pieces would be chewed. The sampling rate amounted to 22 050 samples per second and sampling size was 16 bits. The first bite was selected from the signal in the Creative Wave Studio programme (Creative Technology Ltd.).
bite sound waves shorter than 22 050 samples (1 s), the wave was padded with trailing zeros to length 22 050. The frequency resolution was there-fore 1 Hz for all sound waves. The power spec-trum was obtained by squaring the magnitude of the first 11 025 (=N/2) frequency components. Because the Fourier transformation of a real sig-nal is symmetric, the power at a positive fre-quency is the same as the power at the corresponding negative frequency (contained in the second half of the original Fourier spectrum). To eliminate the DC component and low fre-quency noises from the signal, only the frequen-cies larger than 100 Hz were considered for further processing.
The power spectra of the different apple bites were first split into a training set and a validation set. One fourth of the spectra were located in the validation set. Care was taken that the numbers of spectra from the different predefined apple groups were proportional for the training and validation sets. All spectra were standardized to compensate for possible differences in recording volume, for instance due to slightly different posi-tions of the microphone in the ear during different recordings. Therefore differences in total sound level will not take part in the principal component analysis, and only relative differences between sound levels at different frequencies will have an influence. The spectra were mean-centered by sub-traction of the average spectrum of the training set. Principal component analysis (PCA) was car-ried out on the standardized and mean-centered training set data.
The general objectives of PCA are data reduc-tion and interpretareduc-tion (Johnson and Wichern, 1998). Although all the P (=11 025) frequency components of the signal are needed to reproduce the total system variability, much of this variabil-ity can be accounted for by a smaller numberkof principal components (PC). Algebraically, these principal components are linear combinations of the original variablesX1,X2, … Xp(the power at the different frequencies). The principal compo-nents are uncorrelated and have variances equal to the eigenvalues of the covariance matrix of
X1, X2, … Xp, the first PC having the largest variance and so on. A useful visual aid to
deter-mine an appropriate number of principal compo-nents is a scree plot. With the eigenvalues ordered from the largest to the smallest, a scree plot is a plot of the magnitude of an eigenvalue (=the variance of the PC) versus its number. The num-ber of components can be taken to be the point at which a distinct bend in the scree plot occurs, such that the remaining eigenvalues are then rela-tively small and all about the same size. Geomet-rically, the linear combinations represent the selection of a new coordinate system, obtained by rotating the original system with X1,X2, …Xpas the coordinate axes. The new axes represent the directions with maximum variability (=the prin-cipal components) and provide a simpler descrip-tion of the covariance structure.
For the current analysis, the principal compo-nents were calculated from the training set data only. Both training and validation set spectra were then expressed in terms of those principal components. The nominal variable referring to the groups was for this analysis to be replaced by a binary coding system. If it is known for the apples in the training set to which ‘group’ they belong, or if a ‘crispness value’ can be attributed to the individual apples, a calibration matrix can be generated, based on the PCs. The calibration matrix provides the best possible prediction of group belonging or crispness value for the data in the training set. The existence of an independent validation set then permits the performance of a calibration to be evaluated. Whereas graphical representation of the values for the first two PCs is useful for a first visual interpretation, more PCs can be included in the calibration matrix, result-ing in a better prediction.
3. Results and discussion
3.1. Experiment with mealiness induction
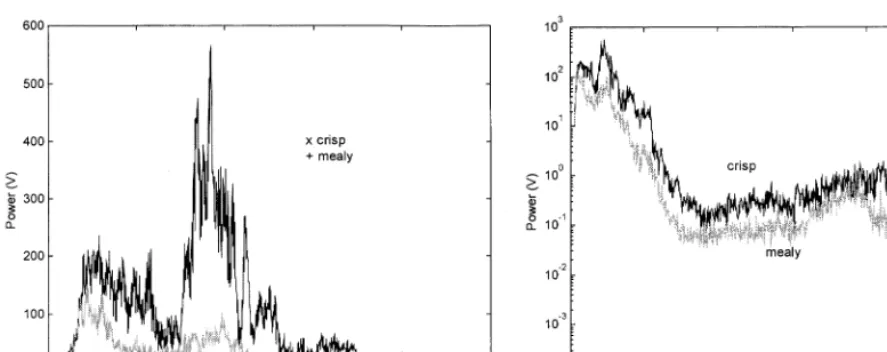
Fig. 1. Average power spectra of mealy and crisp apples on a linear (left) and a logarithmic scale (right). On the linear scale, the data shown are restricted to frequencies below 2500 Hz, since the power value of higher frequencies was close to zero.
our data acquisition system and sampling rate. Vickers (1986) also found that most of the sound energy of chewing sounds fell in the range of 0 – 10 kHz. Al Chakra et al. (1996) found that all the information characterizing the sound emission of cylindrical pasta samples compressed with a jack was located below 12 kHz. Lee et al. (1990) state that frequencies up to 8000 Hz may provide use-ful information. Other authors only consider the frequency range up to 3500 Hz (Seymour and Hamann, 1988). It is clear from Fig. 1 that on a linear scale only the frequencies below 2500 Hz are of any importance. However, since human hearing can be characterized by a logarithmic scale, higher frequencies can also be important for crispness evaluation.
As found by other authors on different food materials, the crisper samples showed a higher sound amplitude at nearly all frequencies. On a linear scale, humps could be seen in the spectrum between 200 and 600 Hz, between 800 and 1100 Hz, and between 1200 and 1400 Hz, especially for the crisp apples. In previous experiments (De Belie et al., 1999), high amounts of frequency components between 700 and 900 Hz and to a lower extent between 1200 and 1400 Hz were partly attributed to general chewing movements and teeth contact. It could be that especially at those frequencies, the louder sounds of the crisp
apples are even more amplified. Also the mini-mum in the spectra around 3000 Hz was noticed in the previous experiments and could be caused by the damping properties of the soft tissues in the mouth.
Fig. 2 shows the scree plot for the first 15 principal components, calculated from the power spectra in the training set. Together they explain about 94% of the total population variance. Using those 15 PCs implies a large data reduction from
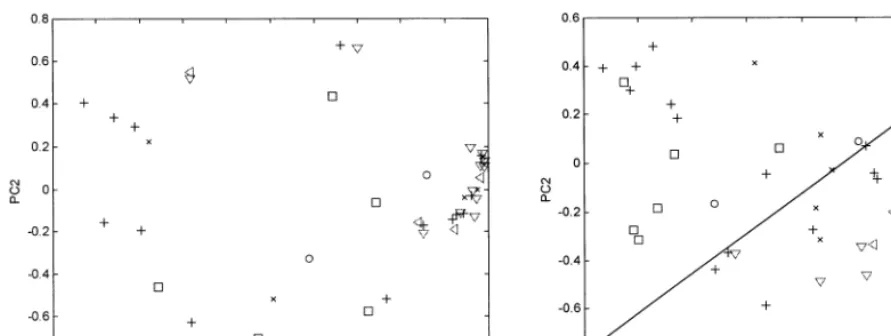
Fig. 3. First two PC values of the power spectra (left) and of the logarithm of the power spectra (right) for 20 mealy, ten crisp and 20 intermediate apples (mealy:training set,validation set; crisp:training set,validation set; intermediate:+ training set, × validation set). The line indicates the separation between the mealy and crisp groups by discriminant analysis.
the original 11 025 variables. A distinct bend oc-curs in the scree plot at the 3rd PC, indicating that a further restriction to the first three PCs would be appropriate. Those three together ex-plain about 73% of the total population variance. In Fig. 3, the first two PC values are plotted for the different bite power spectra. All but three of the 20 mealy apple sounds, regardless of their belonging to the training or validation sets, were clustered together in the PC1 – PC2 space. This ‘mealy’ cluster could be characterized by a value larger than 0.6 along the first PC axis. The re-maining three mealy apple sounds were character-ized by a PC2 larger than 0.5. Only one of the ten crisp apples was located in the same cluster as the mealy apples. The intermediate group, however, could not be distinguished from the mealy or crisp groups. When a calibration matrix, based on the PCs, was used to estimate if the apple sounds belonged to the crisp or mealy group, all eight crisp and 15 mealy apples from the training set were identified as such, whereas for the validation set, one crisp and one mealy apple were classified in the wrong group. The frequencies between 100 and 500 Hz and those between 800 and 1100 Hz especially contributed to the PCs. This could be expected from the peaks in the power spectra (Fig. 1), which are more or less located at those frequencies.
The principal component analysis was also car-ried out on the logarithm of the original power spectra. The scree plot indicated that in this case the first 15 PCs explained 70% of the total vari-ance only. A bend occurred at PC4, but the first 4 PCs explained only 41% of the total variance. In Fig. 3 the first two PC values are plotted for the different power spectra. The mealy and crisp ap-ple groups could be separated by one straight line, while the intermediate group could not be sepa-rated, especially not from the crisp group. Proba-bly the difference in crispness between the 95% RH/ULO and the 95% RH/air groups was not yet large enough at 8 weeks after harvest. All differ-ent frequencies contributed to some degree to the PCs.
3.2. Experiment on different storage conditions
3.2.1. Mechanical parameters
According to the Svalue, and the slope of the force deformation curve during a puncture test, a difference in firmness seemed to exist between the 95% RH/air and the 85% RH/ULO groups on the one hand and the 95% RH/ULO group on the other. Apples of the latter group appeared to be firmer. However, when the maximum compressive and tensile strengths are considered, both apple groups stored under ULO conditions appeared to possess a similar tissue strength, while the apples stored under normal air composition showed a considerably lower strength. Comparison with the sensory evaluation (which was, however, made 1 month after these experiments were performed) suggested that Fc,max and Ft,max provided in this case a better indication of sensory crispness. A possible explanation for the different appreciation of the 85% RH/ULO group according to the parameters measured could be the different influ-ence of the structural changes taking place associ-ated with those parameters. Due to the lower RH during storage, the apples lost more weight than the apples stored at 95% RH/ULO, causing a somewhat denser, more flaccid, and tougher, but less firm structure. The higher elasticity of those apples is reflected in the lower Svalue and slope of the force – deformation curve. However, since the other storage conditions (temperature and air composition) were similar for apples in the 85% RH/ULO and 95% RH/ULO groups, these apples
ripened at about the same rate. Furthermore, it appeared that no typical texture attributes of mealiness were induced in the 85% RH/ULO ap-ples (sensory evaluation) so that the compressive and tensile strength remained high.
3.2.2. Principal component analysis on chewing sounds
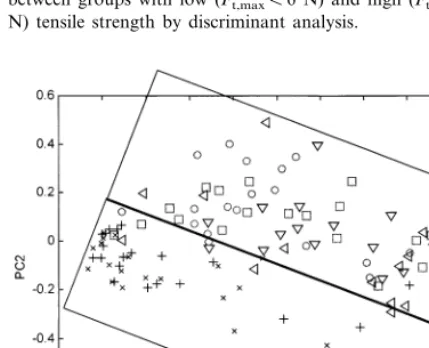
Principal component analysis on the power spectra of the bite sound waves showed that in this case only 50% of the total population vari-ance could be explained by the first seven PCs, the 7th PC being the one at which the elbow in the scree plot occurred. Graphical presentation of the signals versus the first two PCs did not allow separation of the different size/storage groups. However, if the points were labelled with their tensile strength, it was clear that apples with a high tensile strength were located in a different section of the PC space than apples with a low tensile strength. To illustrate this, in Fig. 4 the power spectra belonging to apples with low, inter-mediate and high tensile strengths are represented by different symbols. A line is drawn to separate apples with high and low tensile strengths, a distinction made solely on the analysis of chewing sounds. No such distinction could be found for the three other mechanical parameters. This result confirms that mainly tensile forces cause fracture of the apple tissue during biting and result in the
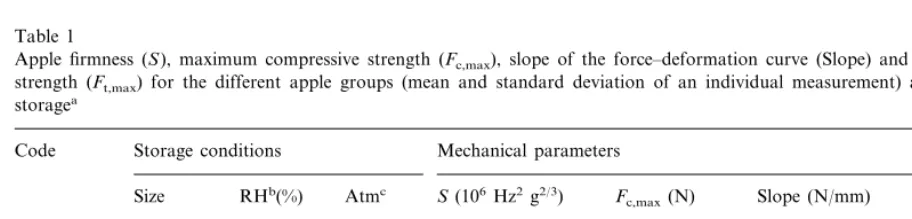
Table 1
Apple firmness (S), maximum compressive strength (Fc,max), slope of the force–deformation curve (Slope) and maximum tensile
strength (Ft,max) for the different apple groups (mean and standard deviation of an individual measurement) after 12 weeks of
storagea
Storage conditions Mechanical parameters Code
Size RHb(%) Atmc F
c,max(N)
S(106Hz2 g2/3) Slope (N/mm) F
t,max(N)
4.691.2d
95 Large
L95NC Air 14.192.5e 36.794.5d 21.394.1d
Large 85 ULO
L85ULO 12.692.7d,e 73.399.5f 24.494.4d 11.593.3e
L95ULO Large 95 ULO 24.493.4f 60.7913.1e 33.798.4e 10.794.5e
Small 95 Air 12.092.7d,e 42.196.0d 5.191.0d
S95NC 21.993.7d
26.093.3d 15.893.9f
Small
S85ULO 85 ULO 11.593.0d 87.9911.4g
38.198.3f 14.993.6f
Small
S95ULO 95 ULO 25.892.7f 83.893.4g
aFor each mechanical parameter, means with the same letters are not significantly different (Student–Newman–Keuls test,
PB0.05).
bRH, relative humidity.
cAtm, atmosphere composition; air, normal air composition; ULO, ultra low oxygen:B0.7% CO
Fig. 4. First two PC values of power spectra from 120 apples of different size and storage groups (experiment 2), with indication of the tensile strength (":Ft,maxB6 N;:Ft,max=
6 – 13 N;:Ft,max\13 N). The line indicates the separation
between groups with low (Ft,maxB6 N) and high (Ft,max\13
N) tensile strength by discriminant analysis.
the signals were plotted, more PCs can be used to create a calibration matrix. Generation of a cali-bration matrix, taking the first 15 PCs into ac-count, showed that it was extremely difficult to separate the large from the small apples subjected to the same storage conditions and the 95% RH/ ULO group from the 85% RH/ULO group. Nev-ertheless, prediction of storage conditions resulted, for the training set and validation set, respectively, in only two out of 30 and one out of ten apples from the air group that were erro-neously classified into one of the ULO groups. However, for apples from the ULO groups wrongly classified into the air groups, this amounted to nine out of 60 and eight out of 20, respectively.
Here again the same analysis was carried out on the logarithm of the original power spectra. The first two PCs were clearly the most important ones, explaining together 35% of the total vari-ance, while all other PCs contributed less than 3%. Fig. 5 shows that acoustic emissions from apples stored under air were gathered in the lower half of the PC1 – PC2 space. Sound waves from apples stored under ULO conditions were posi-tioned in the upper half and the two RH humidity groups could not be separated. The separation between the air and ULO groups is in agreement with the results from the sensory evaluation 4 months after harvest. There was no clear distinc-tion between the large and the small apples. Pre-diction of group belonging, using a calibration matrix based on the first 15 PCs, gave much better results for the logarithmic data, than when the original signals were used. Although only 59% of the apples from the training set and 30% of the apples from the validation set were classified in the exact group, theairand ULO groups could be separated quite well. For the training and valida-tion sets, respectively, only one out of 30 and one out of ten apples from the air group were classified into one of the ULO groups, while three out of 60 and four out of 20 apples belonging to ULO groups were wrongly put into the air
groups. This is a far better result than could be obtained by the use of mechanical parameters, such as compressive or tensile strength, for group separation. When a normal distribution is as-Fig. 5. First two PC values for the logarithm of the power
spectra from apples of different size and storage groups (ex-periment 2) (+: large, 95% RH/air; ×: small, 95% RH/air; : large, 85% RH/ULO;: small, 85% RH/ULO;: large, 95% RH/ULO;: small, 95% RH/ULO). There are 20 apples in each group, and the boxes indicate spectra attributed to ULO and air stored apples as determined by discriminant analysis.
emission of chewing sounds. Harker et al. (1997b, 1998) also assumed that results from tensile stud-ies are more closely related to biting and chewing of food. A tensile test might therefore be a better mechanical test for crispness judgement than com-pressive testing.
sumed forFt,max the distributions of, for instance, L95air and L95ULO show a large overlap. For the two groups mentioned, 16 of the 40 apples could be categorized in either group based on theirFt,max.
The results illustrate that the higher frequencies of the sound waves above 2500 Hz also contain valuable information. When the original signals are evaluated, the importance of those high fre-quencies can be underestimated. By taking the logarithm of the frequency spectra, more informa-tion can be obtained.
Therefore PCA appears to be a promising tech-nique to objectively distinguish different crispness groups in ‘Cox’s Orange Pippin’ apples. Once a calibration matrix is generated from power spec-tra of apples belonging to known crispness groups, the crispness of independent apples can be estimated. The technique is more related to sen-sory evaluation than mechanical tests, since crisp-ness has been described as an auditory (Vickers and Bourne, 1976) or vibratory (Christensen and Vickers, 1981) sensation. Although it is less direct than sensory crispness evaluation by a trained analytical panel, it will be less expensive (less people needed for evaluation) and more objective (the subjects do not have to judge the crispness themselves, but the sounds they produce are ex-ported to the analysis software and interpreted). Other experiments on dry-crisp snacks (unpub-lished data) have indicated that, since different people produce different chewing sounds, the sys-tem will have to be trained separately for all possible ‘chewers’. However, once the system is calibrated for another person, his chewing sounds can be used successfully for crispness evaluation. One of the disadvantages compared to a trained panel, is that a panel can at the same time judge much more textural or taste attributes than crisp-ness alone.
To obtain a system that is valid for all possible apple crispnesses, a larger number of apples of varying crispness should be used to create the calibration matrix. Also, further experiments will have to show if similar results can be obtained for other apple cultivars. One of the problems will be, however, that there is no real objective crispness measurement to which the power spectra can be
related. With more extensive experiments, includ-ing comparison with sensory scores, this tech-nique could evolve into an objective measure for crispness evaluation.
Acknowledgements
Dr Nele De Belie is a postdoctoral fellow of the Fund for Scientific Research, Flanders (FWO) and wishes to thank the FWO for the support.
References
Al Chakra, W., Allaf, K., Jemai, A.B., 1996. Characterization of brittle food products: application of the acoustical emis-sion method. J. Texture Stud. 27, 327 – 348.
Barrett, A.H., Cardello, A.V., Lesher, L.L., Taub, I.A., 1994. Cellularity, mechanical failure and textural perception of corn meal extrudates. J. Texture Stud. 25, 77.
Chen, H., 1993. Analysis on the acoustic impulse resonance of apples for nondestructive estimation of fruit quality. Ph.D. Thesis, KULeuven, Belgium.
Chen, H., De Baerdemaeker, J., Vervaeke, F., 1992. Acoustic impulse response of apples for monitoring texture changes after harvest. Proc. Int. Conf. Agr. Eng., October 1992, Beijing, China.
Christensen, C.M., Vickers, Z.M., 1981. Relationships of chewing sounds to judgments of food crispness. J. Food Sci. 46, 574.
Cooke, J.R., Rand, R.H., 1973. A mathematical study of resonance in intact fruits and vegetables using a 3-media elastic sphere model. J. Ag. Eng. 18, 141 – 157.
Dacremont, C., 1995. Spectral compostion of eating sounds generated by crispy, crunchy and crackly foods. J. Texture Stud. 26, 27 – 43.
Dacremont, C., Colas, B., Sauvageot, F., 1991. Contributtion of air- and bone-conduction to the creation of sounds perceived during sensory evaluation of foods. J. Texture Stud. 22, 443 – 456.
De Baerdemaeker, J., 1989. The use of mechanical resonance measurements to determine fruit texture. Acta Hort. 258, 331 – 339.
De Belie, N., Harker, F.R., De Baerdemaeker, J., 1999. Anal-ysis of chewing sounds as a measure of apple crispness. Internal report, pp. 16.
Drake, B.K., 1963. Food crushing sounds. An introductory study. J. Food Sci. 28, 233 – 241.
Drake, B., 1965. Food crushing sounds: comparisons of objec-tive and subjecobjec-tive data. J. Food Sci. 30, 556.
Harker, F.R., Hallett, I.C., 1992. Physiological changes associ-ated with development of mealiness of apple fruit during cool storage. HortScience 27, 1291 – 1294.
Harker, F.R., Hallett, I.C., Jackson, P.J., Gunson, F.A., Mc-Dermott, S., Murray, S., 1997a. Firmness and texture measurement in apples. Mt Albert Research Centre, HortResearch, Internal report, pp. 18.
Harker, F.R., Redgwell, R.J., Hallett, I.C., Murray, S.H., Carter, G., 1997b. Texture of fresh fruit. Hort. Rev. 20, 121 – 224.
Harker, F.R., Stec, M.G.H., Hallett, I.C., Bennett, C.L., 1997c. Texture of parenchymatous plant tissue: a compari-son between tensile and other instrumental and sensory measurements of tissue strength and juiciness. Postharvest Biol. Technol. 11, 63 – 72.
Harker, F.R., Hallett, I.C., Murray, H.M., Carter, G., 1998. Food-mouth interactions: towards a better understanding of fruit texture. Acta Hort. 464, 461 – 466.
Johnson, R.A., Wichern, D.W., 1998. Applied Multivariate Statistical Analysis. Prentice – Hall, Upper Saddle River, NJ.
Kapur, K., 1971. Frequency spectrographic analysis of bone conducted chewing sounds in persons with natural and artificial dentitions. J. Texture Stud. 2, 50.
Lee III, W.E., Deibel, A.E., Glembin, C.T., Munday, E.G., 1988. Analysis of food crushing sounds during mastication: frequency – time studies. J. Texture Stud. 19, 27 – 38. Lee III, W.E, Schweitzer, M.A., Morgan, G.M., Shepherd,
D.C., 1990. Analysis of food crushing sound during masti-cation: total sound level studies. J. Texture Stud. 21, 165 – 178.
Reeve, R.M., 1970. Relationships of histological structure to
texture of fresh and processed fruit and vegetables. J. Texture Stud. 1, 247.
Seymour, S.K., Hamann, D.D., 1988. Crispness and crunchi-ness of selected low moisture foods. J. Texture Stud. 19, 79 – 95.
Tesch, R., Normand, M.D., Peleg, M., 1995. On the apparent fractal dimension of sound bursts in acoustic signatures of two crunchy foods. J. Texture Stud. 26, 685.
Verlinden, B.E., De Baerdemaeker, J., 1994. Development and testing of a tensile method for measuring the mechanical properties of carrot tissue during cooking. XII CIGR World Congr. AgEng ‘94 Conf. on Agr. Eng., Milaan, 29 August – 1 September 1994. Report No. 94-G-055. Vickers, Z., 1981. Relationships of chewing sounds to
judg-ments of crispness, crunchiness and hardness. J. Food Sci. 47, 121 – 124.
Vickers, Z., 1983. Crackliness: relationships of auditory judg-ments to tactile judgjudg-ments and instrumental acoustical measurements. J. Texture Stud. 15, 49 – 58.
Vickers, Z., 1984. Crispness and crunchiness — a difference in pitch? J. Texture Stud. 15, 157 – 163.
Vickers, Z., 1985. The relationships of pitch, loudness and eating technique to judgments of the crispness and crunch-iness of food sounds. J. Texture Stud. 16, 85 – 95. Vickers, Z., 1986. Crispness of cereals. Adv. Cereal Sci.
Tech-nol. 9, 1 – 19.
Vickers, Z., 1987. Sensory, acoustical and force – deformation measurements of potato chips crispness. J. Food Sci. 52, 138 – 140.
Vickers, Z., 1991. Sound perception and food quality. J. Food Quality 14, 87 – 96.
Vickers, Z.M., Bourne, M.C., 1976. A psychacoustical theory of crispness. J. Food Sci. 41, 1158 – 1164.