1
This document
can be found at
http://www.crc.uri.edu/. For more information contact:
Coastal Resources Center
University of Rhode Island Narragansett Bay Campus South Ferry Road
Narragansett, Rhode Island 02882, USA Tel: (401) 874-6224
Fax: (401) 874-6920
Email: balanpril 2011[email protected]
A
Analyzing Changes in Population, Health,
and Environmental Perceptions and
Behaviors in the Saadani National Park
Area, Tanzania
Elin Torell and Catherine McNally
2
This document can be found at http://www.crc.uri.edu/. For more information contact:
Coastal Resources Center
University of Rhode Island Narragansett Bay Campus South Ferry Road
Narragansett, Rhode Island 02882, USA Tel: (401) 874-6224
Fax: (401) 874-6920
Email: [email protected]
July 2013. Coastal Resources Center, University of Rhode Island Citation:
Torell, E. and McNally C. 2013. Analyzing Changes in Population, Health, and Environmental Perceptions and Behaviors in the Saadani National Park Area, Tanzania. Coastal Resources Center, University of Rhode Island. P40.
Disclaimer:
“This document is made possible by the generous support of the American people through the United States Agency for International Development (USAID). The contents are the responsibility of the Coastal Resources Center at the University of Rhode Island as part of the Building Actors and Leaders for Advancing Excellence in Community Development (BALANCED) Project and do not necessarily reflect the views of the United States Government. This document is funded under Cooperative Agreement No. (GPO-A-00-08-00002-00).” Funding for the research presented in this report also came from the Conservation of Coastal Eco-Systems in Tanzania: The PWANI Project. Cooperative Agreement No. 621-A-00-10-00012-00.
Captions, cover photos: Top, Woman being interviewed in the Saadani National park area; man being interviewed.
3
Table of Contents
List of Figures ... 4
List of Tables ... 4
List of acronyms ... 5
Executive Summary ... 6
1 Introduction ... 9
1.1 Implementing PHE in Tanzania ... 10
1.2 The BALANCED approach in SANAPA ... 12
1.3 The Pwani Project’s Activities in the SANAPA area ... 14
1.4 Assessing Behavior Change and Project Impacts ... 15
2 Survey Methods for the 2009 and 2012 Behavior Monitoring Surveys ... 15
2.1.1 Survey Instrument ... 15
2.1.2 Survey Areas ... 16
2.1.3 Data Collection Methods ... 17
2.1.4 Data Processing and Analysis ... 18
2.1.5 Grouping of respondents into participants and non-participants ... 19
3 Overview of Results ... 20
3.1 Demographic and Socio-economic Profile ... 20
3.1.1 Livelihoods and Quality of Life Indicators ... 21
3.1.2 Status of Natural Resources ... 23
3.2 Public Health ... 23
3.2.1 Reproductive Health Situation and Practices ... 23
3.2.2 HIV/AIDS ... 27
3.2.3 Voluntary Counseling and Testing ... 29
3.2.4 Condom Use... 30
3.2.5 Transactional Sex ... 32
3.3 Biodiversity Conservation Awareness and Empowerment ... 32
3.4 Awareness of Population-Health-Environment (PHE) Linkages ... 35
4 Discussion and Recommendations ... 37
4 List of Figures
Figure 1 The Saadani National Park PHE framework and associated interventions ... 12
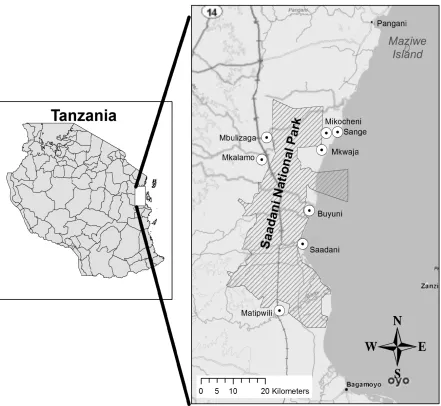
Figure 2. Map of SANAPA and villages surveyed ... 17
List of Tables Table 1. Respondents participating in project activities ... 19
Table 2. Marital Status % (n) for Women and Men in the 2009 and 2012 Project and Control Villages ... 20
Table 3. Perception of Poverty ... 21
Table 4. Perceptions of Poverty (Ability to Meet Daily Needs) for Project and Non-project Participants in 2012 ... 22
Table 5. Standard of Living Related Variables Comparing 2009 and 2012 ... 22
Table 6. 2009 and 2012 Opinion Statements About the Status of Natural Resources ... 23
Table 7. Number of Children vs. Ideal Number of Children by Gender ... 24
Table 8. Contraceptives Used by Survey Respondents and Their Spouses in 2012 ... 25
Table 9. Project and Non-Project Participants who did not Use any Birth Control in 2012 ... 25
Table 10. Locations where Survey Respondents and their Spouses/Steady Partners Received Contraceptives ... 26
Table 11. Percent Agreement* with Reproductive Health Attitude Statements in 2009 and 2012 by Gender ... 27
Table 12. World Health Organization HIV Knowledge Items Answered Correctly by Gender in 2009 and 2012 ... 28
Table 13. The Percentage of Male and Female Respondents Answering Zero to All of the WHO HIV Knowledge Items Correctly in 2009 and 2012. ... 28
Table 14. HIV Testing Stage ... 29
Table 15. Percent Change of Female and Male Respondents in each Collapsed HIV Testing Stage for Project and Control Villages from 2009 to 2012 ... 30
Table 16. Condom use among respondents in 2009 and 2012 with spouse or steady partner ... 31
Table 17. Percent Change of Female and Male Respondents in each Collapsed Condom Use Stage for Project and Control Villages from 2009 to 2012 ... 32
Table 18. Women and Men Admitting to Transactional Sex ... 32
Table 19. Awareness of Natural Resource Management in 2009 and 2012 by Village and Gender ... 33
Table 20. Percentage of 2009 and 2012 Respondents who Agreed with Opinion Statements Related to Environment and Empowerment ... 34
Table 21. Percentage of 2009 and 2012 Respondents who Agreed with Opinion Statements Related to the Links between Population and Environment ... 36
5 List of acronyms
ADDO: Accredited Drug Outlet
BALANCED: Building Actors and Leaders for Advancing Community Excellence in Development
BCC: Behavior Change Communication BMS: Behavior Monitoring Baseline CBD: Community-Based Distributor CRC Coastal Resources Center
CFM: Community-Based Fisheries Management
FP Family Planning
FP/RH: Family Planning and Reproductive Health IEC: Information, Education and Communication MOH: Ministry Of Health
NBS: National Bureau of Statistics NRM: Natural Resource Management PE: Peer Educator
PHE: Population, Health, Environment PLWA: People Living With AIDS
SACCOS: Savings and Credit Cooperative Societies SANAPA: The Saadani National Park
TACAIDS: Tanzania Commission for AIDS TFD: Theater for Development
URI University of Rhode Island
USAID: United States Agency for International Development VCT: Voluntary Counseling and Testing
6 Executive Summary
The Saadani National Park (SANAPA) is the only terrestrial park in Tanzania with a contiguous marine area. SANAPA has the largest marine no-take reserve in the country, yet little is known about its marine ecosystem and its nesting ground for several endangered species of marine turtles. The land and seascape within and around the park include estuaries, mangrove forests, beaches, coral reefs, sea grass beds, coastal forests and rare and endangered wildlife species, including dugongs. The park and its surroundings face many threats to its biodiversity and challenges to sustainable development. These threats and challenges include serious overfishing, destructive practices such as clear-cutting of mangrove forests, and a deterioration in water quality from industrial and municipal waste and farming runoff.
The average number of children per women in Tanzania is 5.6. Combined with a large number of youth entering reproductive ages, early sexual initiation, early forced marriages and in-migration, this growing population puts increasing pressure on the environment. In SANAPA, households are dependent on fish, mangroves, farm land and other natural resources for their food and livelihoods, and when the population becomes too large, there is simply not enough water, forests, land and other basic resources to sustain the population. Making the linkages between population, health and environment (PHE) clearer for people makes sense because providing family planning and reproductive health (FP/RH) for couples who want it can reduce the pressure on natural resources at the same time as it can help empower women to exercise their right to good health care.
In order to address these complex challenges, the United States Agency for International Development (USAID)-funded “Building Actors and Leaders for Advancing Community Excellence in Development” (BALANCED) Project started working in the SANAPA area in 2009. The BALANCED Project collaborated with an ongoing integrated coastal management initiative to develop and deliver integrated PHE messages through peer educators (PEs) and community-based distributers (CBDs) of FP commodities.
At the start of the activities in Tanzania, the project undertook a behavior monitoring survey (BMS) to map out attitudes and behaviors related to reproductive health, poverty, food security, climate change awareness, HIV/AIDS-related behaviors and coastal resources management. The goal of the 2009 BMS baseline survey was to understand the context for PHE in the SANAPA area and to inform the design of an integrated PHE intervention. The data informed the project design and the BALANCED project built the capacity of CBDs and PEs to disseminate PHE messages, increase awareness and use of FP/RH services and promote healthy behaviors among the target communities.
7
The demographic and reproductive health profiles were very similar between the two years—and overall there have been no drastic changes in behaviors and perceptions. Illustrative positive trends from the survey include:
• There is an increased awareness of the benefits of planning your family. The perception changes among the community members indicate that the BALANCED Project has succeeded in conveying PHE messages about planning family size. Fewer men and women agree that large families are better off and that if you have children, you will find the resources to raise them.
• Trained CBDs provide commodities to 31% of all pill users and 21% of all condom users. By making pills available in each village and reducing the distance to access pills from an average of 7.8 kilometers to less than 500 meters, the CBDs have filled an unmet need. Since almost a third of all pill users that obtain their commodities from the CBDs, there is obviously a demand for their services.
• Men have become more positive towards and involved in family planning. An
important finding from focus group interviews is that counseling couples together as well as separately has contributed to changing men’s attitudes towards FP. Even though some men still disapprove of FP and some women still use contraceptives in secret, it is encouraging that men have become more involved in planning families.
• The respondents have become more aware of the linkages between population and environment. The integrated messages provided by the BALANCED project trained CBDs and PEs have likely contributed to increasing people’s understanding of the linkages between population and the environment. People involved in livelihood and environmental conservation activities scored better than non-project participants on the PHE linkage questions.
• People have become more empowered to participate in conservation activities. The results indicate men have become more aware of natural resource management (NRM) activities and that both men and women feel more empowered to participate in
conservation activities. Future programs can build on these trends by expanding the ongoing work with village leadership coalitions and gender strengthening to include natural resources management objectives.
8
In conclusion, the BALANCED Project recommends the following actions for future PHE projects and activities:
1. When designing BCC activities, start by assessing the root causes to the issues and address these in all communications activities.
2. Create spaces where people are comfortable discussing PHE-related issues. Adult and youth PEs are effective because they are non-threatening and can speak easily with their fellow community members.
3. Cross train PEs and CBDs in multiple areas, in order to create integrated champions and role models that become “living examples” of integrated PHE.
9 1 Introduction
Rich in biodiversity, livelihood opportunities and other amenities, coastal areas are home to a disproportionate number of people. Coastal communities rely on the productivity and diversity of ocean and coastal areas for their sustenance. Climate change, natural disasters and ecosystem changes driven by human activities exacerbate serious threats to human health, food security and sustainable development in many coastal areas. As populations grow, these resources are likely to become more and more stressed (Cincotta et al. 2000; Cinner et al. 2009; National Academy of Sciences 2008; Oglethorpe et al. 2008). Further, in many communities surrounding areas of biodiversity, FP needs are highly unmet and access to health services is poor (Oglethorpe et al. 2008). These are complicated problems that need immediate, integrated solutions.
Population, health, environment (PHE) is a development approach that addresses the complex inter-relationships between population, environment and economic system dynamics to improve the well-being of people who depend on the environment for food, income and other goods and services. Complicated environmental and public health problems are increasingly relying on trans-disciplinary thinking (Leischow, Best et al., 2008; Mabry et al., 2008) to illuminate
components and interactions, and importantly, to identify potential intervention points. PHE aims to simultaneously improve communities’ access to FP/RH/ services, while improving natural resources management in ways that improve livelihoods and conserve the critical ecosystems upon which humans depend (Pielemeier et al. 2007). These linked activities develop synergies across interventions that lead to greater outcomes than if they had been implemented in isolation (D'Agnes et al. 2010; Pielemeier et al. 2007). For example, an indirect positive benefit of the PHE approach has shown to be increased gender equity in natural resource management (D'Agnes et al. 2005).
PHE projects offer a wide array of services, including integrated policy development, capacity building, implementation of community-based conservation plans, improved access to
healthcare, and economic development—actions selected to match local needs and capabilities. Another important aspect of PHE is promoting health seeking and pro-environment behaviors on an individual level. This is done through a behavior change communication (BCC) intervention that typically includes integrated conservation, livelihoods, health, and family planning
information, education and communication (IEC) messages and activities. As each place is unique, the IEC materials must be tailored to the community context—and to the perceived barriers to changing behaviors. Another integral component of a PHE BCC intervention is a peer education system. Adult and youth peer educators (PEs) who are usually fisher folk, farmers, housewives, women traders, youth, and/or community leaders spread these integrated messages in their communities. They talk to men, women and youth about environment and family planning, refer them to community-based distribution outlets or government health services for family planning supplies and provide the support needed to make and sustain behavior change. This peer education system allows men and youth to play an active role in family planning, in addition to their more traditional focus on environment or livelihood activities.
10
Similar to adding livelihood components to coastal conservation programs, which has shown to increase the success of coastal management interventions (Christie et al. 2005; Pollnac et al. 2001; Pomeroy et al. 2005; Salafsky et al. 2001), it is hypothesized that PHE can increase the likelihood that a conservation activity is successful and sustainable.
1.1 Implementing PHE in Tanzania
The Saadani National Park (SANAPA) is the only terrestrial park in Tanzania with a contiguous marine area. The park is the nesting ground for several endangered species of marine turtles. SANAPA has the largest marine no-take reserve in the country, yet, little is known about its marine ecosystem and there is no marine management plan. The land and seascape within and around the park include estuaries, mangrove forests, beaches, coral reefs, sea-grass beds, coastal forests and rare and endangered wildlife species, including dugongs. The landscape has changed considerably in the past 10 years as a result of increased private-sector investments and
development along the beachfronts, growing national and international tourism and new agro-industry development. The park and its surroundings face many threats to their biodiversity assets and challenges to their sustainable development. These threats and challenges include but are not limited to serious overfishing, destructive practices such as clear-cutting of mangrove forests and a deterioration in water quality from industrial and municipal waste farming runoff. For the men, women and children living around SANAPA, many interconnected pressures challenge them daily. First and foremost, while their livelihoods are highly dependent on natural resources and several of the villages are almost totally dependent on a single livelihood—fishing or farming—both agriculture and fisheries are suffering from a decline in productivity and profitability, due to over harvesting and climate change (Torell et al. 2012). This puts villagers at risk for even greater poverty and food insecurity. Women face additional disadvantages. They often have little or no education, and they lack a voice in household and community decision-making and finances because of social, cultural and religious beliefs. And, despite having the primary responsibility for rearing children and ensuring sufficient resources to meet family needs, women’s livelihoods are limited, and few have access to monetary income. Further, poor access to modern contraceptives—and the lack of communication between partners about when and how to prevent pregnancies—restricts women’s choices about when to bear children. This contributes to the high lifetime fertility rate (5.6 children) among Tanzanian women. In
Tanzania, women are also hardest hit by the HIV/AIDS pandemic and by climate change impacts (Torell et al. 2012).
11
In SANAPA, poor access to clean water and safe sanitation leads to high instances of diarrhea. Many villagers also suffer from malaria, pneumonia and skin diseases. Meanwhile, HIV and other sexually transmitted infections are spread through unprotected sex, gang rape, transactional sex (including fishermen demanding sex from fish mongers in return for selling their fish), partner swapping, inter-generational sex, polygamy and short-term marriages between fishermen and local women.
The SANAPA communities have limited access to public health facilities. Matipwili, Saadani, Mkalamo and Mkwaja villages have health centers, or dispensaries, where women can access free FP commodities (pills, condoms and injectable products) and vaccines for children, and where people with simple ailments can consult with dispensary staff. The Sange village has a first aid station, but lacks regular staff or a reliable supply of medicines. According to Pangani District statistics, between 70-80% of those living in the Mkwaja and Mkalamo ward have more than a five-kilometer walk to the closest dispensary. The closest hospitals are in Pangani and Bagamoyo towns, which are situated between 36 and 133 kilometers from the village centers. To get to the Pangani hospital, the villagers must cross the Pangani River by boat or ferry,
something that can be a financial deterrent to making hospital visits. The district lacks a medical doctor, and its hospitals and dispensaries are understaffed (Pangani District Council 2009). In 2009 the USAID-funded BALANCED Project started working in the SANAPA area. The goal was to collaborate with an ongoing integrated coastal-management initiative to develop and deliver integrated PHE messages through trained PEs and MOH CBDs. The BALANCED Project added the “P” (rights-based access to RH information and FP) to an already ongoing health and environment initiative that included conservation, spatial planning, conservation-based livelihood development, energy-saving technologies, water and sanitation and HIV/AIDS prevention.
Before adding RH/FP to the ongoing conservation program, the BALANCED Project undertook a behavior monitoring baseline (BMS) to map out attitudes and behaviors related to RH, poverty, food security, climate change awareness, HIV/AIDS-related behaviors and coastal resources management. The end goal of the 2009 survey was to understand the context for PHE in the SANAPA area, inform the design of an integrated PHE intervention that was appropriate for the community and to create a more robust and relevant approach to monitoring progress. An outcome of the BMS was a systems diagram, which shows the interconnected stressors facing people living around SANAPA—and the package of PHE interventions that were designed to address those stressors (Figure 1).
In 2012, the BALANCED Project undertook a follow-up survey to assess the changes in behaviors and attitudes that have come about as a result of the BALANCED Project
12
Figure 1 The Saadani National Park PHE framework and associated interventions 1.2 The BALANCED approach in SANAPA
The BALANCED Project, which ended its activities in Tanzania in April 2013, strived to implement PHE approach components that:
• Conceptually link and operationally coordinate PHE activities, including developing BCC materials that highlight the connections between biodiversity conservation, fuel wood consumption, climate change, food security and RH/FP behaviors.
• Partner with local government, community leaders and local villagers as entry points for PHE activities and advocate to local authorities and decision-makers to mainstream PHE into local and plans and agendas.
13
• Strengthen local institutions and planning and coordination mechanisms that will continue after donor-funded PHE projects are completed—including building local capacity for long-term resource management by mentoring and empowering community peer educators and district facilitators.
• Foster the formation of local committees, associations and institutional structures with the motivation and self-interest to work together to solve local problems (e.g. community-based saving and credit associations, energy committees, and women’s producer groups). To increase access to FP commodities in the SANAPA villages, the BALANCED Project
expanded the distribution of FP information and products at the grassroots level. Through a system of trained MOH CBDs and adult PEs who are cross-trained in population, health and environment (PHE) linkages, RH/FP and pro-environment behaviors, the project aimed to increase awareness of and expand access to FP information and services in under-served communities.
The BALANCED Project trained 50 FP/RH service delivery points (CBDs)—50 percent of which are men—in six villages surrounding SANAPA. The CBDs reduced the distance to reach FP services from an average of 7.8 kilometers to less than 500 meters. Between 2009 and 2013, the CBDs have serviced over 6,000 clients (including repeat customers). In Tanzania, only MOH-trained CBDs and accredited drug outlets (ADDOs) are allowed to distribute FP methods (oral contraceptives and condoms). Yet, training CBDs using the MOH curriculum can be costly and difficult to sustain. One reason is that MOH regulations stipulate that CBDs must distribute the FP commodities for free. Many CBDs might drop out without a monthly stipend to
compensate them for travel to the dispensary to replenish their stocks and for conducting counseling in their villages. However, this was not the case for the BALANCED Project activities in which 92 percent of the CBDs remained throughout the life of the project.
To improve the chances of sustaining interest over time, the project also trained over 200 PEs, including 30 youth. The PEs—of which half are men—have provided over 20,000 counseling sessions (over 19,000 provided by the adult PEs and 1,600 provided by the youth PEs) to fellow community members. By the end of the project 92 percent of all PEs remained counseling community members. The low dropout rate among CBDs and PEs might also have been the result of cross-training and involving them in more than one activity. A core aspect of the BALANCED PHE project’s work was to integrate conservation and health volunteer responsibilities to deliver integrated messages on how to protect the environment and one’s health. Volunteers working on conservation activities and/or who were members of savings and credit cooperative societies (SACCOS) were trained as PEs and CBDS. Similarly, PEs and CBDs also became members of SACCOS and were involved in conservation activities. As a result of this intervention, most PEs were engaged in multiple PHE-related activities including community- based distribution of FP commodities, SACCOs, medical stores, fuel-efficient technologies, HIV/AIDS prevention and livelihood activities, such as beekeeping. These adult and youth PEs talk with their fellow community members about simple steps they can take to improve their lives. They also advise fellow community members on where to access
14
• By planning their families, women can ensure their own and their children’s health and decide the optimal number of children the household can provide for.
• By using fuel-efficient stoves, women spend less time collecting fire wood and cooking— freeing up time for other chores or livelihoods; and reducing the amount of needed fuel, thus helping sustain the forests for future generations. Fuel-efficient stoves also reduce smoke that causes coughing and red eyes.
• By joining community-led SACCOs, women and men gain access to capital, allowing them to scale-up current livelihoods or diversify to new sources of income.
• Being responsible by using condoms every time one has sex, provides protection against unwanted pregnancies and sexually transmitted infections.
Versions of these messages have also been printed on posters and leaflets, delivered in radio spots, and printed on T-shirts to reinforce the messages being provided by the PEs.
1.3 The Pwani Project’s Activities in the SANAPA area
The integrated messages delivered by the BALANCED Project volunteers were nested within and complemented the activities implemented by the “Conservation of Coastal Eco-Systems in Tanzania: The PWANI Project”— a broad range of activities implemented towards sustaining the flow of environmental goods and services; reversing the trend of environmental destruction of critical coastal habitats; and improving the wellbeing of coastal residents in the SANAPA area. The Pwani Project is funded by USAID Tanzania and implemented by the University of Rhode Island (URI) Coastal Resources Center (CRC) in collaboration with local partners. The Pwani Project has implemented a number of activities, including sea turtle conservation, zoning for small scale mariculture development, energy-saving technologies, climate change adaptation, environmentally friendly livelihoods (e.g. ecotourism), improved access to savings and credit, HIV/AIDS prevention and spatial planning.
15
involving village meetings and more informal methods, including Theater for Development (TFD). Through theater, it is possible to engage a broad spectrum of villagers—including young and old, and men and women—to discuss issues that can be difficult to address in formal
meetings. These include early sex initiation, low condom use, superstitious beliefs and poor leadership. The action plans outline steps to confront the root causes of the spread of HIV. They also include sections that address how to help vulnerable groups, such as orphans, widows, People Living with AIDS (PLWA), the elderly and those physically challenged/disabled. In 2010, UZIKWASA broadened the VMACs to include wider representation of influential village leaders (e.g. businessmen, youth leaders, religious leaders, etc.). A program was implemented to increase leaders’ awareness and commitment and to improve their technical capacity to address HIV/AIDS. This leadership program also included a gender-strengthening component, because gender inequity plays a significant role in the spread of HIV/AIDS and village development at large. To encourage learning, UZIKWASA also launched a best VMAC competition and exchange visits between well-performing and lesser-performing VMACS. 1.4 Assessing Behavior Change and Project Impacts
As described above, the BALANCED and Pwani projects undertook two surveys: in 2009 to set a baseline and design project interventions; and in 2012 to measure the impacts of the PHE activities. This report analyses the two data sets and explores four questions:
1. To what extent and how has the status of population, socio-economic, health, and environmental conditions changed in the Saadani National Park Area between 2009 and 2012?
2. Are there any changes in perceptions and/or behaviors that can be attributed to project interventions?
3. Based on the experience from implementing integrated PHE in the Saadani National Park area, what are the recommendations for future projects?
The following section describes the survey methods used in 2009 and 2012. Thereafter, the survey results are presented, followed by conclusions and recommendations.
2 Survey Methods for the 2009 and 2012 Behavior Monitoring Surveys
This study considered a cross-sectional design using quantitative methods and face-to-face interviews of sample respondents. Data from the surveys were triangulated with data from previous surveys conducted in the area and qualitative information from other sources (focus group discussions and key informant interviews with, for example, local government leaders). All survey procedures were approved for human subjects concerns by the URI Internal Review Board.
2.1.1 Survey Instrument
16
Behavior Monitoring Surveys” (Torell et al. 2013). The first survey was pre-tested in the Bagamoyo District by individuals with prior survey experience. The instrument was finalized, based on pre-test findings, and contained socio-demographic, health, coastal conservation and climate change-related questions as well as opinion questions on PHE linkages. The second survey was not pretested because it was almost identical to the first survey.
2.1.2 Survey Areas
The questionnaires were administered in eight villages surrounding the Saadani National Park, Tanzania. There are 10 villages bordering the park with a total population of approximately 35,000 persons. Eight of the 10 villages were selected to participate in the survey—six in the Pangani District: Sange, Mikocheni, Mkwaja, Buyuni, Mkalamo, and Mbulizaga. Two villages, Saadani and Matipwili, were located just across the border, in the Bagamoyo District (see Figure 2). The six villages in Pangani were selected because they were already engaged in conservation and HIV/AIDS prevention activities implemented through the Sustainable Coastal Communities and Ecosystems Tanzania Project, which was a predecessor to the Pwani Project. There was an interest in adding a FP component to the ongoing health and environment activities in Pangani, creating a full-fledged PHE program. Hence, the six villages in Pangani were considered project villages.
17 Figure 2. Map of SANAPA and villages surveyed
2.1.3 Data Collection Methods
The target respondents for the survey comprised individuals in the reproductive age group (18-49 years). Sixty households were randomly-selected per village, with the goal of interviewing 50 households per village. The enumerators were given a one-day training to discuss the nature, purpose, survey procedures, human subjects’ protections, fieldwork techniques and specific aspects of the study to be carried out by the team. Social preparation (e.g. courtesy calls to local officials) was also conducted by the enumerators and project coordinators to secure permission and support from the local authorities in conducting the survey.
18
random sampling method to get an approximately even number of men, women, young and old household members. In the 2009 survey, the so called Kish method (McBurney 1988) was used. This method randomizes the household selection and the selection of the subjects from within a household. This method proved to be impractical; it resulted in numerous visits to households where the randomly selected household member could not be interviewed, as they were not home. In the 2012 survey, we developed a simplified sampling method: households were still randomly selected, but the methodology allowed more flexibility in selecting the person to interview in each household. For example, if an enumerator had been assigned to interview a young woman in a household but only a young man was at home, the enumerator could interview the young man and target a young woman at the next household. The enumerators followed a predefined procedure in instances where the randomly selected household members could either not be located or did not fit the sample requirements (i.e., age outside of 18-49). The enumerators were instructed that if they arrived at the randomly selected household and no one was home (and not close nearby in the village) that a new household should be selected using the following approach: if the household originally on the list was on the north side of the street, flip a coin to determine if you visit the house to the left (west) or right (east) of the original house. If the flipped coin lands on heads, visit the house to the left. If the flipped coin lands on tails, visit the house to the right. In each case, the enumerators noted which household was selected. For both surveys, after the interviewer identified the respondent in the household, the interview proper was performed. Informed consent was secured prior to conducting the surveys and 100% of potential participants agreed to participate. All respondents were interviewed in Swahili, and their answers were recorded on the questionnaire during the interview. In total, 437 individuals were interviewed in 2009 (235 females, 202 males)1 and 410 individuals (201 females, 207 males)2 in 2012. On average, it took between 45 to 60 minutes to complete the surveys.
In 2012, seven key informant interviews were conducted with individuals that have participated in two or three integrated activities using a semi-structured interview questionnaire. The
individuals interviewed were all from project villages the Pangani District and included CBDs, PEs, SACCOS members and those that participate in beekeeping and using fuel-efficient technologies for baking and cooking.
2.1.4 Data Processing and Analysis
The completed questionnaires were reviewed by the interviewers while they were still in the field to ensure that all questions were properly filled in. They also coded the responses using the coding instruction as their guide. Responses in Swahili were translated to English. After the editing and coding process, the questionnaires were then submitted to the research team for further check for accuracy and completeness. Survey data were checked for consistency and validity prior to analysis.
1 The total number of females in the project and control villages in 2009 was 177 and 58, respectively. For men it was 148 and 54, respectively.
2
19
Descriptive and inferential statistics were generated using SPSS version 19.0. For categorical variables, frequency and percent distributions were presented. For continuous variables (such as age), summary statistics, such as means and standard deviation, were presented. Chi-square (χ2) goodness of fit tests were used to compare the frequency of dependent categorical variable responses (e.g., type of birth control used, HIV testing stage, level of agreement with opinion statements, etc.) for males and females in project and control villages in 2009 and 2012. Chi-square tests for independence were employed to examine the relationships between categorical variables (e.g., survey year and perception of poverty). All analyses were two-tailed, and p-values of 0.05 or less were considered significant.
2.1.5 Grouping of Respondents into Participants and Non-participants
As explained in section 2.1.2, it was appropriate to compare data from project and control
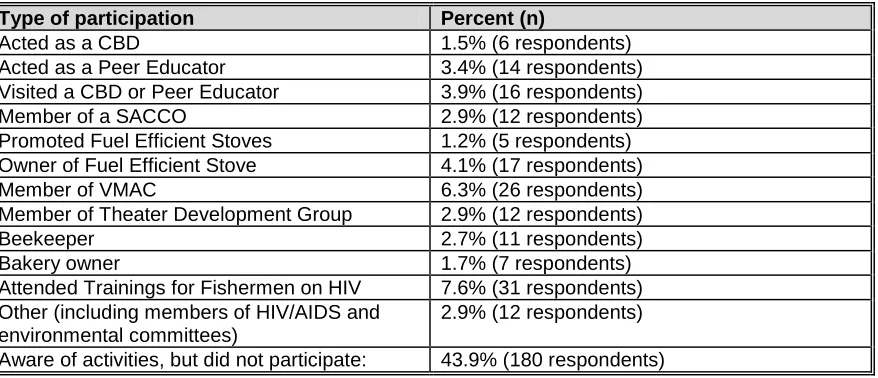
villages only for the questions related to HIV/AIDS. For some questions, we therefore decided to compare the 2012 responses of the respondents (in both project and control villages) who had participated in project activities with those that had not. Out of the 437 respondents, 120 had participated actively in at least one type of population, health and/or environment activity (see Table 1), and 180 individuals were aware of project activities even though they had not participated actively in any of them. The majority of the respondents surveyed participated in one activity, but there were some individuals who participated in numerous activities.
Table 1. Respondents Participating in Project Activities
Type of participation Percent (n)
Acted as a CBD 1.5% (6 respondents)
Acted as a Peer Educator 3.4% (14 respondents)
Visited a CBD or Peer Educator 3.9% (16 respondents)
Member of a SACCO 2.9% (12 respondents)
Promoted Fuel Efficient Stoves 1.2% (5 respondents) Owner of Fuel Efficient Stove 4.1% (17 respondents)
Member of VMAC 6.3% (26 respondents)
Member of Theater Development Group 2.9% (12 respondents)
Beekeeper 2.7% (11 respondents)
Bakery owner 1.7% (7 respondents)
Attended Trainings for Fishermen on HIV 7.6% (31 respondents) Other (including members of HIV/AIDS and
environmental committees)
2.9% (12 respondents)
Aware of activities, but did not participate: 43.9% (180 respondents)
For a small part of the survey analysis, the project participants were divided into two groups. The Population/Health group comprised those respondents who participated as PEs, CBDs, those visiting PEs or CBDs, VMAC member, theater development group member, attendee of HIV trainings or other activities that were related to population and health. The
20 3 Overview of Results
3.1 Demographic and Socio-economic Profile
A total of 437 respondents (54% women) from eight villages (five coastal and three inland) were surveyed in June 2009. In 2012, we interviewed 410 individuals (49% women) in the same villages. The average age of the respondents was 31 years in 2009 and 33 years in 2012. Hence, the 2012 respondents were slightly older than those interviewed in 2009, but the difference is not statistically significant.
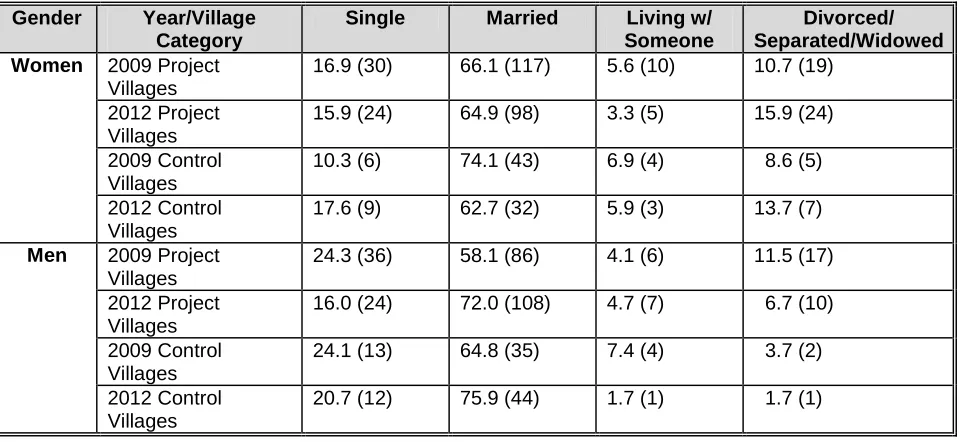
In the 2009 survey, almost 65% of the respondents were married or living with someone. In 2012, 76% of those interviewed were married or living with someone (Table 2).
Table 2. Marital Status % (n) for Women and Men in the 2009 and 2012 Project and Control Villages3 Women 2009 Project
Villages
In Tanzania, public education is provided until seventh grade and consistent with that, almost 75% of the respondents reported completing at least a seventh-grade education. However, more women (27% in 2009 and 22% in 2012) than men (10% in 2009 and 15% in 2012) reported no education at all (p < .05). This is similar to the national average, where reportedly 20% of women and 10% of men have no education (NBS and Macro International Inc. 2009). The average household size was basically the same between the two years (4.9 individuals in 2009 and 4.95 individuals in 2012). The households had an average of 2.2 adults (2009) and 2.69 adults (2012) respectively between the ages of 18 and 49 years. The demographic characteristics of the residents were also very similar. In 2009, 52% of the respondents were natives of their respective villages, whereas 46% lived in the villages for more than one year and only seven respondents (1.6%) had lived in the village less than a year. In 2012, the number of native
3
21
residents was 54%, and 44% had lived in the village for more than a year. Only eight respondents (2%) had lived in the village less than one year.
3.1.1 Livelihoods and Quality of Life Indicators
In 2012, about 61% of all respondents reported their main source of income as fisheries, farming, or aquaculture, a drop from 2009, when 67% reported that they were engaged in those
livelihoods. Artisanal fishing is an important economic activity in the coastal villages involving approximately 70-80% of the male population on a full- or part-time basis, but agriculture and small business are the main sources of income for more households.
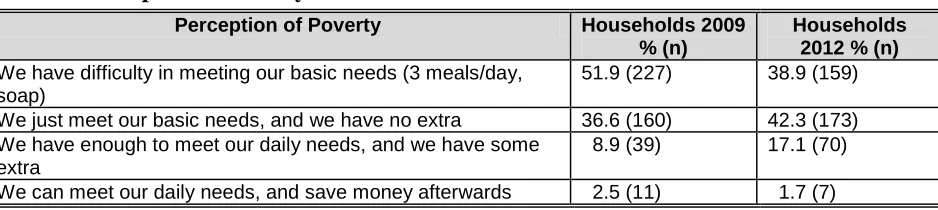
Table 3 indicates that there has been a shift in the perception of poverty between 2009 and 2012. In 2009, just over half of the respondents felt that they had difficulty meeting their basic needs; whereas in 2012, the number had dropped to 39%. The number of households reporting that they have enough to meet their daily needs and have some extra left over also increased.
Table 3. Perception of Poverty4
Perception of Poverty Households 2009
% (n)
Households 2012 % (n) We have difficulty in meeting our basic needs (3 meals/day,
soap)
51.9 (227) 38.9 (159)
We just meet our basic needs, and we have no extra 36.6 (160) 42.3 (173) We have enough to meet our daily needs, and we have some
extra
8.9 (39) 17.1 (70)
We can meet our daily needs, and save money afterwards 2.5 (11) 1.7 (7)
Comparing project participants (those that had been involved in some project activity) with non-participants, found no statistically significant difference between the two groups in 2012 (Table 4). A Chi-Square test for independence indicates no significant association between project/non-project participant and the perception of poverty among men and women in 2012. However, male and female project participants are slightly more likely to save money than non-project participants. This could be because some of the project participants are members of community led savings and credit associations supported by the Pwani Project.
4
A Chi-Square test for independence indicates a significant association between survey year and the perception of
poverty, χ2 (3, n=846) = 21.29, p < 0.0001, phi = .159 (small effect size). A chi-square goodness-of-fit test indicates a significant difference in the ability of 2012 households to meet their daily needs in comparison to the 2009 households
22
Table 4. Perceptions of Poverty (Ability to Meet Daily Needs) for Project and Non-project Participants in 2012
Perception of Poverty Women
% (n)
Men % (n)
Project
Non-Project
Project
Non-Project We have difficulty in meeting our basic needs (3
meals/day, soap)
30.2 (16) 42.6 (63) 44.8 (30) 35.5 (50)
We just meet our basic needs, and we have no extra
50.9 (27) 37.2 (55) 35.8 (24) 47.5 (67)
We have enough to meet our daily needs, and we have some extra
15.1 (8) 19.6 (29) 14.9 (10) 16.3 (23)
We can meet our daily needs, and save money afterwards
3.8 (2) 0.7 (1) 4.5 (3) 0.7 (1)
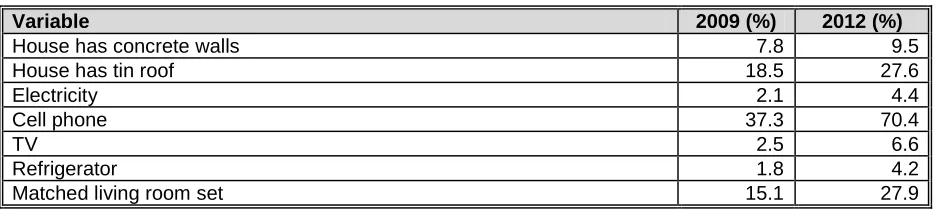
Most respondents live in homes with thatched or mud walls (86.8%) and thatched roofs. Although the standard of living is low, there are some indications that the standard of living improved between 2009 and 2012—corresponding to the finding that more households have a little bit of money left after covering their basic needs. Those households can afford “extras”, such as a matched living room set or a tin roof (Table 5). We saw an increase in all of the
standard of living related variables measured between the two surveys. The most drastic increase was in cellphone ownership, but there is also a marked increase in the number of houses with tin roofs, TVs, and a matched living room sets. This indicates incomes have increased—especially since the inflation rate in Tanzania is relatively high (8.3% in May 2013) and the same amount of money is not going nearly as far in 2012 as in 2009.
Table 5. Standard of Living Related Variables Comparing 2009 and 2012
Variable 2009 (%) 2012 (%)
House has concrete walls 7.8 9.5
House has tin roof 18.5 27.6
Electricity 2.1 4.4
Cell phone 37.3 70.4
TV 2.5 6.6
Refrigerator 1.8 4.2
Matched living room set 15.1 27.9
23 3.1.3 Status of Natural Resources
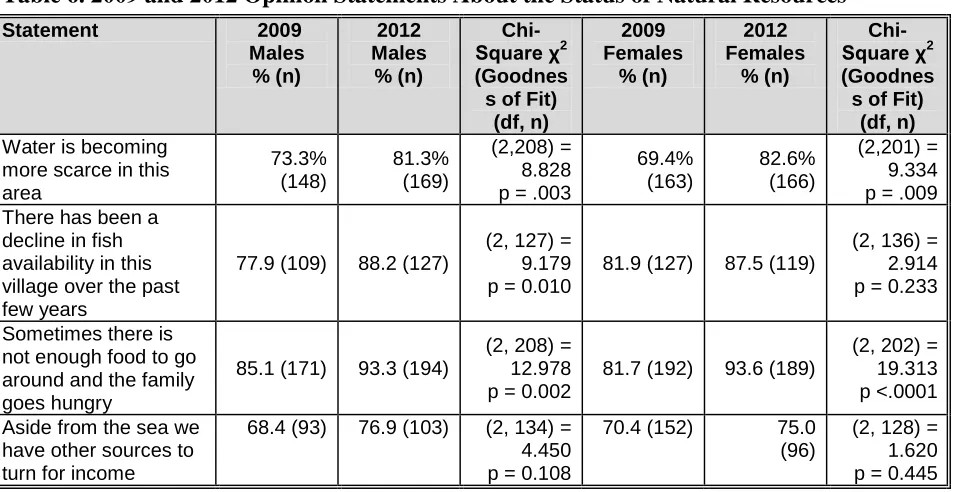
The survey respondents perceived that the status of natural resources has decreased. As shown in Table 7, a majority of men and women perceived that water has become scarcer and that there has been a decline in fish availability in both 2009 and 2012. However, a larger percentage of men and women agreed with both statements in 2012. A chi-square goodness-of-fit test indicates a significant difference in the proportion of men agreeing with the first two statements. For women there is a significant difference in the first statement between 2009 and 2012 (Table 6). This indicates that those living around SANAPA perceive that the status of natural resources has worsened. However, as shown in the last statement, in 2012 more men and women felt that the sea is not their only source of income, indicating that the dependence on marine resources may have gone down. The increased standard of living may perhaps be a result of increased incomes from sources less dependent on natural resources (e.g. tourism and small businesses). This finding corresponds with the fact that fewer respondents reported agriculture, fisheries, and aquaculture as their main source of income in 2012.
Table 6. 2009 and 2012 Opinion Statements About the Status of Natural Resources
Statement 2009
more scarce in this area village over the past few years around and the family goes hungry have other sources to turn for income
3.2.1 Reproductive Health Situation and Practices
More than 96% of survey respondents were sexually active in 2009, but only 68% of women and 60% of men were married or living with someone. In 2012, more than 97% of survey
24
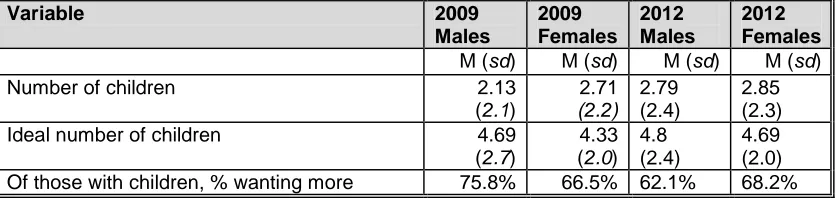
number being 2.79 children for men and 2.85 children for women in 2012 (Table 7). As shown in Table 8, there has been no statistically significant change in the actual number of children per respondent or the perceived ideal number of children between 2009 and 2012. However, the ideal number of children has increased slightly among both men and women. There has been a slight increase among women with children who want more children, whereas the percentage has decreased markedly among men (from almost 76% to 62%).
Table 7. Number of Children vs. Ideal Number of Children by Gender
Variable 2009
Males
2009 Females
2012 Males
2012 Females M (sd) M (sd) M (sd) M (sd)
Number of children 2.13
(2.1)
2.71 (2.2)
2.79 (2.4)
2.85 (2.3)
Ideal number of children 4.69
(2.7)
4.33 (2.0)
4.8 (2.4)
4.69 (2.0) Of those with children, % wanting more 75.8% 66.5% 62.1% 68.2%
Among the 2009 female respondents, 47% indicated that they do not use any modern
contraceptives. In 2012, the number had decreased to 44.8%. Among the 55.2% that reported using one or multiple forms of modern contraceptives in 2012, injections and oral contraceptive pills were the most common, followed by condoms5. Comparing project and control villages in 2012 (Table 8), the only statistically significantly difference between the two is in the “other” category, which for the Project Villages was comprised of the following: implant (92%, n=23); intrauterine device (4%, n=1), and abstinence (4%, n=1). The ‘Other’ Category for the Control Villages was comprised of implants (50%, n=1) and traditional medicines (50%, n=1). As shown in Table 9, although not statistically significant, the number of pill users is higher in the project villages compared to the control villages. This could be an indication that the CBDs are making it easier to access pills in the project villages.
5
25
Table 8. Contraceptives Used by Survey Respondents and Their Spouses in 2012
Type of Birth Control Project
Villages % (n)
Control Villages % (n)
χ2
(Test for Independence)
(df, n)
No birth control 37.6 (74) 41.6 (32) (1,274) = 0.372, p = .542
Traditional methods6
Early Withdrawal 0 (0) 1.3 (1) (1,273) = 2.555, p = .2821
Breast Feeding/Lactation Amenorrhea 0.5 (1) 0 (0) (1,273) = 0.394, p = .9991
Rhythm/Calendar 1.0 (2) 3.9 (3) (1,273) = 2.543, p = .1381
Modern methods
Condoms 9.7 (19) 11.7 (9) (1,273) = 0.239, p = .625
Oral Contraceptive Pills 23.0 (45) 14.3 (11) (1,273) = 2.551, p = .110
Injections/Depo Provera 24.4 (48) 28.9 (22) (1,273) = 0.604, p = .437
Vasectomy/Tubal Ligation 0.5 (1) 1.3 (1) (1,272) = 0.487, p = .4811
Other 12.8 (25) 2.6 (2) (1,272) = 6.277, p = .012
phi = .152 (small effect size)
1
A Fisher’s Exact Probability Test was conducted instead of a Chi-Square test for independence because the lowest expected frequency assumption was violated.
Comparing the contraceptive use among project participants and non-participants in the 2012 survey, found that project participants were more likely to use some sort of birth control than non-participants (Table 9). However, this finding is only indicative, because a Chi-Square test for independence (with Yates Continuity Correction) indicates no significant association between project/non-project participant and use of birth control for men and women.
Table 9. Project and Non-Project Participants who did not Use any Birth Control in 2012
Type of Respondent Women (%, n) Men (%, n) Project Participant 30.3 (10) 30.8 (16) Non Project Participant 50.0 (46) 35.1 (34)
Key informant interviews with individuals involved in project activities indicate that men have become more involved in family planning since the BALANCED project started and that women have more say in whether or not to use a condom or some other form of contraceptive. The key informants stated that having CBDs and adult peer educators who counsel couples together as well as men and women separately have contributed to changing men’s attitudes towards family planning. The key informants also stated that the number of women who use contraceptives in secret gas gone down. Some husbands try to prevent their wives from using birth control because they think that their wives will get diseases or have long-term reduced fertility.
There has been a statistically significant increase in individuals obtaining contraceptives from CBDs between 2009 and 2012 (Table 10). The number obtaining contraceptives from the dispensary has correspondingly gone down. This is likely because individuals are able to obtain pills and condoms from a source closer to their homes. Table 11 shows 13.1% of all survey respondents obtained their contraceptives from CBDs in 2012. However, this percentage includes all who reported using contraceptives, including those not distributed by the CBDs. Looking at only pill and condom users, w the percentage of respondents in project villages receiving condoms and pills from CBDs was 21% and 31%, respectively in 2012.
26
Table 10. Locations where Survey Respondents and their Spouses/Steady Partners Received Contraceptives
Birth Control Supplies/Services
2009 2012
Project Villages % (n)
Control Villages % (n)
Project Villages % (n)
Control Villages % (n)
Dispensary 78.7 (129) 62.5 (30) 71.0 (88) 80.8 (36)
Hospital 10.4 (17) 18.8 (9) 8.9 (11) 13.3 (6)
Small shop/traditional
practitioners 5.5 (9) 12.5 (6) 2.5 (3) 4.5 (2)
CBD 0.0 (0) 0.0 (0) 13.1 (16) 0.0 (0)
Medical store7 3.7 (6) 2.1 (1) 4.1 (5) 6.8 (3)
Other 4.9 (8) 8.3 (4) 8.2 (10) 0.0 (0)
The survey respondents were asked a number of questions related to reproductive health in 2009 and 2012. As outlined in Table 11, there were some changes in perceptions between the two years. For a couple of statements, the perceptions have gotten worse (i.e. the attitude towards family planning has become more negative) whereas for three statements, the perceptions have improved. In both years, there was a high level of awareness among respondents of the dual protection that condom use affords, with a slight increase in 2012. Although not statistically significant there is a positive trend towards accepting that youth should have access to information about sexuality and should be allowed to access family planning services. Supporting this finding, some key informants maintained that people increasingly think that youth should receive information about condom use. They also stated that more people see the health benefits of having one faithful partner. Two of the key informants said that there has been a reduction in the number of teenage pregnancies in the communities as a result of peer
education and other BCC activities
7
27
Table 11. Percent Agreement* with Reproductive Health Attitude Statements in 2009 and 2012 by Gender
*Agree or Strongly Agree
3.2.2 HIV/AIDS
In Tanzania, the HIV prevalence is estimated to be 5.1% percent of individuals between the ages of 15 and 49 (Tanzania Commission for AIDS (TACAIDS) et al. 2013). More women (6.2%) are infected than men (3.8%). Overall, the HIV prevalence has declined in the last years from a national average of 7% in the 2003-2004 HIV indicator survey. The prevalence rate in the Tanga region, which includes Pangani, is 2.4% (Tanzania Commission for AIDS (TACAIDS) et al. 2013).
Almost all the respondents knew about HIV and AIDS, but knowledge about AIDS prevention was less clear in both years. The respondents were asked a number of questions related to HIV/AIDS knowledge. The questions, which are listed in Table 12, were developed by the World Health Organization (WHO). According to the Tanzania 2007-2008 HIV/AIDS and Malaria Indicator Survey, 44.8% of rural women and 41.4% of men in Tanzania have a comprehensive knowledge of HIV—"comprehensive" meaning they answered all five WHO HIV knowledge questions in Table 12 correctly. The survey respondents were less aware than the national average, because in 2012 less than 20% of the men and women correctly answered all the WHO HIV knowledge questions, a reduction from 25% for both men and women in 2009.
Statement 2009 Everyone should have the
right to choose how many children they want and when to have them access to information on sexuality
Teens should NOT have access to
contraceptives even if they are already having sex
protect us from sexual diseases
93.8% (195)
91.1% (184)
28
Table 12. World Health Organization HIV Knowledge Items Answered Correctly by Gender in 2009 and 2012
WHO HIV Knowledge Item Women Men
Having only one faithful partner can protect against HIV
Comparing the 2009 and 2012 answers to the WHO HIV knowledge questions, shows that the knowledge has improved in regards to some questions (e.g. sharing food does not transmit HIV), but has gone down in relation to other questions (e.g. condoms can prevent HIV). A chi-square goodness-of-fit test indicates a significant difference in the proportion of women who correctly answered all five WHO HIV Knowledge Items correctly in 2012 as compared to 2009 χ2.
However, the difference is going in the wrong direction—because fewer women are answered all of the questions correctly in 2012. Among men there is no statistically significant difference between the 2009 and 2012 data. Table 13 compares the percentage of male and female
respondents who answered zero to all of the HIV knowledge items correctly. It shows that there is a statistically significant increase among women and men who got four of the questions correctly, but a decrease in the number who answered all five correctly.
Table 13. The Percentage of Male and Female Respondents Answering Zero to All of the WHO HIV Knowledge Items Correctly in 2009 and 2012.
29 3.2.4 Voluntary Counseling and Testing
Voluntary counseling and testing (VCT) is being provided by dispensaries and hospitals to facilitate behavior change and provide an entry point for care and support services. According to the 2012 survey data, 67.4% of respondents (74.1% of women and 60.9% of men) had been tested for HIV—an increase from 43.2% (48.5% of women and 37.1% of men) in the 2009 survey. This is a significant increase, and it is higher than the national average for rural residents, where in 2011, 64.7% of women and 46.7% of men have ever been tested for HIV (Tanzania Commission for AIDS (TACAIDS) et al. 2013). Of those tested for HIV, most (47.3%) were tested at the dispensary, followed by the Pangani Hospital (20.9%) and Mobile VCT (9.7%). Of the 277 respondents reporting their testing location, 27 reported two testing locations and 3 reported three testing locations.
We also assessed people’s readiness to be tested for HIV, using the stages of behavior change (Prochaska, Redding & Evers, 2008), which proposes five stages of change:
1. Pre-contemplation: those not considering getting tested for HIV within the next six months
2. Contemplation: those thinking about getting tested in the next six months 3. Preparation: those planning to get tested within the next 30 days
4. Action: those who got tested within the past six months 5. Maintenance: those who got tested more than six months ago
As shown in Table 14, we see that many men and women in both project and control sites have moved from pre-contemplation and contemplation to preparation, action, and maintenance. This follows a national trend of increased HIV testing, where nation-wide the testing rate has
increased from 37% of women and 27% of men being tested in 2007 ((National Bureau of Statistics (NBS) [Tanzania] and Macro International Inc. 2009) to 51% of women and 38% of in 2010 (National Bureau of Statistics (Tanzania) and ICF Macro, 2011).
Table 14. HIV Testing Stage
Gender Year/Village Category
Pre-contemplation
% (n)
Contemplation % (n)
Preparation % (n)
Action % (n)
Maintenance % (n)
Women 2009 Project
Villages 30.5 (54) 21.5 (38) 3.4 (6) 26.6 (47) 18.1 (32)
2012 Project
Villages 11.3 (17) 12.0 (18) 2.7 (4) 31.3 (47) 42.7 (64)
2009 Control
Villages 22.4 (13) 13.8 (8) 3.4 (2) 29.3 (17) 31.0 (18)
2012 Control
Villages 11.8 (6) 7.8 (4) 5.9 (3) 41.2 (21) 33.3 (17)
Men 2009 Project
Villages 35.1 (52) 23.0 (34) 4.7 (7) 18.9 (28) 18.2 (27)
2012 Project
Villages 14.8 (22) 22.8 (34) 4.7 (7) 21.5 (32) 36.2 (54)
2009 Control
Villages 38.9 (21) 20.4 (11) 3.7 (2) 22.2 (12) 14.8 (8)
2012 Control
30
Collapsing the five stages to three stages (pre-contemplation=not considering, contemplation and preparation=thinking stage, and action and maintenance=action stage) and comparing the
percentage change in the number of men and women who are in each stage, there is a statistically significant change among all groups, except among control village women. Comparing project and control villages (Table 15), project village women have a greater percentage change than control village women. However, among men there is an opposite trend, where control village men did better than project village men.
Table 15. Percent Change of Female and Male Respondents in each Collapsed HIV Testing Stage for Project and Control Villages from 2009 to 2012
Gender Village Category Not
Considering
Thinking Stage
Action Stage
χ2 (df, n)
Women Project Villages -19.2% -10.2% +29.4% (2,150) =53.446
p<0.0001
Control Villages -10.6% -3.5% +14.2% (2,51) =4.636
p=0.098
Men Project Villages -20.3% -0.2% +20.5% (2,149) =34.418
p<0.0001
Control Villages -26.8% -5.1% +32.0% (2,58) =27.386
p<0.0001
3.2.5 Condom Use
Condoms are the most easily accessible family planning method in the SANAPA area because they are sold in small shops in each and every village. Condoms are also distributed for free at the dispensaries. The BALANCED and Pwani projects increased the number of condom outlet points, by training CBDs, shop owners, theater groups, village multisectoral committees, bars, etc. to sell or distribute free condoms. By 2012, there were around 150 condom outlet points in the surveyed project villages in Pangani, up from about 60 in 2009.
31
Table 16. Condom Use among Respondents, 2009 and 2012 with Spouse or Steady Partner
Gender Year/Village Women 2009 Project
Villages
We also asked men and women who stated that they had a casual partners how often they used condoms. The numbers of individuals in this sample were very low and hence, none of the data is statistically significant. However, almost 90% of men in project villages stated that they use condoms almost every time or every time they have casual sex (up from 75% in 2009). Among women in project villages, 44% reported using condoms almost every time or every time they have sex with a casual partner up from 30% in 2009. The numbers of individuals reporting casual partners in the control villages were too few to make a comparison (e.g. only two men admitted to having casual sex in 2012 and they both used a condom every time).
32
Table 17. Percent Change of Female and Male Respondents in each Collapsed Condom Use Stage for Project and Control Villages from 2009 to 2012
Gender Village Category Not
Considering
Survey respondents were asked if they have engaged in transactional sex within the past year and more than a year ago. As shown in Table 18, fewer men and women reported engaging in
transactional sex in 2012. A chi-square goodness of fit test indicates that there is a statistically significant reduction in men reporting having engaged in transactional sex between the two years (down from 35% in 2009 to 15.9% in 2012). There is also a significant difference in the
proportion of women engaging in transactional sex in 2012 (14%) compared with 2009 (21%). In project villages, 5.3% of men reported that they had engaged in transactional sex in the last year. This is lower than the national average for rural residents (8.4%) reported in the 2010 Tanzania Demographic and Health Survey (National Bureau of Statistics and ICF Macro 2011). Control villages are at the national average (8.6%). A Chi-Square test for independence (with Yates Continuity Correction) indicates no significant association between village category (i.e., project and control) and men engaging in transactional sex in 2009 and 2012.
Table 18. Women and Men Admitting to Transactional Sex
3.3 Biodiversity Conservation Awareness and Empowerment
In 2012, 82.7% of the respondents were aware of natural resource management (NRM) activities going on in their area. This is an increase by almost 10% from 2009, when 73.2% were aware of NRM activities. Comparing women and men in project and control villages, the awareness of NRM activities has increased among men in all villages, whereas for women the awareness has gone down in some villages and up in others. The two villages that are furthest from SANAPA (Sange and Mikocheni) have the lowest NRM awareness among both genders (Table 19).
Respondents Admitting to Transactional Sex (Gender and Time Period)
Percent (n) in 2009 Percent (n) in 2012 Women (more than one year
ago)
13.6 (32) 12.5 (22) 16.9 (10) 9.0 (18) 8.6 (13)
33
Table 19. Awareness of Natural Resource Management in 2009/2012 by Village, Gender
a
Due to the fact that SPSS cannot calculate Chi-Square tests for goodness of fit when one of the observed categories equals zero, we used the following web utility to conduct the Chi-Square test for goodness-of-fit: Preacher, K. J. (2001, April). Calculation for the chi-square test: An interactive calculation tool for chi-square tests of goodness of fit and independence [Computer software]. Available from http://quantpsy.org.
Of those aware of some sort of NRM, 85.3% knew about SANAPA, while only 0.3% knew about Maziwe (a nearby marine reserve). Eight percent were aware of community-based fisheries management (CFM) activities while 6.5% listed ‘other’ NRM areas (including forest and mangrove management). These numbers are similar to those reported in 2009 and hence, there has not been any major change in what sort of NRM activities people are aware of.
Among those aware of NRM, 46.6% did not see any benefits from the activities and 10% thought they had a negative impact in 2009. In 2012, the number of individuals who did not see any benefits had increased to 54.3%, but only 8% thought they had a negative impact. A few of the survey respondents gave examples of negative impacts, including that elephants and other animals from the park raid crops and attack villagers. These problems are particularly common in the Buyuni village, which is in an area frequented by elephants.
In 2009, over 21% claimed that NRM is good because it protects fisheries. Among the 37.8% in 2012 who perceived the NRM activities to have positive impacts, only 7.4% stated that NRM is good because it protects fisheries while 30.7% saw benefits other than fisheries protection8.
8
The summed breakdown of positive NRM impacts i.e., 7.4% (fisheries benefits) + 30.7% (other) totals 38.1%, which is slightly higher than the percentage of total respondents who perceived the NRM activities to have a positive impact (i.e., 37.8%) b/c one survey respondent listed more than one type of benefit.
34
The most frequently listed other benefits from SANAPA included: 1) improved social services; 2) increased tourism and other income opportunities; and 3) the protection of animals,
land/environmental conservation and rain formation. Some less-frequently mentioned benefits included better neighbors, improved security, firewood/timber, and benefits/memories for future generations.
Although 82.7% of the 2012 survey respondents were aware of NRM activities in the area, a relatively small number were involved in the NRM. Among those aware, 87.9% had no involvement while 3.5% (n=12) serve as a management committee member and 8.9% (n=30) listed other types of involvement9. The other types of involvement included adhering to
SANAPA’s rules (e.g., not killing the animals, conserving the forests), serving as a park ranger, volunteering in security, cooperating with the people who are officially concerned with the conservation of natural resources, getting permission to use the environment, educating others, being a good neighbor/responsible villager/messenger of the village government, planting mangroves and trees, participating in various village activities and informing village leaders when they see the destruction of natural resources.
SANAPA was established with minor public participation and local communities are not involved in its management. Hence, it is not surprising that the number of individuals who participated in some sort of NRM is relatively low. However, there are other community based and participatory NRM initiatives, including collaborative fisheries management and mangrove management in the area. The respondents were asked two questions (Table 20) to understand to what extent they feel empowered to manage natural resources. The results indicate that fewer men and women feel helpless in protecting the environment and fewer agree that only the government is responsible for conservation. For men the change in perception is statistically significant. The respondents had also become more aware that mangroves can protect against erosion (Table 20). Although only statistically significant among the male respondents, this indicates an improvement in environmental knowledge.
Table 20. Percentage of 2009 and 2012 Respondents who Agreed with Opinion Statements Related to Environment and Empowerment
% agreement with against the effects of erosion
*Agree or Strongly Agree
35
3.4 Awareness of Population-Health-Environment (PHE) Linkages
36
Table 21. Percentage of 2009 and 2012 Respondents who Agreed with Opinion Statements Related to the Links between Population and Environment
% agreement with not be enough natural resources to go around in the future
75.2 (152) 83.2 (173) (2, 208) =
This village may soon face a crisis because there are too many people and not
planning, they may not be able to send all of their children to school
89.6 (181) 88.5 (184) (2, 208) =
Families with a large number of children are better off economically than families with only a few children
If you have children, the resources to raise them will come *Agree or Strongly Agree. All p values in bold are statistically significant
A total score for PHE linkages was calculated by adding the level of agreement score for the opinion statements shown in Table 21. The question “This village may soon face a crisis because there are too many people and not enough fish to go around” was excluded from the total scale calculation because that question was not asked in the villages of Mbulizaga and Mkalamo in 2012. The possible total scale score values could range between 5 (i.e., strongly disagree selected for all five opinion statements) and 25 (i.e., strongly agree selected for all five opinion