Original scientific paper UDC 551.465 UDC 551.588
Meteorological forcing of the Adriatic:
present vs. projected climate conditions
Miroslava Pasari} and Mirko Orli} Andrija Mohorovi~i} Geophysical Institute, Faculty of Science,
University of Zagreb, Zagreb, Croatia
Received 12 July 2004, in final form 28 December 2004
Meteorological forcing of the Adriatic is examined under the present and predicted climate conditions. Fields from the time slice-experiment per-formed with ECHAM4 model (W. May and E. Roeckner: A time-slice experi-ment with the ECHAM4 AGCM at high resolution – the impact of horizontal resolution on annual mean climate change, Climate Dynamics, 17, 2001, 407–420) are closely analysed for the Adriatic region. Results obtained for the control period, when compared to a number of data, are found to repro-duce the main features of the present-day surface heat flux, water flux and wind field above the Adriatic. In the future, the Adriatic should experience a reduction of heat loss to the atmosphere as well as an enhanced evaporation accompanied with a reduced precipitation leading to an overall increase of fresh-water loss to the atmosphere. The changes in synoptic activity should lead to an abatement of bora winds and to a reduced frequency of sirocco events which, however, are expected to be much more persistent. Finally, changes in the dynamics of the Adriatic, induced by altered meteorological forcing, are briefly discussed.
Keywords:climate change, meteorological forcing, Adriatic
1. Introduction
First signs of climate changes due to intense human activity have initi-ated extensive climate studies in the last two decades. Great efforts have been made to detect, from all available observations, the present climate changes, to distinguish the anthropogenic impact from the natural variability and to infer on future climate development. The latest results on the subject, compiled in the Third Assessment Report of the Intergovernmental Panel on Climate Change (IPCC) (Houghton et al., 2001) state that
– the global average surface temperature has increased over the 20th century by about 0.6 °C,
– snow cover and ice extent have decreased, 69
– global average sea level has risen between 10 and 20 cm during the 20th century and ocean heat content has increased,
– concentration of atmospheric greenhouse gases and their radiative for-cing have continued to increase as a result of human activities, natural factors having made small contributions to radiative forcing over the past century,
– most of the warming observed over the last 50 years is attributable to human activities,
– global average temperature and sea level are projected to rise under all IPCC scenarios and anthropogenic climate change will persist for many centuries.
The main tools for quantitative assessments of the climate response to changing concentrations of greenhouse gasses are simulations made with coupled atmosphere-ocean global circulation models (AOGCMs), with the forcing being prescribed according to typical scenarios – projected green-house gas emissions, as simulated by climate models – provided by IPCC. One widely investigated, and commonly used as a reference is the IS92a sce-nario (Houghton et al., 1992). According to IS92a the concentrations of the main greenhouse gasses – CO2, CH4, N2O – are prescribed from 1860 until 1990 as observed, and from 1990 onwards the effective CO2concentration is increasing at the rate of 1% per year.
However, regional climate is often affected by smaller scale processes that cannot be resolved by global circulation models. One of the methods used to obtain information on regional climate is the dynamical downscaling technique. This approach was used by May and Roeckner (2001) in their 'time-slice' experiment in which they examined the impact of horizontal reso-lution on the predictions of climate change. Namely, a coarse resoreso-lution global coupled atmosphere-ocean model ECHAM4/OPCY, with radiative for-cing prescribed according to the IS92a scenario, was run to provide lower--boundary forcing, i.e. sea-surface temperature, sea-ice extent and thickness, to a high resolution atmospheric general circulation model ECHAM4. The re-sults show that in the future (end of this century) the winter climate in the Atlantic/European area will be characterized by larger meridional air-pres-sure gradients and strengthening of zonal flow, the temperature rise being larger over the continent than over the Atlantic and Mediterranean, and pre-cipitation increasing/decreasing over the Northern/Southern Europe (May 2001).
In this paper we closely examine the meteorological fields of May and Roeckner (2001) for the Adriatic region. We verify the model by comparing results for the present-climate conditions against data from a number of dif-ferent sources. Through statistical analyses of the modelled fields we investi-gate the meteorological forcing of the sea – surface heat flux, water flux and wind forcing – under the present and the expected future climate conditions.
Finally, we examine the possible changes in the dynamics of the Adriatic Sea. The above mentioned climate-change simulations have previously been used by Vichi et al. (2003) to study response of a complex marine ecosystem in the Northern Adriatic to changing climate.
2. The time-slice experiment
The time-slice experiment (May and Roeckner, 2001) consisted of two simulations, performed with the ECHAM4 high-resolution meteorological model (on a T106 Gaussian grid of about 1.125° horizontal resolution). The control run (1970–1999) represented the present climate, and the scenario (2060–2089) the future climate after an effective doubling of CO2 concentra-tions in the atmosphere. The greenhouse gas forcing entered the model through lower-boundary forcing, obtained from coupled ocean-atmosphere model ECHAM4/OPCY of coarser spatial resolution (T42 grid of about 2.8°). The increasing greenhouse-gas concentrations were prescribed according to the IS92a scenario, slightly modified for industrial gas concentrations.
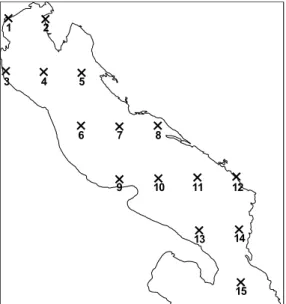
The output meteorological fields were: sea-level pressure, zonal and me-ridional wind and wind stress components at 10 meters, temperature and dew temperature at 2 meters, surface temperature, net surface solar and net surface thermal radiation, upward solar and upward thermal radiation, pre-cipitation and total cloud cover. The fields were given with a time step of 6 hours, during the two 30-year, control and scenario, time intervals and were
1 2 3 4 5 6 7 8 9 10 11 12 13 14 15
represented by 15 grid points in the Adriatic (Figure 1). In the present study we analyse surface heat flux, water flux and wind fields (namely, bora and si-rocco) at grid points covering the Adriatic.
3. Surface heat flux
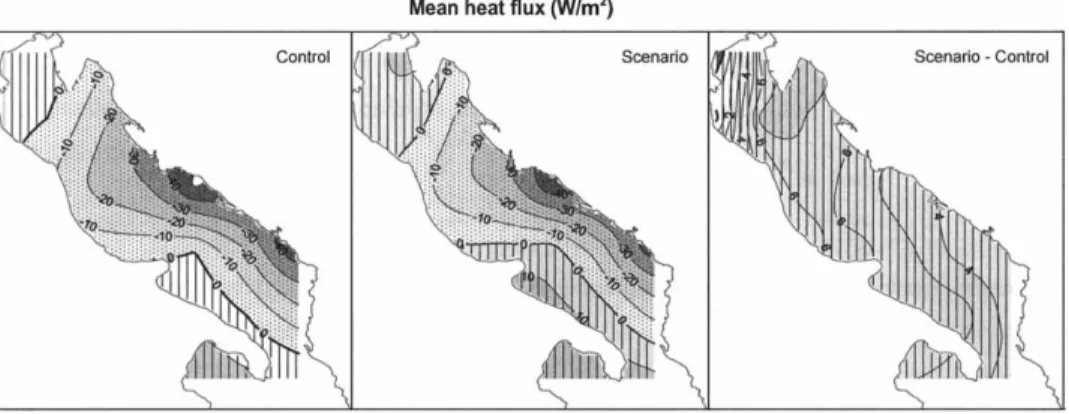
Total surface heat flux, defined as positive when the sea gains heat from the atmosphere, is calculated as the sum of net solar radiation, net thermal radiation, latent heat flux and sensible heat flux. Mean heat fluxes over the 30-year control and scenario intervals and their difference are shown in Fig-ure 2. Adriatic as a whole loses heat to the atmosphere. Presently, according to the model, only in the northernmost and southwestern part of the Adriatic the heat gain exceeds heat loss. Mean annual heat flux averaged over the ba-sin equals –13.3 W/m2. This value is somewhat below empirical estimates of different authors [ranging between –17 and –22 W/m2 (Cushman-Roisin et al., 2001, and references cited therein)], but within the error limits. Based on long-term measurements at Trieste, Supi} and Orli} (1999) have obtained a small but negative heat flux (–3 W/m2) even in the northernmost part of the Adriatic.
The scenario experiment predicts that on the annual time scale less heat will be lost and more heat will be gained, with positive trend being felt in the whole Adriatic (Figure 2). As a result, the region where gain exceeds loss will be enlarged. The Adriatic heat loss is projected to decrease to –7.3 W/m2, which is almost half of its present value.
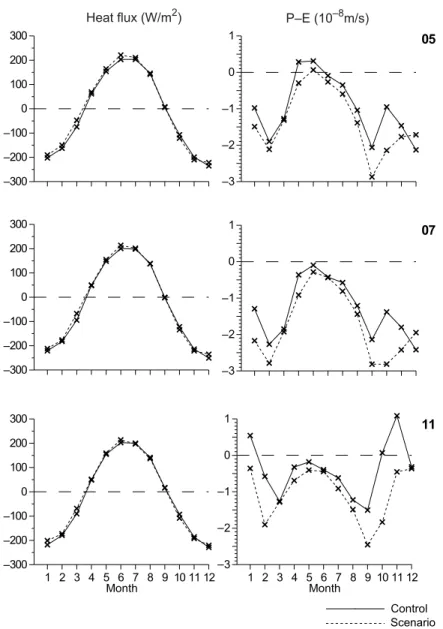
Annual cycle of the surface heat flux (Figure 3, left) shows great simila-rity with the one obtained from meteorological and sea-surface temperature Figure 2.Mean surface heat flux field (W/m2) obtained from the control experiment, the
data at Mali Lo{inj (Supi} and Orli} 1999) – maximum heat gain in June– –July, maximum heat loss in January–February, reversals of heat flux in April and September. The scenario results reveal a decrease in heat loss in winter and spring, increase of heat gain in summer, but also a slight increase of heat loss in autumn.
1 2 3 4 5 6 7 8 9 10 11 12 Month 300 200 100 0 100 200 300 300 200 100 0 100 200 300 –300 –200 –100 0 100 200 300 Control 1 2 3 4 5 6 7 8 9 10 11 12 Month 3 2 1 0 1 3 2 1 0 1 –3 –2 –1 0 1 05 07 11
Heat flux (W/m )2 P–E (10 m/s)–8
– – – – – – – – – – – – Scenario
Figure 3.Mean annual cycle of the surface heat flux (left) and water flux (right), obtained for the control and scenario runs at three grid points (from top to bottom: 5, 7 and 11).
4. Surface water flux
Direct exchange of water between the atmosphere and the sea is achi-eved through precipitation and evaporation. In order to determine the sur-face water flux, evaporation (E) was calculated according to:
E= -× Q L e v rw ,
whereQeis latent heat flux,Lvis latent heat of evaporation andrwis density of water, whereas precipitation (P) was obtained directly from the model.
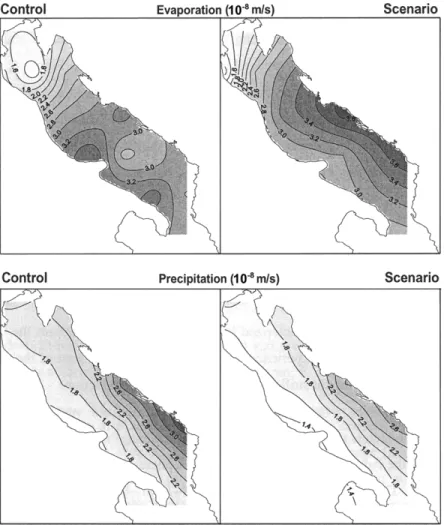
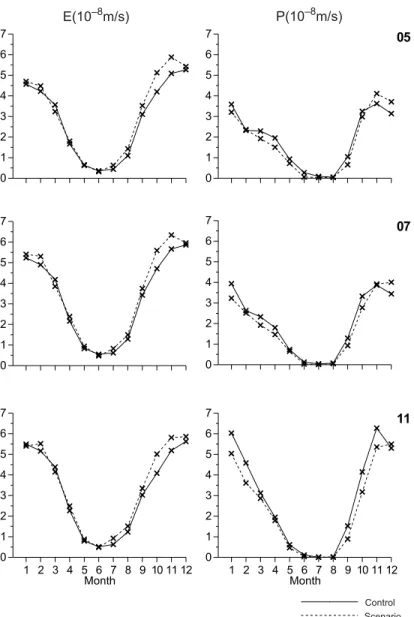
Figure 4.Mean evaporation (10–8m/s) field (upper panels) and mean precipitation (10–8m/s)
Evaporation field obtained for the control period (Figure 4, upper panel, left), is characterized by a strong longitudinal gradient, with minimum va-lues in the north and maximum in the south. The model describes fairly well present-day conditions – the Adriatic mean evaporation (2.8·10–8m/s) is close to empirical estimates[3.1·10–8-3.7·10–8m/s (Cushman-Roisin et al., 2001)], with a maximum in November-December and minimum in June–July (Figure 5, left). The scenario experiment predicts an increase of evaporation through-out the Adriatic, with a basin average of 3.1·10–8m/s (Figure 4, upper panel, right). Due to much larger evaporation at the eastern coast a pronounced transversal gradient should be present in the Middle and Southern Adriatic. The increase should occur throughout the year, but especially in October–No-vember period.
Precipitation field is under the influence of different precipitation re-gimes over the Adriatic. The eastern part of the basin is much wetter than the western part. Maximum precipitation occurs along the southeastern coast, while along the western coast it decreases southward (Cushman-Roi-sin et al., 2001). These features are well reproduced by the model (Figure 4, bottom panel, left). Basin-averaged precipitation for the control period (2.2·10–8 m/s) agrees with values obtained by different authors from mea-surements [1.6·10–8– 2.6·10–8m/s (Cushman-Roisin et al., 2001)]. In the fu-ture, according to the scenario run, precipitation should decrease over the whole Adriatic, the basin mean value dropping to 1.9·10–8m/s (Figure 4, bot-tom panel, right). The spatial pattern of the precipitation field should be sim-ilar to the present one, but with a much weaker transversal gradient. The annual cycle for the control period shows the main features of the observed field in the Adriatic (Figure 5, right) – a maximum in late autumn, minimum in summer, the annual range being much larger in the south (Penzar et al., 2001). The model, however, underestimates summer values (Raicich, 1996; Supi} and Orli}, 1999), especially in the Northern Adriatic. Future climate in the Southern Adriatic should be characterized by less precipitation through-out the whole year. Middle and Northern Adriatic should experience less pre-cipitation during most of the year; in late autumn an increase is expected, but not sufficient to affect the overall reduction.
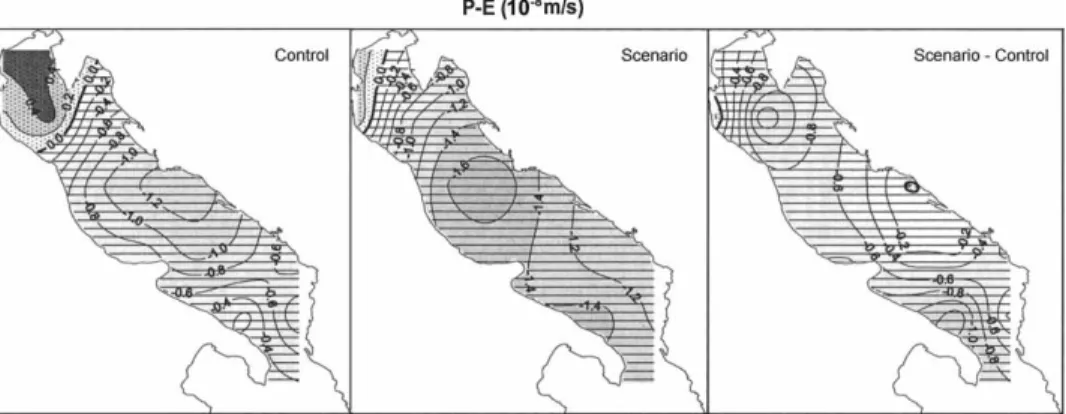
Balance between evaporation and precipitation defines water flux across the air-sea interface (P-E), which is positive when sea gains fresh water. Presently, according to the model, the greatest part of the Adriatic loses wa-ter to the atmosphere, except for the northernmost part of the basin (Figure 6). The Adriatic average water flux (P-E) of –0.6·10–8 m/s agrees well with empirical values of –(0.48±0.38 · 10–8m/s) from Artegiani et al. (1997) and –(0.22 – 1.65 · 10–8m/s) from Raicich (1996), but is well below –(0.89 – 1.14 · 10–8m/s) obtained by Zore-Armanda (1969).
The forthcoming changes inPandEwill be acting in the same sense to-wards an increased fresh water loss. According to the scenario experiment, the negative water flux will more than double (to –1.24·10–8m/s). The excess
of evaporation over precipitation will be enhanced throughout the Adriatic, with almost the entire basin becoming the region of surface fresh water loss (Figure 6). From the difference fields, it appears that the greatest changes in the surface water flux, as well as in the surface heat flux, will be experienced in the Northern Adriatic, south of Istria. It is important to mention that the predicted climate will be characterized by higher standard deviations of
pre-05 07 11 1 2 3 4 5 6 7 8 9 10 11 12 Month 0 1 2 3 4 5 6 7 0 1 2 3 4 5 6 7 0 1 2 3 4 5 6 7 1 2 3 4 5 6 7 8 9 10 11 12 Month 0 1 2 3 4 5 6 7 0 1 2 3 4 5 6 7 0 1 2 3 4 5 6 7 E(10 m/s)–8 P(10 m/s)–8 Control Scenario
Figure 5.Mean annual cycle of evaporation (left) and precipitation (right), obtained for the con-trol and scenario runs at three grid points (from top to bottom: 5, 7 and 11).
cipitation and evaporation (especially along the eastern coast), accompanied with larger extreme values – both maximal and minimal. All this points to-wards harsher climate conditions in the region.
Analysis ofP-E over the year (Figure 3, right) shows that presently in some regions precipitation exceeds evaporation during a part of the year, but under the predicted climate conditions evaporation will prevail throughout the whole year. Greatest changes in the fresh water balance will be felt in au-tumn and winter (from September to February), with December being an ex-ception due to increase in precipitation.
The freshwater budget of a basin is determined not only by direct ex-change of water at the air-sea interface (through P-E), but also through freshwater discharge by rivers and land runoff. In the case of the Adriatic, river runoff is the decisive factor for making it a dilution basin of the Medi-terranean. It is clear that the predicted reduction in precipitation will have a one-way impact on the river discharge, land runoff and submarine springs, thus further decreasing freshwater input. It is uncertain whether the re-duced discharge will still be strong enough to overbalance the (intensified) surface fresh-water loss. Yet, it may be expected that similar climate changes will be affecting the whole Mediterranean, without significantly changing the relationship (i.e. salinity gradient) between the two basins.
5. Wind field
Strong wind events are accompanied by intense exchange of momentum between the atmosphere and the sea. In the Adriatic, strongest mechanical forcing is exerted by bora and sirocco – winds associated with passage of sy-noptic atmospheric disturbances. Here we analyse changes in mechanical at-mospheric forcing by examining bora and sirocco wind fields under the pres-Figure 6. The same as in Figure 2, but for the mean surface water fluxP-E(10–8m/s).
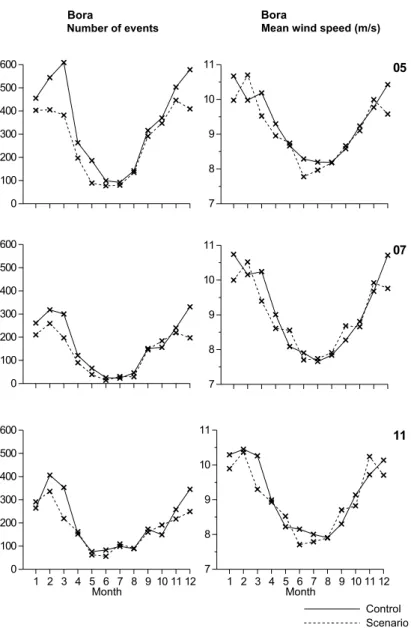
ent-day and predicted climate conditions. We define a wind event as every occurrence of 6-hourly wind value exceeding a threshold value of 7 m/s. Also, a wind episode is defined as a consecutive occurrence of several events at time steps of 6 hours. In the following we examine, for the control and the scenario time slices, the number of wind events, mean wind speed calculated over the events, maximum wind speed over the 30-year interval and duration of the longest episode.
5.1. Bora
Bora is a northeasterly, cold and dry katabatic wind blowing from the continent across the east Adriatic coast. The wind direction is perpendicular
to the coastline, largely determined by local orography. However, for the pur-pose of the study, bora is defined as threshold exceeding wind blowing from NNE to ENE directions (Penzar et al., 2001).
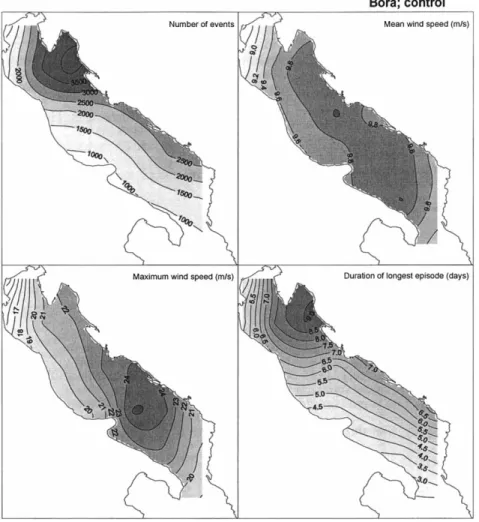
Characteristics of the present-day bora wind field, deduced from observa-tions at meteorological staobserva-tions (e.g. Poje, 1992) and from satellites (Zecchetto and Cappa, 2001) may be summarized as follows:
– bora is strongest along the east Adriatic coast and the wind speed is re-duced in the offshore direction,
– it is characterised by pronounced longshore variability and severe out-bursts due to funnelling effects at mountain gaps, the wind in general being strongest in the Northern Adriatic,
– the frequency of bora events is largest during the cold (November– –March) part of year,
– the longest episodes may last 15 days (Senj) or less (Middle Adriatic). The model (Figures 7a and 8) largely reproduces these features. It does not retain the fine spatial pattern of the wind field; this is not surprising
Number of events Mean wind speed (m/s)
1 2 3 4 5 6 7 8 9 10 11 12 Month 0 100 200 300 400 500 600 0 100 200 300 400 500 600 0 100 200 300 400 500 600 Control 1 2 3 4 5 6 7 8 9 10 11 12 Month 7 8 9 10 11 7 8 9 10 11 7 8 9 10 11 05 07 11 Bora Bora Scenario
Figure 8. Monthly statistics of the bora events, obtained in the control and scenario experi-ments.
since the bora variability is of scales below 10 km and the model resolution is an order of magnitude coarser. Nevertheless, the region around Senj is recog-nized by the model as the part of Adriatic with the most frequent (Makjani}, 1978) and most persistent (Poje, 1992) bora events. But, the maximum in wind speed placed in the Southern Adriatic is not justified by wind observa-tions at Palagru`a (Penzar et al., 2001).
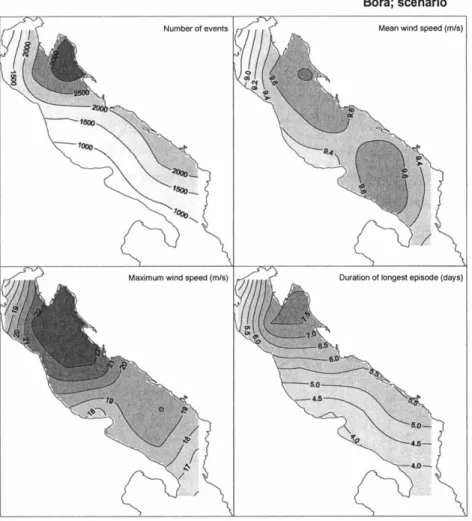
The climate change will be reflected in a weakening of bora – in number and intensity of events as well as in duration of episodes (Figure 7b). The spatial distribution of the wind field will not be very different from that of to-day, with maximum wind speeds being achieved in a wider region off the Velebit mountain. The annual course of bora events, with greater frequency and higher wind speed during the colder part of year, will not be greatly af-fected by the climate change. However, the frequency of bora events will be considerably reduced, especially during the colder part of year, with wind speeds becoming somewhat lower. The changes in the bora wind field will be most evident in the region of maximum bora influence, i.e. the eastern part of Northern Adriatic.
The indication of the forecasted climate changes may have already been observed in the Northern Adriatic. Wind data collected at Trieste in the pe-riod 1951–1996 show a declining trend in both frequency and intensity of northeasterly winds (Pirazzoli and Tomasin, 1999). The authors conclude that the abatement may be related either to interdecadal climate variability or to recent global warming. The results presented here indicate that the ob-served changes in bora climatology are likely a sign of long-term climate change.
5.2. Sirocco
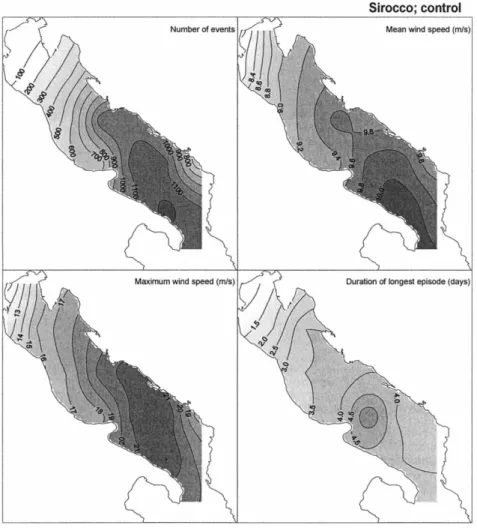
Sirocco is a warm, moist, southeasterly wind, generally blowing on the front side of the eastward moving cyclonic disturbances. It is not strongly subjected to local variability like bora, although at some places, due to co-astal orography and channels between islands, it retains a more southerly or a more easterly direction. For the present analysis, we define sirocco as the threshold (7 m/s) exceeding wind, blowing from the ESE to SSE directions.
Climatology of the sirocco wind field, based on long-term wind observa-tions (Makjani}, 1978; Poje, 1992; Penzar et al., 2001), briefly points to the following:
– the wind is more frequent, the speeds are higher and the sirocco epi-sodes are more persistent in the Southern Adriatic, the wind decreas-ing in all these elements northward of Split,
– the sirocco episodes are most frequent in November–December and February–March period, and very seldom occur in summer,
– the maximum wind speeds are generally lower and the wind persis-tence is weaker than during bora events.
Also, the sirocco has a positive wind curl over the Adriatic, with strong winds along the eastern coast and often lighter and variable winds close to Italian coast (Finizio et al., 1972). However, this finding has not been supported by extensive wind observations.
The model results for the control period to a great extent display the si-rocco climatology – except for the positive wind curl associated with the transversal wind variability (Figure 9a).
The scenario fields retain the same spatial distribution (Figure 9b). How-ever, the climate change will be reflected in two ways. The frequency of si-rocco will be significantly reduced. On the other hand, its duration will con-siderably increase, especially in the southern part of the basin, where the Figure 9a.The same as in Figure 7a, but for sirocco.
longest episodes are predicted to last 7 days (which is significantly greater than 4.5 days obtained in the control run). Mean wind speeds will also in-crease, but with somewhat smaller extreme values.
Monthly analysis (Figure 10) shows that under the present-day climate, sirocco is most frequent in spring (March–April) and autumn (October–No-vember), with greatest speeds being achieved in winter (December–January). The scenario run reveals that, opposite to the overall weakening of sirocco events, these meteorological disturbances are predicted to intensify in No-vember, both in frequency and in speed.
The changes in sirocco (and also bora) climatology are closely related to possible changes in extratropical cyclone activity. A number of studies have Figure 9b.The same as in Figure 7b, but for sirocco.
assessed the effect of global warming on the activity, through sensitivity ex-periments with GCMs (an account on the subject with references may be found in McCabe et al., 2001). The main result of interest here is that dou-bled-CO2 climatic conditions are characterized by a notable reduction of cy-clone frequency, as a consequence of poleward shift of cycy-clone paths. Further,
Sirocco
Number of events
Sirocco
Mean wind speed (m/s)
1 2 3 4 5 6 7 8 9 10 11 12 Month 0 40 80 120 160 200 0 40 80 120 160 200 0 40 80 120 160 200 Control Scenario 1 2 3 4 5 6 7 8 9 10 11 12 Month 7 8 9 10 11 12 7 8 9 10 11 12 7 8 9 10 11 12 05 07 11
Figure 10.The same as in Figure 8, but for sirocco. Note that for the months with number of wind events equal to zero, the mean wind speed is not given.
an observational study (McCabe et al., 2001) of the Northern Hemisphere cy-clone activity in the last forty years has revealed a significant decrease/in-crease in midlatitude/high-latitude cyclone frequency, and a global indecrease/in-crease in storm intensity, with strong indications that the observed northward shift of storm tracks is related to global warming.
6. Possible effects of climate change on the Adriatic dynamics Response of the sea to atmospheric forcing is very complex and numerical models are the most powerful tool in approaching the subject. A great num-ber of modelling studies have lately been undertaken to tackle different as-pects of the Adriatic dynamics. However, the problem of climate change has been examined in two papers only. Bergamasco et al. (2003) have investi-gated the impact of surface heat flux on general circulation and have found that a positive heat flux would set up an anticyclonic general circulation in the Adriatic. Vichi et al. (2003) have focused on modelling of a complex eco-system in the Northern Adriatic; in the physical part of the model they have obtained an overall rise of sea-surface temperature from 15 °C in 1970s to more than 19 °C by the end of this century. Qualitative considerations based on the present findings can provide a further insight into the changes that can be expected in the Adriatic.
Thermohaline forcing has a major impact on water-mass structure, resi-dual circulation in the basin and dense-water formation. Predicted changes in surface heat flux, especially the decreased loss of heat to the atmosphere dur-ing winter, would lead to a weaker convection, thus disfavourdur-ing the process of deep water formation in the Northern Adriatic. As a result, weaker trans-port of heat from the Mediterranean to the Adriatic could be expected. This process could be opposed by reduced precipitation and increased evaporation, which would support a more intense convection. The increased heat gain from the atmosphere during summer would result in higher sea tempera-tures, especially in the shallow Northern Adriatic.
Changes in synoptic activity are readily reflected in wind-driven phe-nomena. Bora wind has, through enhanced evaporation and strong cooling, a major role in dense water formation. The weakening of bora would reduce vertical mixing and cooling of the water column, again disfavouring the deep water formation. Also, transport of oxygen to subsurface layers would be di-minished. Horizontal advection of waters from the Po River mouth towards the Croatian coast would be reduced as well, thus keeping the outgoing vein of fresh water pressed along the Italian coast. It is obvious that these pro-cesses would have strong implications on biogeochemical propro-cesses, espe-cially in the Northern Adriatic, which is – according to our present-day expe-rience – particularly vulnerable to slight changes in the dynamics. On the other hand, sirocco is the main factor in the occurrence of extremely high sea
levels and damaging floods in the Northern Adriatic. The evolution of flood-ing events durflood-ing the last century has amply been studied (e.g. Raicich, 2003) either to investigate storm surge activityper se, or as a proxy of chang-ing storminess. It appears that durchang-ing the last 60 years, weak and moderate surges did not exhibit a clear trend, but the frequency of strong events tended to decrease (Raicich, 2003). However, results of the climate-change simulations presented here show that the increased duration of the sirocco episodes, accompanied by higher wind speeds, would intensify storm surge activity. As a result, the Northern Adriatic would experience more severe and longer lasting floods.
Acknowledgement –This study has been carried out within the CAIEDAS (Climatic and Anthropogenic Impact on the Environmental Dynamics of the Adriatic Sea) project, sponsored by the Italian Ministry of the Environment and Territory together with the Min-istry of Science and Technology of the Republic of Croatia.
References
Artegiani A., D. Bregant, E. Paschini, N. Pinardi, F. Raicich and A. Russo (1997): The Adriatic Sea general circulation. Part I: Air-sea interactions and water mass structure. J. Phys. Oceanogr.27, 1492–1514.
Bergamasco A., V. Filipetto, A. Tomasin and S. Carniel (2003): Northern Adriatic general circu-lation behaviour induced by heat fluxes variations due to possible climatic changes. Il Nuovo Cimento26C, 521–533.
Cushman-Roisin B., M. Ga~i}, P.-M. Poulain and A. Artegiani (Eds) (2001): Physical Oceanogra-phy of the Adriatic Sea. Kluwer Academic Publishers, Dordrecht, 304 pp.
Finizio C., S. Palmieri and A. Riccucci (1972): A numerical model of the Adriatic for the predic-tion of high tides at Venice. Quart. J. R. Met. Soc.98, 86–104.
Houghton J.T., B.A. Callandar and S. K. Varney (Eds) (1992): Climate Change 1992. The Sup-plementary Report to the IPCC Scientific Assessment. Cambridge University Press, Cam-bridge, 205 pp.
Houghton J.T., Y. Ding, D. J. Griggs, M. Noguer, P. J. van der Linden, X. Dai, K. Maskell and C. A. Johnson (Eds) (2001): Climate Change 2001: The Scientific Basis. Cambridge University Press, Cambridge, 881 pp.
Makjani} B. (1978): Bura, jugo, etezija. Prilozi poznavanju vremena i klime SFRJ5. Savezni hidrometeorolo{ki zavod, Beograd, 74 pp.
May W. (2001): Impact of horizontal resolution on the simulation of seasonal climate in the At-lantic/European area for present and future time. Clim. Res.16, 203–223.
May W. and E. Roeckner (2001): A time-slice experiment with the ECHAM4 AGCM at high reso-lution: the impact of horizontal resolution on annual mean climate change. Clim. Dyn.17, 407–420.
McCabe G. J., M. P. Clark and M. C. Serreze (2001): Trends in Northern Hemisphere cyclone fre-quency and intensity. J. Clim.14, 2763–2768.
Penzar B., I. Penzar and M. Orli} (2001): Weather and Climate of the Croatian Adriatic (in Cro-atian). Nakladna ku}a »Dr. Feletar«, Hrvatski hidrografski institut, Zagreb, 258 pp. Pirazzoli P. A. and A. Tomasin (1999): Recent abatement of easterly winds in the Northern
Adri-atic. Int. J. Climatol.19, 1205–1219.
Poje D. (1992): Wind persistence in Croatia. Int. J. Climatol.12, 569–586.
Raicich F. (2003): Recent evolution of sea-level extremes at Trieste (Northern Adriatic). Cont. Shelf. Res.23, 225–235.
Supi} N. and M. Orli} (1999): Seasonal and interannual variability of the Northern Adriatic sur-face fluxes. J. Mar. Sys.20, 205–229.
Vichi M., W. May and A. Navarra (2003): Response of a complex ecosystem model of the North-ern Adriatic Sea to a regional climate change scenario. Clim. Res.24, 141–158.
Zecchetto S. and C. Cappa (2001): The spatial structure of the Mediterranean Sea winds re-vealed by ERS-1 scatterometer. Int. J. Remote Sensing22, 45–70.
Zore-Armanda M. (1969): Evaporation over the Adriatic Sea (in Croatian). Hidrografski go-di{njak1968, 47–56.
SA@ETAK
Djelovanje atmosfere na Jadran: danas te u uvjetima o~ekivanih klimatskih promjena
Miroslava Pasari} i Mirko Orli}
Istra`uje se djelovanje atmosfere na Jadran, u sada{njim te u izmijenjenim uvjetima o~ekivanih klimatskih promjena. Detaljno se analiziraju meteorolo{ka polja nad Jadranom, dobivena modelom ECHAM4 u eksperimentu »vremenskih odrezaka« (W. May and E. Roeckner: A time-slice experiment with the ECHAM4 AGCM at high resolution – the impact of horizontal resolution on annual mean climate change, Cli-mate Dynamics, 17, 2001, 407–420). Usporedba razultata dobivenih za kontrolno razdoblje s nizom postoje}ih mjerenja pokazuje da model dobro reproducira glavne zna~ajke opa`enih povr{inskih protoka topline, vlage te polja vjetra nad Jadranom. Mo`emo o~ekivati da }e Jadran u budu}nosti manje topline predavati atmosferi te da }e se pove}ati isparavanje s njegove povr{ine i smanjiti oborina na njegovom podru~ju – {to bi u kona~nici trebalo dovesti do pove}anog prijenosa vlage iz mora u atmosferu. Promjene u sinopti~koj aktivnosti dovest }e do slabljenja bure te do manje ~estine epizoda juga – ali pove}anog trajanja. Na kraju se ukratko diskutiraju posljedice ovih promjena na dinamiku Jadrana.
Klju~ne rije~i: klimatske promjene, djelovanje atmosfere, Jadran
Corresponding author’s adress: Miroslava Pasari}, Andrija Mohorovi~i} Geophysical Institute, Faculty of Sci-ence, University of Zagreb, Horvatovac bb, 10000 Zagreb, Croatia