SALLA HANKIVUO
INCREASING COMMERCIAL SERVICE DEMAND BY OFFERING
TECHNOLOGY SUPPORT FOR CUSTOMERS
Master of Science Thesis
Prof. Miia Martinsuo has been appointed as the examiner the Council Meeting of the Faculty of Engineering Sciences on 4 March, 2015.
ABSTRACT
TAMPERE UNIVERSITY OF TECHNOLOGY
Master’s Degree Programme in Material Technology
HANKIVUO, SALLA: Increasing commercial service demand by offering technology support for customers
Master of Science Thesis, 82 pages September 2015
Major: Industrial Management Examiner: Professor Miia Martinsuo
Keywords: service demand, consumer behavior, non-aviation revenue, dwell time
As the price competition in the aviation market between airlines and airport operators has increased, airport operators have focused their actions on the non-aviation side to attract profits. The commercial services of the airports provide opportunities for airport operators to increase their profitability. This research focuses on the non-aviation part of the airport business activity. Transfer passengers are chosen to be the target group due to their potential quantitative growth in the future.
The literature review of this thesis represents the main occurrence of service demand, previous ways to increase the service demand and, further alternative ways to increase service demand. The service demand literature review also clarifies different ways to increase service demand at the airport environment. An airport creates a unique retail environment having a multicultural environment with its passengers who have different preferences and consumer habits. In the empirical section, a field test is performed in an actual operational environment. A portable mobile phone pilot examines a flight passenger’s alternative way to increase personal time and movement within the terminal by liberating them from the power socket.
According to the research results, increased personal time, a versatile mixture of services, good perceived value and low stress levels at the airport have an influence on increased spending. Additionally, passenger characteristics and flight destinations have an effect on service demand and revenue. If the airport can be seen as a shopping destination, the share of pre-planned purchases increases.
TIIVISTELMÄ
TAMPEREEN TEKNILLINEN YLIOPISTO Materiaalitekniikan koulutusohjelma
HANKIVUO, SALLA: Kaupallisen palvelukysynnän kasvattaminen tarjoamalla asiakkaille teknologista tukea
Diplomityö, 82 sivua Syyskuu 2015
Pääaine: Teollisuustalous
Tarkastaja: professori Miia Martinsuo
Avainsanat: palvelukysyntä, kuluttajakäyttäytyminen, lentokentän kaupallinen toiminta, vapaa-aika
Lentoyhtiöiden ja lentokenttäoperaattoreiden hintakilpailun kasvun myötä lentokenttäoperaattorit ovat keskittäneet merkittävästi toimintaansa kaupalliseen liiketoimintaan. Lentokenttien kaupalliset palvelut mahdollistavat lentokenttäoperaattoreiden parantaa heidän taloudellista kannattavuuttaan. Tutkimus keskittyy lentokentän kaupalliseen liiketoimintaan. Vaihtomatkustajat ovat valittu kohderyhmäksi heidän tulevaisuuden kasvupotentiaalin vuoksi.
Kirjallisuuskatsaus tuo esille palvelukysynnän ilmiötä, aiempia keinoja kasvattaa palvelukysyntää ja lisäksi vaihtoehtoisia tapoja kasvattaa palvelukysyntää. Palvelukysynnän kirjallisuuskatsaus myös selventää tapoja, joilla kasvattaa palvelukysyntää lentokenttäympäristössä. Lentokenttä monikulttuurisena ympäristönä, useine mieltymyksineen ja erilaisine kuluttajakäyttäytymisineen luovat ainutlaatuiset olosuhteet vähittäismyyntiin. Työn toinen osuus, käytännön kenttäkoe suoritetaan oikeassa toimintaympäristössä. Kannettavien kännykkälatureiden palvelupilotointi tutkii matkustajien tapoja kasvattaa omaa aikaa ja liikkumista terminaalissa. Matkustajalla ei mene aikaa vapaan pistorasian etsimiseen, eikä eletronisen laitteen lataus ole paikkaan sidottu.
Tutkimustulosten perusteella lisääntynyt vapaa-aika, monipuolinen palvelutarjonta, korkea asiakastyytyväisyys, palveluiden hyvä löydettävyys ja matalat stressitasot ovat yhdistetty korkeampaan kulutukseen. Lisäksi matkustajaprofiileilla ja matkakohteilla on todettu olevan vaikutusta palvelukysyntään ja tuottoihin. Pitkän matkan lentomatkustaja käyttävät keskimäärin enemmän lentokentän palveluita. Ennalta suunniteltujen ostosten osuus kasvaa, jos lentokenttä pystytään näkemään ostosten teko paikkana.
PREFACE
This study has been carried out for the Finnish airport operator, Finavia, and for the department of the commercial services of Helsinki Airport.
First I want to thank Isomäki and Knuutila and, especially, the departments of the commercial services and the service development. I am grateful to Isomäki for enabling the Master’s Thesis project. I am thankful for Knuutila, the supervisor of the work, for all the advice and for the introduction to the aviation industry.
Additionally, I want to express my compliments to Professor Martisuo for the guidance and fast inspection of the work.
Salla Hankivuo
September 2015 Helsinki
TABLE OF CONTENTS
1 INTRODUCTION ... 1
1.1 Introduction of the case company ... 1
1.2 The background of the study ... 1
1.3 The purpose and the scope of the study ... 4
1.4 The structure of the study ... 5
2 SERVICE DEMAND AND ITS INCREMENT ... 8
2.1 The concept of service demand... 8
2.2 Nature of service demand ... 10
2.3 Previous ways to increase service demand ... 14
2.3.1 Used methods in different retail environments ... 15
2.3.2 Sensory influencers of service demand ... 20
2.4 Increasing service demand at the airport environment ... 21
2.4.1 Determinants and measures of non-aviation revenue ... 24
2.4.2 Flight passenger’s determinants of service demand ... 28
2.4.3 Dwell time and its impact on spending ... 31
2.4.4 Space allocation in international passenger terminal... 32
2.4.5 Eliminating barriers to use commercial services ... 34
2.5 The use of the technology for increasing the demand ... 39
3 FIELD EXPERIMENT ... 43
3.1 Background information of the experiment ... 43
3.2 Research method ... 49
3.3 Experiment presentation ... 51
3.4 Required resources and arrangements ... 53
3.4.1 Test environment conditions and expected results ... 55
3.4.2 Instructions for distribution sessions ... 57
3.5 Measurement objects ... 58
4 RESULTS OF THE FIELD EXPERIMENT ... 61
4.1 The distribution of chargers ... 61
4.2 The return of chargers ... 64
4.3 Cost-benefit analysis of the experiment ... 67
4.3.1 Operational suggestions for charger service in the future ... 68
4.3.2 Cost-benefit analysis for future charger service ... 68
4.4 Perceived experiences and consequences of the experiment ... 70
5 DISCUSSION ... 72
6 CONCLUSION... 75
6.1 Analysis and success of the research ... 75
6.2 Limitations at the airport environment ... 76
6.3 Further research ... 76
LIST OF FIGURES
Figure 1. The structure of the research ... 6
Figure 2. Six stage strategy for service competition (Grönroos 2001, p. 377) ... 12
Figure 3. Four keys to increase service demand at the airport (DKMA 2013, modified)... 22
Figure 4. Illustration of three main determinants of non-aviation revenue (Volkova & Müller 2012) ... 24
Figure 5. Passenger spending per head by destination and airline type (Bush & Storey 2013, p. 29, modified) ... 27
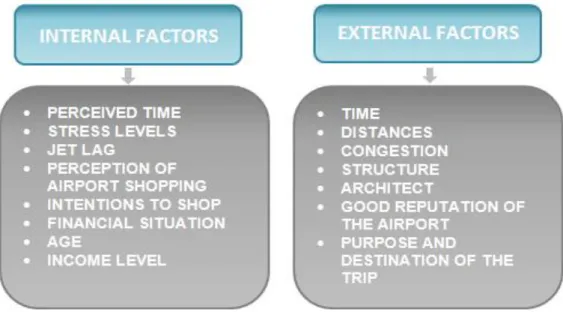
Figure 6. Passenger’s internal and external factors affecting service demand ... 29
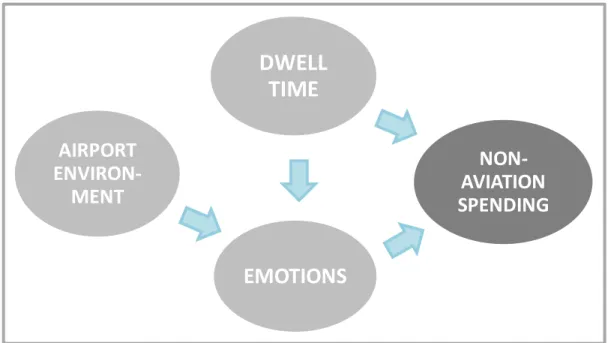
Figure 7. The position of dwell time in terms of airport spending (Bohl 2014, modified)... 31
Figure 8. Advantages of technology based solutions ... 40
Figure 9. Hierarchy of needs of a transfer passenger ... 45
Figure 10. Segmentation of transfer passengers through transfer time (Knuutila 2015, modified) ... 46
Figure 11. Increased dwell time and its impact on sales ... 48
Figure 12. Used resources and arrangements of the field experiment ... 54
Figure 13. Distributed and returned pieces of portable pocket chargers ... 61
ABBREVIATIONS
Aeronautical Revenue Revenue of services directly related to the processing of aircraft and their passengers and cargo in connection with facilitating travel
Airside Security-checked area of an airport
B2C Business-to-consumer
C2C Customer-to-customer
Dwell time Free time at an airport or at the shopping
mall
F&B Food and Beverage
FSA Full Service Airline
KPI Key Performance Indicator
Landside Non-security-checked area of an
airport
LCC Low Cost Carrier
Non-Aviation Revenue Revenue accumulated from ancillary commercial services, facilities and amenities at an airport
Non-Schengen area Area that requires external border
controls while entering and leaving the district
PR Public Relations
Process time Time required to perform check-in,
security check and passport control
Schengen area Area that allow free movement between
26 European countries that have signed the Schengen agreement
1 INTRODUCTION
In the first chapter, a case company is introduced, a background of the study, a purpose and scope of the study is expressed. The main goal of the research is presented in Subchapter 1.3 and the object is defined by three research question. Moreover, the structure of the study is stated.
1.1 Introduction of the case company
This research is conducted as a commission for the Finnish airport operator, Finavia, and more precisely, for the department of commercial services. Finavia operates its 24 airports and an air navigation system. Commercial services, passenger services and customer experience are the focus areas of the commercial services department. Helsinki Airport stands for the main airport of Finavia with its almost 16 million passengers in the year of 2014. The number of flight passengers has been growing and the company has accumulated 19.7 million passengers in total. The growth of 3.6 percent has been registered in the year of 2014 when comparing with the statistics of the year of 2013 (Finavia 2014). Finavia’s customers consist of airport service operators, airline operators and flight passengers.
1.2 The background of the study
A primary task for an airport operator used to be providing infrastructure and other facilities for airlines (Zenglein & Müller 2007). The aviation market has been under a transformation during the past decades. Airlines are constantly competing to establish new routes rather than contest with existing ones. A market growth of more routes between the years 2002 and 2011 has increased 54 percent and 41 percent more capacity was offered during the same time period (Bush & Storey 2013, p. 20-21). Primarily, airlines are interested in ensuring that the processes and systems of an airport meet their requirements for fast plane turnaround times which may mean lower cost infrastructure. Assets of an airport operator are geographically fixed and generally create value only in airport use. Airlines have different situation in which it is typical to lease or sell assets. In order to satisfy the owner or investors and creditors, airport operators require consistent and reasonable returns to remain sustainable and to ensure capabilities to maintain business expansion.(Bush & Storey 2013, p. 23; Zenglein & Müller 2007) At the present model, airport operators have broadened their business actions and create experiences. The price competition between the airlines and the airport operators has
increased challenging the airport operators to improve profits from the aviation segment. Therefore, to reduce economic risks, the airport operators want to expand their non-aeronautical activities in order to have a better resistance to absorb economic shocks comparing reliance purely on an aeronautical sector. New store concepts and service techniques must be developed in order to attract passenger demand in the global environment where individuals have a wide range of retail choices online.
The non-aviation section mainly consists of retail stores, food and beverages (F&B), money exchange, parking and car rental services. The largest airports benefit from the economics of scale in terms of a variety of special retailing. The large international airport operators may offer services from cinemas, museums, art galleries, mini golf to wellness centers, saunas, banks, health clinics, chapels and praying areas. An every third transfer passenger is told to choose their connecting flight based on their transit airport (Finavia 2015). Thus the role of the non-aviation business is significant for the airport operators not only a financially but also on behalf of the overall image.
The airport operators take commercial revenue into account when planning charges for the airlines. Both parties, a passenger and an airline, can benefit from the value added revenue generated from the commercial services. Lower operational charges for the airlines can be provided by the airport operator if the net profit from the non-aviation section reaches high levels. Additionally, cheaper flight tickets can be offered and a better airport experience for passengers can be produced (Bush & Storey 2013, p.19). Further, lower airline ticket prices can draw more consumers to use the airports’ commercial servics.
The average share of the non-aeronautical revenue at European airports was 46 percent between the years of 2008 and 2011 (Bush & Storey 2013, p.13), whereas Volkova & Müller (2012) indicates the share of the non-aviation revenue being 57 percent at U.K airports. When examine more accurately, the retail revenue of European airports forms 15 percent of the total non-aeronautical and aeronautical revenue. Between the time period of four years from 2008 till 2011, the increment was EUR 1 billion from EUR 3.1 billion to EUR 4.1 billion. In comparison, the equivalent share of the retail revenue accounted for 9 percent (Bush & Storey 2013, p. 11). Another example of the power of an airport non-aviation service cluster is that large airport retail sales per meter can be up to six times higher than shopping malls and downtown stores (Kasarda 2008). This is partly explained by the high passenger flows through the hub terminals.
An airport operator usually outsources its commercial services to special retails and service providers. The airport operator’s role of selecting and negotiating the suitable service operators and to the right location within the airport evidently has a significant factor for the service demand and commercial success of the airport. Nevertheless, the efficiency and the ease of compulsory procedures such as security check and passport control also have affect the use of the commercial services. If passengers’ process time
takes all of their free time at the airport, they will not have the required time for consume. Further, the airport operator’s commercial revenue related responsibility continues to provide the terminal facilities which either heartens to spend and use services or on the contrary, to discourage passengers to consume.(Bush & Storey 2013, p.17)
Kasarda (2008) and Zenglein & Müller (2007) describe a future airport to remind of an airport city and to which Kasarda (2008) uses a term aetropolis. The concept of aetropolis originates from the increased links between the airport operators and cluster of shopping centers, business parks, information and communications technology complexes, hotel and entertainment centers and wholesale merchandise marts. Moreover, the accessibleness of aetropolises consists of extensive transportation modes of air, railway and motorway connections.
In wealthy societies, shopping itself can be a significant leisure activity and thus, there is clearly a good potential shopping to be a greater part of the whole passenger journey. The retail concept of duty free has branched out to strengthen the passenger experience. Almost half of the passengers have mentioned shopping to be the favorite airport activity and 60 percent of the European passengers are regularly making purchases at airports. The equivalent share is significantly lower in the US (Bush & Storey 2013, p. 5, 20). Service demand and its variation can easily be observed at the airports. Rush hours and holiday seasons have a considerable effect on to the service demand. Consumers, as well as transfer passengers, have become more demanding as customers due to the increased standard of living and educational level of the workforce (Grönroos 1994).
The use of the technology has increased rapidly among the consumers as well as the service operators. Technology applications enable multiple possibilities for service providers to affect their relationship with the customers. Price-consciousness and cross-border competition are the consequences of technology revolution and increased people and information mobility.
Larger airports tend to have more international and intercontinental passengers who are willing to consume more at the airports (Volkova & Müller 2012). Helsinki Airport attracted almost 13.5 million international passengers in the year of 2014 and the international passenger volume has grown 4.6 percent since the previous year (Finavia 2014). However, the cultural values have an important role as regards spending habits. International airport terminal creates a unique space as a retail environment with its own challenges and opportunities in regard to service demand. Service demand can be affected for instance by managing stress levels, retail mix, amount of dwell time and designing passenger volumes in order to avoid crowd in terminals. Easy way-finding, information regards of gate distances, service accessibility and knowledge of available time before boarding for instance have effect on decreasing stress levels.
1.3 The purpose and the scope of the study
The goal for this study is to recognize procedures and techniques to increase the service demand among passengers to enhance business activity. Transfer passengers are chosen to be the target group due to the positive growth expectations in the future. In this study, the chosen segment of transfer passengers comprehends mainly travelers moving from the non-Schengen area to the Schengen area and vice versa.
The segment of arriving passengers is considered having a low or insignificant commercial value for an airport operator and due to that reason, arriving flight passengers are delimited from this study. Additionally, the landside area of an airport, including car parking lots, for instance, is excluded from the study. The angle of an approach in terms of increment of service demand encompasses the airport operator, service operators and passengers’ point of view. Even though, airline operators are a significant segment of customers for an airport operator, the role of airlines is minor in this study. However, legal restrictions of duty free spending and airline operators’ policy in terms of carry-on baggage are taken into account because they have an immediate influence on non-aviation spending.
Lack of information in terms of increasing service demand in this context is the research problem in this study. Study focuses on improving consumer markets. The main research object is to increase commercial service demand by offering technology support for customers. As the main research is extensive, it is supported by the research questions. The research questions are answered with the help of the literature review and the field experiment. Further, interviews are part of this study to assist to gather primary data.
1. How can the service demand be increased at the airport environment?
2. What are the experienced consequences of using the technological application on the people flow?
3. How can the service demand be affected for a transfer passenger by intrinsic and extrinsic factors?
The chosen method for supporting research questions is conducted by a field experiment. The actual operational environment acts as a context instead of a laboratory environment. Finavia provides a good starting point and resources for performing field experiment. Every day, nearly 44 000 flight passengers travel through Helsinki Airport (Finavia 2014). Transfer passengers are playing the key role of the whole test. Another reason why the field experiment is the chosen method is that a laboratory test would have been challenging to implement into the real environment. The test is focused on area of service demand and consumer behavior that has not performed before.
At the airport environment, lack of time while changing planes can be seen as a barrier to use commercial services. Portable mobile phone chargers are distributed to passengers in the field experiment. A pocket charger makes possible to charge a small electronic device regardless of the place. The goal of the mobile phone charger pilot is not only to increase dwell time but also active transfer passengers and other passengers to move around the terminal enabling to use more commercial services.
In terms of service demand, this research predominantly focuses on the relationship between transfer passengers and airport’s service providers. Flight passengers that form the service demand are often end users at the same time. As the customer base being very heterogeneous with demand, the possibility to customize services is limited. Especially in the airport operational environment, the demand is very versatile than other retail environment like in shopping centers, for instance. The level of customer participation of flight passengers at the airport during the service delivery is considerably low when comparing fast food restaurant services to high customer involvement required the services of personal training. Now that B2C service demand context is dominant in this research, a number of single purchases is high, monetary purchase being relatively small and service time relatively short. To lengthen the customer retention in a shorter time span is somewhat challenging or impossible because the main goal for passengers is to proceed from a location A to B. However, in the long-term retention of customers is doable but the cluster for passengers who visit the airport for instance twice a week is small.
1.4 The structure of the study
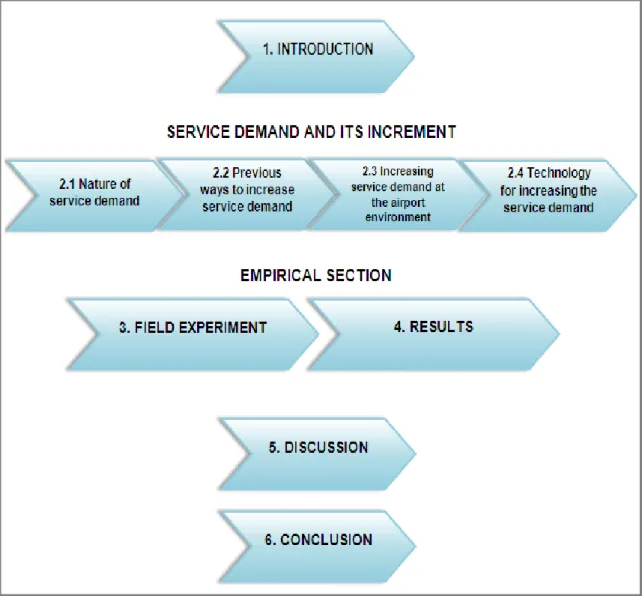
The research consists of six parts. First part of the work introduces the work and its background. The literature review studies the service demand that supports the field experiment and its results. Discussion covers the fifth section and last section summaries the whole study together. The structure of the work as a whole is represented in Figure 1.
Figure 1. The structure of the research
In the first chapter, the reader is leaded to the background information on the study and the reasons why this study is performed. The chapter retains research questions and additionally, the structuring of the research.
The second chapter is the literature review based chapter of the work. The literature review of the research is conducted in order to find answers to the research questions from previously conducted researches. In this way, the repetition of already executed studies can be avoided. Moreover, the empirical research can be focused on areas in which the research has not been done before. The service demand as a phenomenon and previously executed ways for increasing service demand are examined in this chapter. As a part of the service demand chapter, increasing the service demand at the airport environment and the use of the technology for increasing the service demand are treated.
The chapters three and four consist of the field experiment research. In the third chapter, the research method and experiment are presented. The field experiment method is the used test method in the empirical part of the research. The value that the service pilot
creates and where in the service path the value is produced are described in the third chapter. Furthermore, passenger profiles to which the field experiment is directed are represented.
The results of the experiment research are examined at the end of chapter four. The fourth chapter of the research focuses on the experienced consequences and cost-benefit analysis of the field experiment. Moreover, suggestions for the future service concepts are examined. The fifth chapter covers discussion. The achieved results from the literature review and the field experiment are being discussed in the fifth chapter.
The last chapter of the work is the conclusion. The research results are inspected in this chapter. In the conclusion, it is analyzed what kind of limitations the airport environment required and how the research succeed from different points of view. In addition, the answers to the given research questions are presented. For the future, research theme suggestions are presented at the end of the chapter.
2 SERVICE DEMAND AND ITS INCREMENT
In the second chapter, service demand and previous ways to increase service demand are studied. Subchapter 2.1 clarifies the definitions of service and demand. Further, the factors that are required to generate service demand are explained. Subchapter 2.4 focuses on the airport environment, what kind features affect commercial revenue among flight passengers and how service demand can be increased at the airport environment. The use of technology for increasing service demand is brought up in Subchapter 2.5.
2.1 The concept of service demand
The desire, affordability and willingness to purchase are three characteristics in a society that are needed to generate the demand for services (Rao 2009, p. 105). According to Moon (2012, p. 2), service demand can be explained by two independent variables of price and service time, whereas Cai et al. (2012) describe service demand being a sum of all service times during visits to a given resource. The law of a service demand is presented in the equation (1).
(1)
The equation (1) clarifies the required factors of service demand law and their interdependence. Ui denotes the resource utilization of i and Xo indicates the overall
throughput of a system. The variable Ui can be obtained by using a performance
monitoring facilities that are supported by operating systems. Throughput, Xo, can be
directly calculated by counting the total number of completed request in a fixed time period. Service demand law can be taken advantage of estimating service demand for different resource.(Cai et al. 2012)
Definition of services can be divided into three totalities of deeds, processes and performances (Zeithaml & Bitner 1996, p. 5). According to Fitzsimmons & Fitzsimmons (2004, p. 4), Mudie & Pirrie (2006, p. 3) and Rao’s (2009, p. 8), the service can be seen as a time-perishable and intangible experience that is executed for a customer. In this configuration, the customer’s role can be a co-producer. A service cannot be shifted from one person to another and further, the service is produced and consumed concurrently. Services are not directly commensurate to products for several reasons. Hoffman & Bateson (2006, p. 28) clarify the difference by characteristics of
inseparability and heterogeneity in addition to the perishability and intangibility by Fitzsimmons & Fitzsimmons (2004, p. 4), Mudie & Pirrie (2006, p. 3) and Rao (2009, p. 10).
The service quality and productivity cannot be distinguished from each other. When comparing a service business with the industry field, the customer influence on productivity differs significantly. This is due to the fact that a customer is physically present (Mudie & Pirrie 2006, p. 6) and participates in the service process, the progress of it and the outcome of the service. They can also affect how other customers involve the process and how they experience the service quality. The input of a service provider and the input of a customer come across in the service process. Technology, personnel, systems, information and the use of time are the inputs that service provider brings into the service process in directly. The customer’s input is participation and the participation of fellow customers (Grönroos 2001, p. 214-215, Bitner et al. 1997). Demand plays an important role for the service productivity. As the service cannot be stored, contrary than in the industry, the impacts of the fluctuating demand are greater (Rao 2009, p. 108). If the demand is low, the resources of a service provider are underutilized and thus, it weakens the internal productivity. Once the demand meets the resources of a service provider, the internal efficiency and productivity increase. The profitability decreases if the demand exceeds the service provider’s resources while lowering the experienced service level and the use of external resources.(Grönroos 2009, p. 284-285)
Demand can be measured with the assistance of data market research. Nevertheless, at the point of and time of service production and consumption, the needs, wants and preferences of customers is constantly changing and thus challenging to forecast (Grönroos 2001, p. 378). Koshiba, Takenaka & Motomura, (2013, p. 281) bring out two main problems when forecasting service demand. Identified challenges are that there is no absolute right solution existing because the correct solution is depending on the situation and further, it is impossible to list these probable situations. Mudie & Pirrie (2006, p. 3) emphasize the role of uncertainty before, during and after the service. It is often considered that customer involvement increases and committees loyal consumers simultaneously (Bitner et al. 1997; Seiders et al. 2005). In the case of Ikea, the company plays a role of an interactive service provider where the customer participation has a considerable part of the entire service process. In other words, Ikea indirectly supports the service process by offering instructions, tools and activating the customer. The customer is anticipated to continue to finish the service process by assembling the furniture at home.(Grönroos 2001, p. 211)
2.2 Nature of service demand
Service demand is commonly derived from a heterogeneous source. According to Fitzsimmons & Fitzsimmons (2004, p. 246), the extensive variation in demand for services do not necessary need to be acceptable. There are different strategies how to manage demand. The impact of the cyclical variation system can be diminished by means of smooth demand. The average rate of customer volume becomes steadier in the course of time, even though the service users continue to arrive at random intervals. Rao (2009, p. 114) suggests adding communication and inform customers about peak hours or the peak business days. Some customers may prefer to use services during the non-peak hours and days. Other tools in addition to control service demand are partition demand, price offer incentives, promote off-peak demand, development of complementary services and the use of reservation systems.
Partitioning demand origin from the idea of service demand being consisted from the scattered crowd of consumers. The partitioning demand can be perceived in the airline business, in which service demand is grouped into two parts, planned arrivals and random arrivals (Fitzsimmons & Fitzsimmons 2004, p. 247-248). The differentiation process is conducted between business passengers and weekend holiday passengers. In addition to the partitioning demand, the price differentiation is an alternative way to smooth service demand. Price differentiation comprehends discriminatory pricing that are easily distinguished at the movie theaters, as the price of service varies depending on the showing time of the movie. By offering price incentives during the off-peak seasons, it can also attract new customers to use services. A wider customer base has good potential to create longer relationships between a customer and a service provider. However, it is noteworthy that private firms want to prevent their high-paid customers from shifting to the low-rate paid user category.
The demand between the low and a high season is separated by multiple variations and features. Traveling as well as sightseeing, sports and dining, for instance, can be seen as congestion-prone services (Moon 2012, p. 1). The creative and alternative use of resources can steady the consumer traffic volumes. One way to increase the off-peak demand is to seek different sources of demand (Fitzsimmons & Fitzsimmons 2004, p. 249). This strategy is used for example in department stores and skiing areas. Mountain ski resorts promote and develop alternative activities like trekking and biking for attracting more tourists to the summer season. The Austrian ski destination, Bad Gastein, has succeed in generating higher travel volumes for summer season up to that level that summer season has become more popular than the winter season. Department stores can promote low seasons by attracting customers to do their shopping before Christmas rush or giving special offers that are valid only on Tuesdays (Fitzsimmons & Fitzsimmons 2004, p. 249). Rao (2009, p. 105) summaries that the desired level of demand can be achieved ones it is set to be one of the primary responsibilities of a
marketing organization.
Bars in the restaurants and video games in the lobbies of the movie theaters are considered complementary services. Complementary services can have a notable financial benefit. In addition to the profitable advantage, there is possibility to shape a customer’s experience and perception of the service unity. The connective factor behind the complementary services is to occupy customers during their waiting time (Fitzsimmons & Fitzsimmons 2004, p. 249) because consumers have a habit of overestimating significantly their time spend on waiting (Berry et al. 2002). Additionally, while they have something interesting and time consuming activities available, the anxious and frustration levels lower. In addition to anxiety, other psychological factors during dwell time such as stress, excitement and annoyance also have an impact on the perception of waiting times and further, the service quality (Berry et al. 2002). In consequence of soothing a customer, the far-reaching results can be obtained in terms of larger singe purchases and substantial consumption.
There are more complementary service concepts that can be observed in practice. In North-America, for instance, the convenience stores have created a concept of holistic medicine which merges an original medical presence with a nutritional, psychological and overall well-being. Complementary service can lead up to be a notable source of revenue if the new demand for complementary service is being contracyclical. A result of this can be a consistent aggregated demand in which the demand for the original service is lower than the new service demand. This is why air-condition service providers often have heating contractors in their pay of.(Fitzsimmons & Fitzsimmons 2004, p. 249-250)
Variation in service demand can originate for very natural reasons. Service demand can be highly dependent on the time of the day, the day of the week, the season of the year. During the summer time, people usually have preferable prospects to travel due to their annual work rhythm. Significant variation in service demand can cause queues and periods of downtime for services. Queuing and waiting time can be seen as a determining factor whether to use a service or not. Waiting on the phone to get service was the most annoying aspect of doing business with call centers (Mudie & Pirrie 2006, p. 15). If the long waiting times are known beforehand, customers do not have so high hopes towards the service quality (Fodness & Murray 2007). On the other hand, downtime of service can send the negative signals of the service provider that why consumers are not interested. In some cases, like in most restaurants and in the transportation business, the hourly time of the day have a remarkable influence on fluctuating demand. Additionally, service demand is very committed to the nature of service (Fitzsimmons & Fitzsimmons 2004, p. 502). When predicting customer volumes for instance in hotels, it is important to understand the changing and day related forces in service demand. Demand during the weekdays is mainly generated by the business
customer, whereas vacationers prefer to use hotel accommodation during the weekends (Fitzsimmons & Fitzsimmons 2004, p. 501).
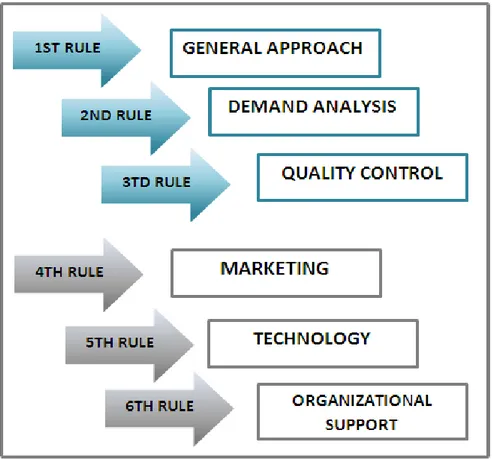
Negative demand, no demand and latent demand also represent demand situations. The evaluation of the offer may lead people to make a decision that is not favourable for the service operator when the negative demand occurs. People are aware of the service and the benefits offered when negative demand is present, whereas no demand can exists because of unawareness, insufficient information about the service or due to customers’ indifference. Latent demand occurs when, for instance, a passenger is traveling in an ordinary bus but a passenger dream of traveling in a luxury bus.(Rao 2009, p. 106-107) There is a specific guideline created for service demand in a competitive situation. According to Grönroos (2001, p. 376-377), the general guideline of managing service strategy and service management can be implemented in most service situations. In the guideline, the bottleneck of the service business is the customer itself. Furthermore, customers are seen as a critical resource not forgetting the importance of information technology, operational systems and physical resources. In a service process, the use of technology has not anywhere near reached it potential and thus, it can also be classified as a bottleneck of the service business. The service guideline of six rules is collected in order to emphasize the common features of a customer relationship in most service competition situations. The strategy of six stages for service competition is presented in Figure 2.
The versatile and flexible demand of individuals and business customers challenge the service provider. According to the first rule of the service guideline, the firms who manage strengthen their customer relationship will achieve the best lucrative outcome. The customer engagement can be obtained if employees behave as consultants who are willing to do their work when the customer needs them in a way the customer wants. The motivation, creativity and skills of people represent the key successful factors of developing new services and implementation of new services. This occurs even though the increased use of automated service systems, internet and the development of information technology.(Grönroos 2001, p. 377-378)
The second rule of demand analysis indicates the importance of the personnel customer contact while producing the service. The realistic demand of customers can be achieved when the needs, values, expectations and wishes are carefully analyzed through at the time of service production and consumption. A standard market data provides a solid base for demand forecasting. However, the needs and wants of a customer are impossible to measure in advance. Fast reaction to continuously changing demand for consumers’ wants and needs ought to be done in order to stay in the business. The best person to notice the possibly unpredictable shift in needs or wishes of the customer is the one who actually produce the service.(Grönroos 2001, p. 377)
The service quality is a distinctive feature when operators offer the same kind of service but have different qualities. Comfort, safety, cleanliness, beauty and service time including congestion delay can be categorized as a non-monetary service quality attributes (Moon 2012, p. 2). The quality control of the service is supervised by the person who produces service and is in contact with the customer. Quality control goes for the third rule of the service guideline. According to Grönroos (2001, p. 378), the responsibility of the quality of the service is shared for everyone. Since services being a combination of smaller results of the collaboration, the quality control is more challenging as a whole than comparing with manufacturing. From the customer point of view, the quality of the service has to be correct at the first time. The costs of repair can easily multiply and the damage to the customer has already happened.
The fourth rule of service guidance expresses the process of a customer contact person being a marketer of the service that he or she produces. Every kind of interaction between the service representative and a customer is considered consisting of the elements of marketing. In a competitive situation, maintaining current customers are even more important in the long time span than establish new customer relationships. This is despite the traditional purpose of competition of attract new customers. Good customer knowledge and a tight relationship to a customer provide good prospects for a profitable outcome. Above all marketing efforts and activities, the relevance of price of service has not diminished in any stages of the life cycle of a customer relationship.(Grönroos 2001, p. 379-380)
Information technology is present in the service business but in the future the importance of technology will be more outstanding. Grönroos’s (2001, p. 379-380) fifth rule for service competition is to guarantee the attitudinal and technical preparedness to use technology, systems and physical resources. The same also goes for the employees. The importance of suitable use of resources of different kind is emphasized from the investment point of view and further so that, it does not cause negative effects among the consumers. If there is a resistance or lack of skills among the employees to use technology, the impact can affect both, internal relationships in the organization and external customer relationships. The use of technology enables to produce more personal service, improve working conditions not to mention the increased efficiency of the service operations. Along the technology development, more often machines represent a point of contact rather than employees (Mudie & Pirrie 2006, p. 18).
The last rule of the service competition covers the organizational support. The main task of organizational support is to encourage, motivate, guide, educate and provide required working conditions to perform duties. In service business, the geographical distinction between employees and departments who produce the service together can challenge the decision making process. Consequently, the flexibility due to too many restrictions and rules can harm not only able to serve a customer as an individual but also the employees in the long run. In addition to conjunctionally shared values, mission and vision, the trust and appreciation among all parties assist to produce a high quality service.(Grönroos 2001, p. 380-382)
2.3 Previous ways to increase service demand
At a product level, the fundamental way to gain business growth is by attracting new customers, creating new ways of using the product and achieving premium prices. One of the most used methods for increasing the demand is a brand extension by launching a new product under the existing brand (Vranešević et al. 2007). A brand provides a shortcut for the consumer and they are willing to pay more a branded product. A brand name conveys an increased value and quality of the product in customer’s eyes. In addition, a consumer’s risk and a cost of changing the brand strengthen the brand loyalty (Rugimbana & Nwankwo 2003, p. 96).
Fox et al. (2002) and Singh & Sahay (2012) emphasize the meaning of distance between home and the shopping center. Travel time is one of the predictors of shopping behavior among the retailer marketing policies and household characteristics. In grocery store revenue, the increased promotional intensity and decreased travel times of consumers have an explicit affect the revenue growth. However, the revenue of a mass merchandiser is more sensitive than grocers to increase with promotional efforts.
2.3.1 Used methods in different retail environments
This subchapter is divided into four main themes of used methods and techniques for increasing service demand different retail environments. The chosen themes are layout and visual, marketing and PR, additional and complementary services, and digital and technology based methods. The content in this subchapter is mainly founded on researcher’s observations and experiences.
Similar methods for increasing the service demand and retention of customers can be used in very different spending environments. The usage of floor design as a tool for guiding customers connects the world of gambling and sports retail stores. Sports retail chain, like Stadium, has painted the main passagesto look like real tracks. Casinos, on the other hand, provide a security and visual limits for keeping the underage visitors further away from the game tables. Moreover, the materials that are used in the floors of casinos are often fitted carpets. A soft floor material choice conveys a signal of to slow down on steps and, further, to stay longer in the wanted area.
Casinos like several other retail spaces such as restaurants and retail stores often do not place any clocks on the wall. Additionally, casinos’ gaming halls tend to be windowless preventing the day light coming in and consequently, customers easily stay longer due to the loss track of time. More visual and layout related examples to increase service demand are collected in Table 1.
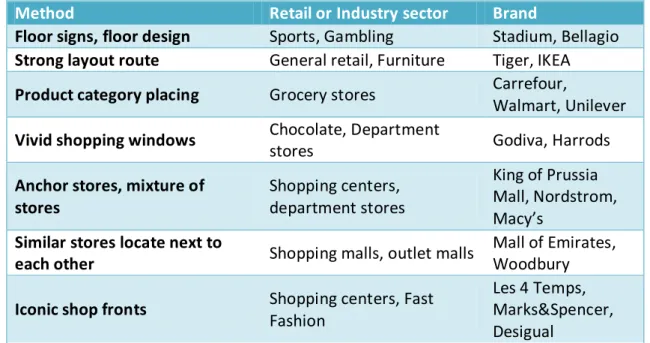
Table 1. Layout and visual based techniques for increase service demand
Method Retail or Industry sector Brand
Floor signs, floor design Sports, Gambling Stadium, Bellagio
Strong layout route General retail, Furniture Tiger, IKEA
Product category placing Grocery stores Carrefour,
Walmart, Unilever
Vivid shopping windows Chocolate, Department
stores Godiva, Harrods
Anchor stores, mixture of stores Shopping centers, department stores King of Prussia Mall, Nordstrom, Macy’s
Similar stores locate next to
each other Shopping malls, outlet malls
Mall of Emirates, Woodbury
Iconic shop fronts Shopping centers, Fast
Fashion
Les 4 Temps, Marks&Spencer, Desigual
There are several other extrinsic factors applied to attract customers to spend more in order to stay longer in the store. A product placing, for instance, is easily observed in most grocery stores. Milk represents a product that customers often want to buy when
visiting a supermarket. Dairy products are often placed at the back of the grocery store and therefore, customers are exposed to all the in-store promotions while heading to milk shelves. Vivid shopping windows are one way to attract not only children but different age groups. A Belgian origin chocolate manufacturer, Godiva, have placed their employees in its New York shopping windows to make strawberries that are dipped into chocolate. A visual proof of “fresh” products and a tempting smell are conveyed to the customers to induce to do an unplanned store visit.
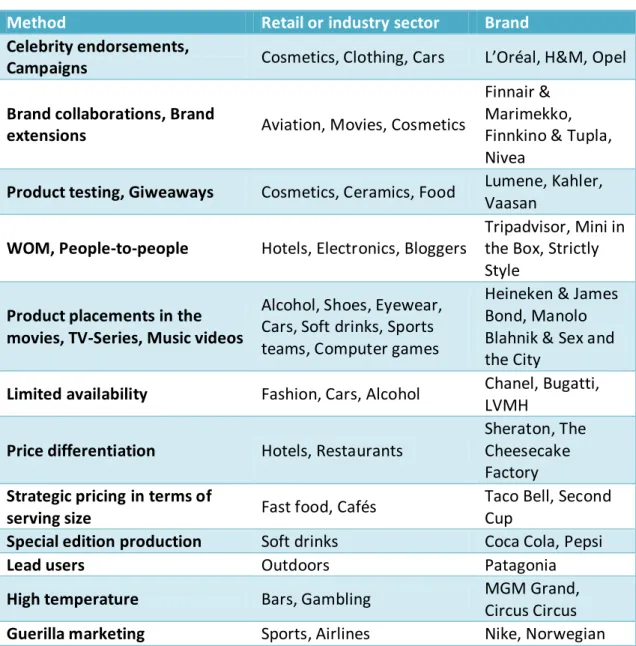
Table 2. Marketing and PR related ways to increase service demand
Method Retail or industry sector Brand
Celebrity endorsements,
Campaigns Cosmetics, Clothing, Cars L’Oréal, H&M, Opel Brand collaborations, Brand
extensions Aviation, Movies, Cosmetics
Finnair & Marimekko, Finnkino & Tupla, Nivea
Product testing, Giweaways Cosmetics, Ceramics, Food Lumene, Kahler, Vaasan
WOM, People-to-people Hotels, Electronics, Bloggers
Tripadvisor, Mini in the Box, Strictly Style
Product placements in the movies, TV-Series, Music videos
Alcohol, Shoes, Eyewear, Cars, Soft drinks, Sports teams, Computer games
Heineken & James Bond, Manolo Blahnik & Sex and the City
Limited availability Fashion, Cars, Alcohol Chanel, Bugatti, LVMH
Price differentiation Hotels, Restaurants
Sheraton, The Cheesecake Factory
Strategic pricing in terms of
serving size Fast food, Cafés
Taco Bell, Second Cup
Special edition production Soft drinks Coca Cola, Pepsi
Lead users Outdoors Patagonia
High temperature Bars, Gambling MGM Grand,
Circus Circus
Guerilla marketing Sports, Airlines Nike, Norwegian In Table 2, ways to increase service demand are presented in terms of marketing and PR. People tend to trust more other customer and acquaintances’ opinions than marketers. The role of word of mouth (WOM) marketing and people-to-people communication are emphasised when trying new services, new products or changing to a new brand. Bloggers and websites like TripAdvisor, eat.fi, Trivago uses WOM and people-to-people communication techniques. Despite all the positive effects of the
people-to-people communication, some of the users’ comment on the internet can be bribed by the service provider.
There are numerous other ways to increase service demand. Price differentiation is widely used practice in terms of location, hourly time of the day, a day of the week and week of the year. After work, happy hours, lunch prices, late night movies, hotel and flight rates are dependent on the fluctuating demand. Intentional or unintentional spread rumours that a notable price level increment of a certain luxury product or product line is coming in the near future can have notable affects sales. Rumours of a price increment can speed up the purchase decision of cautious consumers. Furthermore, rumours that a certain product model will go out of company’s production plan can activate potential investors to get good profits through a customer to customer (C2C) sales channel. The reselling price can get high due to stopped production. Distribution channels, retailers are careful though through. Location of the store in a famous shopping street may increase the brand’s overall image and interest that affects demand other distribution channels like e-commerce and other stores as well.
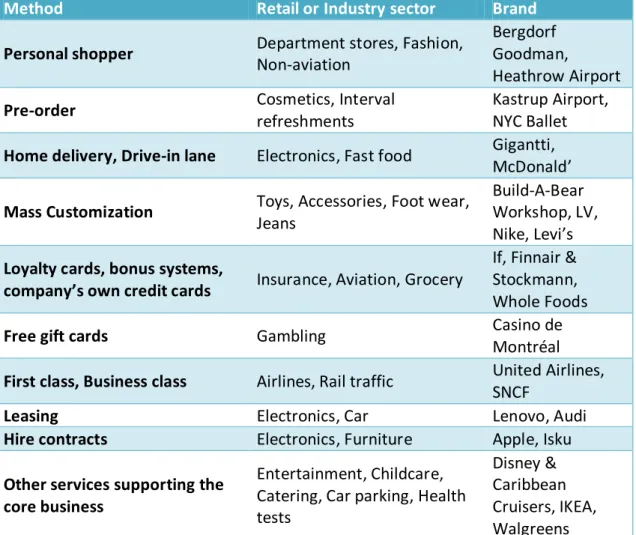
Table 3. Additional and complementary services for increasing service demand
Method Retail or Industry sector Brand
Personal shopper Department stores, Fashion,
Non-aviation
Bergdorf Goodman,
Heathrow Airport
Pre-order Cosmetics, Interval
refreshments
Kastrup Airport, NYC Ballet
Home delivery, Drive-in lane Electronics, Fast food Gigantti, McDonald’
Mass Customization Toys, Accessories, Foot wear,
Jeans
Build-A-Bear Workshop, LV, Nike, Levi’s
Loyalty cards, bonus systems,
company’s own credit cards Insurance, Aviation, Grocery
If, Finnair & Stockmann, Whole Foods
Free gift cards Gambling Casino de
Montréal
First class, Business class Airlines, Rail traffic United Airlines, SNCF
Leasing Electronics, Car Lenovo, Audi
Hire contracts Electronics, Furniture Apple, Isku
Other services supporting the core business
Entertainment, Childcare, Catering, Car parking, Health tests
Disney & Caribbean Cruisers, IKEA, Walgreens
Table 3 represents some of the examples of additional and complementary service methods that are used to increase service demand. A customer’s involvement and engagement during the purchasing process are assured when the company is offering mass customization services. Moreover, highly involved customers have a habit of allocating more time and effort to their product information searches before the actual purchase (Seiders et al. 2005).
An American based company, Build-A-Bear Workshop, that sells teddy bears and stuffed animals practices mass customization in a large scale. A customer and often in this case, a child has a possibility to decide the softness of the teddy bear and choose extra accessories. The possibility to take part of the customization can make customers feel like they are served as individuals and, further, customization creates an emotional connection to the product or service. A Swedish furniture company, IKEA, provides several product and services that support their main business of selling home furniture. Free car parking, restaurant services and free childcare increase the likelihood to add customer’s dwell time at IKEA’s stores.
In the world of gambling, casino operators have invented their own ways to encourage customers to continue playing despite previously lost games. Some Casinos like, Casino de Montréal, provides luxury vacations for the exotic destinations and expensive gift cards of the luxury stores for their regulars if they had lost a notable sum of money. In other context, if an expenditure of consumer goods segment for instance, exceeds over a certain level, customers can be dispensed gift cards to the same chain hotel or restaurant services.
Airlines introduced the business class the first time over two decades ago (Hoffmann & Bateson 2006, p. 468) and that can be categorized into the additional services. The same strategy is applied in other modes of logistics by rail tracks and by sea. It is possible to purchase more spacious cabins on the cruisers and larger hotel rooms for an additional fee. The United Airlines offers extra legroom for passengers and consequently, the seating capacity lowers 5 percent by implication. Despite a reduction of seating places in a plane, United Airlines succeed in accumulating profits because passengers are ready to pay 20 percent more from the additional space while traveling. Airline operators show the importance of business travelers by presenting the shares of different ticket categories. Even though, only 20 percent of the flight tickets are bought by business class customers, they bring 50 percent of the industry profits in total.(Hoffmann & Bateson 2006, p. 469).
Table 4. Digital and technology based methods for increasing service demand
Method Retail or industry sector Brand
RFID, NCF, Self-scanning cashiers, QR-Codes, Bluetooth, iBeacon Grocery, TV-series, Warehouse management, Retail Tesco, Robust North, Walkbase
E-commerce Electronics, Accessories,
Decoration
Best Buy, Neiman Marcus
3D Product design Footwear, Accessories, Car,
Furniture
Nike, Longchamp, Mini Cooper, IKEA
3D Fitting, Digital fitting room
assistants Textile, Shoes, Make-up
AR Door, Goertz Stockmann, L’Oréal
Mobile pay, Contact pay, Wristband payment, Chips
Kiosks, Restaurants, Grocery, Spas, Gambling
Wolt, Fafa’s, Center Parks, Caesars Palace
Reservation systems:
Overbooking, Not numbered seats
Movie theater, Aviation IMAX, SAS
Easy Order, Orders while
queuing Fast food McDonald’s
Websites, Collective
Intelligence Fashion, Accessories Burberry
Digital way finding, 3D Maps Events, Shopping malls,
Airports Slush, Nokia, Changi Digital and technology based methods in terms of increment in service demand are shown in Table 4. QR-codes, NFC, RFID radio wave based technique and Bluetooth are widely used in various circumstances. One example from the outdoor advertising of a television series is a tool called Arilyn. Arilyn combines in its use a QR-code related technology by scanning the code to a mobile device. A company named Robust North is behind the Arilyn that is promised to offer so called “augmented reality”. As a medium, Arilyn enables location related information that can be directed and varying content. The content can be preset and it can include any kind of electronic content such as videos and photos.(Robust North 2014)
One application based on sensors and Bluetooth technology is taking advantage in shopping carts. Cambridge Consultants (2015) invented a low-cost tool for avoiding queues and to accomplish a more personalized shopping experience. So called, smart trolleys, collect a real life data from the customer’s movements within one meter accuracy. Trolleys assist to forecast upcoming congestions near the cashiers and further, the location of sales staff can be identified. Moreover, the smart trolley is able to guide a customer to a specific product offering. Sensors are embedded in the shopping trolleys and energy is developed from the rotation of the wheel of the trolley is harvest to uphold the location system. Cambridge Consultants explained that the high share of an
impulse buying and consumers’ increased frustration of queuing was the starting points for the innovation.
The existence of e-commerce does not necessary mean that the customer flow in store would decrease dramatically. At its best, e-commerce and a physical store support each other. The product can be ordered and purchased online in advance but the delivery of the product is in the physical store. In this way, the customer flow is led to the physical store and the possibility for additional sales is provided. Moreover, the business hours of the physical stores are often longer than regular post offices.(Lehtoaro 2015)
2.3.2 Sensory influencers of service demand
Exterior appearance, interior design and other tangibles create unity that surrounds the service. Even though environmental cues may not directly affect customer’s behavior but their emotional state is influenced. Emotional state, acts as an intermediate to the behavioral reaction of consumers (Bohl 2014). Hoffman & Bateson (2006, p. 225, 243) and Singh & Sahay (2012) emphasize the role of senses and physical environment for customer experience and hedonistic spending. Senses are strained through lighting, architecture, colors, shapes, scents, touch, music and taste. Lightning can set moods, tone, pace and guide consumers to act in a certain way without words. When the space is dimly lit, customers talk more softly, the pace of the service encounter is slower and the service environment is perceived more formal. On the contrary, customers tend to communicate louder, service more fast-tempo and overall environment is perceived more informal, exciting and cheerful when the lightning is bright. Bohl (2014) adds that bright lightning has been linked to a higher level of arousal which is shown to lead higher probability to interaction among people.
Sound as an effect on the retail environment has three main roles of a mood setter, attention grabber and informer. However, music can be perceived as distracting during the high involvement purchase. If the slow-tempo music is played at the restaurant, customers tend to stay longer and on the contrary, fast-tempo music makes people eat faster and cause a high turnover of customers (Hoffman & Bateson 2006, p. 243-244). In a retail environment, slow paced music makes customers move slower and they are more likely to notice a product they are looking for or notice the in-store promotion (Bohl 2014). Consequently, high tempo music can lead to higher total sales. A choice of music can have an indirect affect consumers’ purchase decision. For example, an increased demand in Spanish wines was noticed when the Spanish music was played in the wine section of the grocery store.
All the physical evidences are due to set stimuli and at the same time playing a role for shaping a perception of a service quality (Fodness & Murray 2007). The environmental psychology model is called stimuli-organism-response (SOR). The organism component
describes the recipients of the set of stimuli within the employees and customers. Consumers’ responses or outcomes are characterized as an approach or avoidance behaviors. Individual approach behavior is closely connected with shopping enjoyment, the favorable impressions of the store, amount of money spent and willingness to stay and explore the store longer. In addition to all physical evidences of the consuming environment, the air quality and the temperature have an effect of the mood and general comfort.(Hoffman & Bateson 2006, p. 229, 232, 237)
2.4 Increasing service demand at the airport environment
As a retail environment, the airport attracts consumers form various cultural backgrounds forming a heterogeneous customer base. In order to engage a maximum potential proportion of passengers, it is advisable to offer a wide range of brands and product categories. When it comes to food and other preferences, especially spices and smells are highly connected to the culture. One way of increasing the service demand at the airports is to eliminate barriers to use commercial services and Subchapter 2.4.5 clarifies more the subject.
One of the main justifications for airport operators to invest in non-aeronautical development and research is that airport users’ covers the more diverse range of customer groups (Fuerst & Gross 2014). Consumers being out of their daily routines and familiar environment trigger strong emotions in some consumer segments. Airports, as well as amusement parks and sports stadiums can be grated to be high arousal environments and thus, emotions play a significant role on service demand.
Crawford & Melewar (2003) and Volkova (2009) indicate that airport environment makes customers react and act in unusual ways due to ambient unique retail environment and travelers’ experience feelings of excitement, anxiety and stress. Particularly increased levels of stress, anticipation and excitement are strongly linked to the impulse buying behavior. Volkova (2009) also sums up the airport shopping being all about affecting the time period called “happy hour”. The so called “happy hour” origins from the moment when the passenger receives the boarding pass and the levels of stress are low but excitement remains high. When considering transfer passengers, the “happy hour” could start when the passenger has arrived on time for the hub and has recently pass the security check.
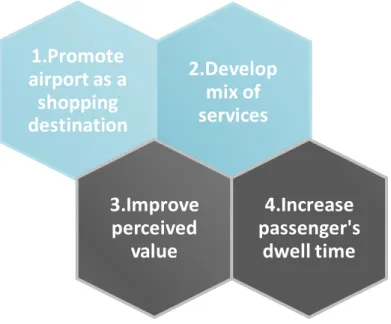
Figure 3. Four keys to increase service demand at the airport (DKMA 2013, modified) Nearly 30 000 passengers from fifteen different airports from Europe, Asia and North America took part of the DKMA’s study in 2013. The study highlights four main objects to increase service demand at the airport environment that are represented in Figure 3. The methods are a promote airport as a shopping destination, a good develop mix of services, improve perceived value and increase passenger’s dwell time.
The first highlighted characteristic is a promoting airport as a shopping destination that pursues passengers’ mental image to plan their shopping before they even arrive at the airport. A passenger who had the intention to buy something at the airport had eight times more likely to buy duty free, six times higher likelihood to purchase retail and three times more likely to consume on F&B. Furthermore, they consume 40 percent more on duty free, 39 percent more on F&B and 24 percent more on retail than an average passenger. The challenge is that only a small share of passengers plans their buying at the airport in advance. For instance, only 16 percent of those passengers that pre-planned their spending had an intention to buy something from the retail section (DKMA 2013). The corresponding share of directed pre-planned spending in F&B and duty free is twice higher than retail.
In order to increase the share of passengers that pre-plan their spending, informing the passengers of retail opportunities before they reach the airport has a noteworthy role. Chung et al. (2013) emphasise friends and relatives’ recommendations in addition to personal experiences to be the most preferred source of information in terms of pre-planning spending at the airport. A website also plays a significant role for conveying the wanted message of shopping possibilities and taking advantage of where the purchase decisions of will be made. Furthermore, the availability of the contact information of airport retail operators and ease of enquiring a specific product for
2.Develop
mix of
services
1.Promote
airport as a
shopping
destination
3.Improve
perceived
value
4.Increase
passenger's
dwell time
example increases the likelihood of making purchases at the airport.
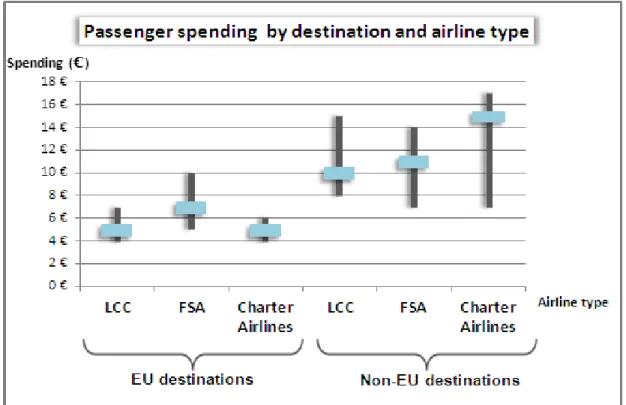
A wide range of different kind of retail and F&B services stand for the second phase of the DKMA’s guideline. In this way, the attention of as wide range group of passengers as possible is being attracted. A diverse selection of brands and product categories strengthen the overall satisfaction (Singh & Sahay 2012) and airport experience. Satisfaction levels are determined by expectations that are subtracted from the predominant perceptions (Mudie & Pirrie 2006, p. 8; Kumar & Thakur 2014). The third object for increasing service demand at the airports is improving the perceived value of retail and service offering. More than 45 percent of the passengers, who had the intention to buy non-duty free retail, ended up buying nothing (DKMA 2014). Providing better value does not automatically mean lower price and better product quality. Perceived value can be increased by adding personal service and experiment. Dwell time and its increment are listed as a fourth rule to follow. More about dwell time and its impact on service demand is examined in Subchapter 2.4.3. As the transfer passengers’ time is limited at the airport, the consumption is commonly concentrated on either shopping or using the F&B services. Volkova & Müller (2012) expect transfer passengers to spend more on F&B due to longer travel time.
Despite the limiting factors in the context of the airport shopping, passengers prone to choose the store which the overall image fits the image they hold themselves. Passengers who identify themselves origin from various social backgrounds may select the stores of different fashion status from others (Rugimbana & Nwankwo 2003, p. 342). One of the notable competitive edges at the airports is the lower price level of certain product categories due to the legitimate statute of duty-free purchases. In the higher price category, the price advantage between buying a product from the airport than the store from the center of the city can be an outstanding amount of money. According to the researcher’s observation, it is not unprecedented that people plan their trip and flight connections depending on in which terminal the desired store and product is located. In these deviant situations, the wanted product is typically an exclusive and limited edition kind of luxury product.
Airport service operators have competitive edge comparing with other service operators at the centers of the cities. Due to legal rights, they are able to offer products without taxes. The ability to provide exclusive products, product sizes and package designs, new products in store before other distribution channel bring advantage over competitors. Chung et al. (2013) have found out in their study that passengers prefer to use wandering as a source of information of services before taking an advantage of airport maps. A good service visibility and availability ease the barrier to passengers to enter the commercial space and use the service. Further, the strong presences of well-known brands give a shortcut to the content and the quality of the product for passengers. Additionally, a supply of services that are not available anywhere else in the country
besides the airport gives an additional attention and interest towards the service operator.
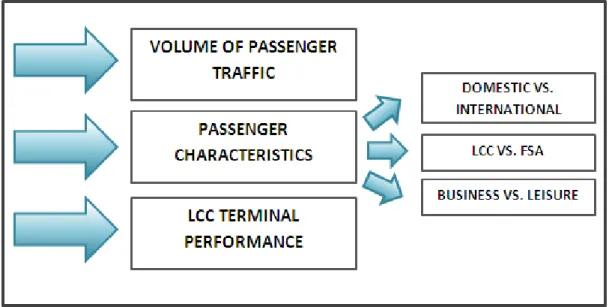
2.4.1 Determinants and measures of non-aviation revenue
Based on the research, made by Volkova & Müller (2012), there are three main determinants reflecting in the turnover of the non-aviation operations (Figure 4). A size of the airport, passenger types and a low cost carrier (LCC) terminal performance represent the characteristics of the revenue generation. The airport size alone does not give required information but a volume of passenger traffic is used as an indicator of the size of the airport. Passenger characteristics are divided into three subgroups of domestic and international passengers, LCC and Full Service Airline (FSA) passengers, business and leisure passengers. The favour of the LCC can be noticed from the increment of the seating capacity from 11 percent in the year of 2002 to 39 percent in 2013 (Bush & Storey 2013, p. 21).
Figure 4. Illustration of three main determinants of non-aviation reven