Ekonomi Sumber Daya Alam
dan Lingkungan
Berly Martawadaya
Direktur Program INDEF, Ekonom UI dan Pengurus Pusat ISEI
Disampaikan dalam ISPE IV INDEF Jakarta, 10 Agustus 2017
Circular
Flow in
Economy
Eksternalitas Sebagai Kegagalan Pasar
• Eksternalitas, adalah efek samping atau dampak yang dihasilkan dari
aktifitas (ekonomi)
• Eksternalitas Negatif (External Diseconomy) Contoh: Limbah
pabrik.
• Externalitas Positif (External Benefit) Contoh: Kelestarian
lingkungan yang dijaga dan dapat dinikmati oleh semua orang
Contoh Kasus Eksternalitas
Market allocations of commodities causing pollution externalities:
1. The output of the commodity is too large. 2. Too much pollution is produced.
3. The prices of products responsible for pollution are too low.
4. As long as the costs are external, no incentives to search for ways to yield less pollution per unit of output are introduced by the market.
5. Recycling and reuse of the polluting substances are discouraged because release into the
environment is so inefficiently cheap.
The effects of a market imperfection for one commodity end up affecting the demands for raw materials, labor, and so on. The ultimate effects are felt through the entire economy.
Analisis Cost-Benefit
• Upaya internalisasi eksternalitas dengan mengidentifikasi keuntungan
dan kerugian dari aktifitas ekonomi.
If B > C, Support the action, else No
If B/C > 1, support the action, else No
B= Benefit
C= Cost
Environment & Natural Resource Economics
Internalizing externalities!!
The Economics of Ecosystems and Biodiversity: The Ecological and Economic Foundations
14
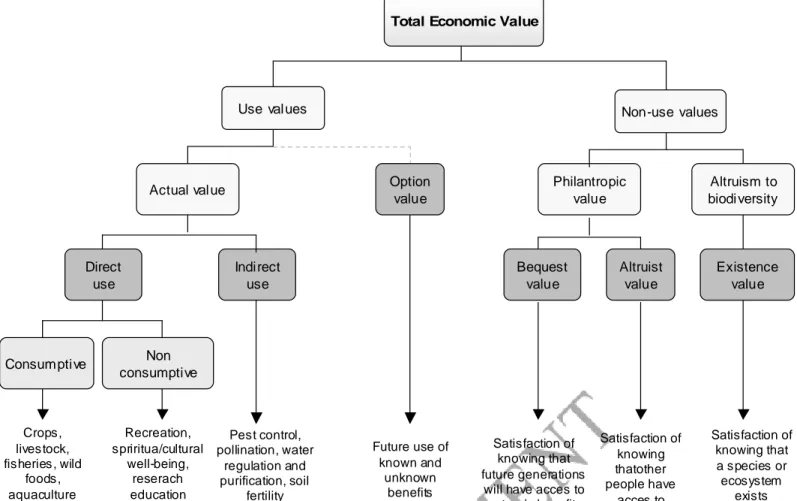
Figure 3: Value types within the TEV approach
Figure 3 reviews the value types that are addressed in the literature on nature valuation. Boxes in dark gray and the examples below the arrows are those that are directly addressed by value elicitation methods related to the TEV framework.
Table 1: A typology of values
Value type Value sub-type Meaning
Use values Direct use value Results from direct human use of biodiversity (consumptive or non consumptive).
Indirect use value Derived from the regulation services provided by species and ecosystems Option value Relates to the importance that people give to the future availability of
ecosystem services for personal benefit (option value in a strict sense). Non-use
values
Bequest value Value attached by individuals to the fact that future generations will also have access to the benefits from species and ecosystems (intergenerational equity concerns).
Altruist value Value attached by individuals to the fact that other people of the present generation have access to the benefits provided by species and ecosystems (intragenerational equity concerns).
Existence value Value related to the satisfaction that individuals derive from the mere knowledge that species and ecosystems continue to exist.
Indirect use Recreation, spriritua/cultural well-being, reserach education Crops, livestock, fisheries, wild foods, aquaculture Pest control, pollination, water regulation and purification, soil fertility Philantropic value Existence value Satisfaction of knowing that a species or ecosystem exists Satisfaction of knowing that future generations
will have acces to nature’s benefits Satisfaction of knowing thatother people have acces to nature’s benefits Non-use values Future use of known and unknown benefits Consum ptive
Total Economic Value
Non consumptive Direct
use
Use values
Actual value Altruism to biodi versity Altruist value Bequest value Option value
Market Base Environment Instrument
Proceedings of the 6th Annual AARES National Sy mposium, 2003
Whilst MBIs generally reduce the compliance costs faced by operators, especially at an industry level, as noted earlier the overall cost to society may also be significantly less – where MBIs are
appropriately applied. In many instances, MBIs will not be the most efficient policy response. There are a number of reasons why, including the relative homogeneity of sources or costs or measurement and monitoring issues, and these are discussed in Section 3.3.
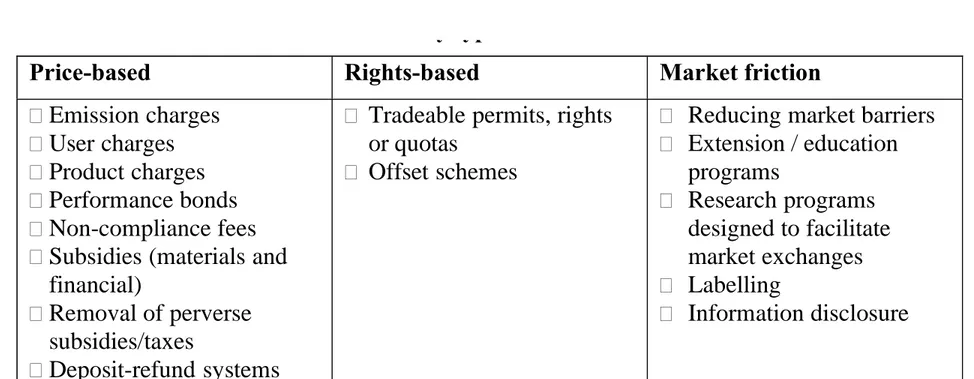
Despite the challenges and modest application of market instruments to date, an impressive range of MBIs has been employed in Australia and other OECD countries. Key instrument types are shown in Table 3.1.
Table 3.1: Market-based instruments by type
Price-based Rights-based Market friction •Emission charges
•User charges •Product charges •Performance bonds •Non-compliance fees •Subsidies (materials and
financial)
•Removal of perverse subsidies/taxes
•Deposit-refund systems
•Tradeable permits, rights or quotas
•Offset schemes
• Reducing market barriers • Extension / education programs • Research programs designed to facilitate market exchanges • Labelling • Information disclosure
3.3 What characteristics underpin effective MBIs?
Despite the potential advantages of MBIs there are a number of design issues and preconditions that are important to their success. Design issues relate to the regulatory and enforcement aspects of
MBIs. Preconditions for effective outcomes relate to the nature of the industries that are impacting or generating the environmental outcome of importance and the broader institutional environm ent.
3.3.1 Regulatory design issues
MBIs are based on the principle of voluntary actions in response to price signals. Use of the price mechanism to convey incentives is attractive to governments as the market performs the detailed allocative task of identifying who shall reduce pollutant discharges or increase the provision of ecosystem services. However, actions in response to price signals in traditional markets are
conditional on ownership of the rights or responsib ility, ability to measure the response and sanctions where promised actions are not undertaken. In addition to these more traditional problems there is often a fear that environmental rules and regulations will change through tim e discounting the
significant investment involved in changing behavi our and outcomes by government and industry. These are aspects of regulatory design in market-based instruments.
The rights and responsibilities underpinning MBIs dete rmine who pays and who benefits. For many environmental goods and services these rights and responsibilities are not well defined. Hence, regulations stating definition a nd allocation may need to accompany and support the MBI. For
example, allocating responsibility to firms for their emissions facilitates emissions charges and taxes. Similarly, allocating a right to emit is necessary to implement a rights-based mechanism. Definition of the rights and responsibilities sets up an inherent tension in the application of MBIs. Regulations are often necessary to codify rights or responsibilities but are resented or feared by firms. Where stakeholders are cautious or even oppose MBIs the problem can be compounded (Hockenstein, Stavins and Whitehead 1998).
Energi dan Eksternalitas Negatif
• Biaya eksternalitas sejumlah energi terbarukan lebih rendah
• Energi fosil saat ini cenderung lebih jika hanya berdasarkan kepada harga pasar
• Jika biaya eksternalitas negatif ini dimasukkan dalam harga, maka energi terbarukan akan menjadi sumber energi yang murah terutama untuk angin, panas bumi, dan biomassa
• Di sini lah peran pemerintah dalam mengoreksi eksternalitas negatif
• Dengan harga yang “tepat”, akan memberikan sinyal yang kuat baik kepada pelaku usaha, konsumen, dan pemerintah bahwa energi fosil tidak menguntungkan secara ekonomi
• Mengakhiri perdebatan energi murah vs energi bersih
Natural
Resource
Curse
35
Table 1: Economic Role and Composition of Mining in Indonesia, 1971-2010
1971 1980 1990 2000 2010
A. Mining in the economy
Mining GVA as % of GDP 7.3 25.7 12.5 12.7 11.1 Mining exports as % of exports 22.9 72.2 27.4 15.0 24.5 Mining as % of total employment 0.2 0.7 1.0 0.9 1.2
B. Sectors as % of total mining GVA
Crude petroleum, natural gas 84.6 94.9 81.7 69.7 42.1
Coal 0.0 0.0 1.9 8.9 21.8
Copper ore - 0.4 2.7 5.6 11.4
Gold and silver ore - 0.0 0.6 4.7 5.6
Tin ore 4.4 1.7 0.7 1.0 1.4
Nickel ore 1.3 0.2 2.0 2.5 0.5
Bauxite 0.7 0.1 0.1 0.0 0.5
Other metallic ores* 0.2 0.0 0.1 0.1 0.6
Non-metallic mining and quarrying** 8.7 2.6 10.2 7.5 16.0 Total mining sector 100.0 100.0 100.0 100.0 100.0
C. Exports as % of gross output
Crude petroleum, natural gas 62.2 84.4 50.9 38.8 39.0
Coal 0.0 37.6 47.4 56.9 70.0
Copper ore - 104.0# 96.7 94.2 62.2
Gold and silver ore - 0.0 0.1 0.0 0.0
Tin ore 53.1 14.1 1.1 0.0 0.3
Nickel ore 94.0 56.9 80.3 59.9 84.0
Bauxite 100.0 89.5 67.5 76.4 90.9
Other metallic ores* 59.4 21.9 19.2 2.3 40.2
(Sub-total metallic ores) (64.1) (36.1) (67.6) (49.8) (42.0) Non-metallic mining and quarrying** 0.0 0.6 2.6 4.6 2.7
Total mining sector 56.5 80.7 46.6 39.6 41.6
*mainly iron and manganese ores. **includes copper, gold and silver in 1971.
#
number exceeding 100 implies exports of stockpile.
Notes: Calculated from data in current market prices; excludes GVA in related manufacturing
(e.g. oil refining, LNG production, basic metals manufacturing etc).
Source: Calculated from IDE (1977) and BPS (1975-2005), see the Appendix; the data from
the 2010 I-O Table are provisional; the 2010 share in employment is from Indonesia’s National Labour Force Survey (Sakernas).
38
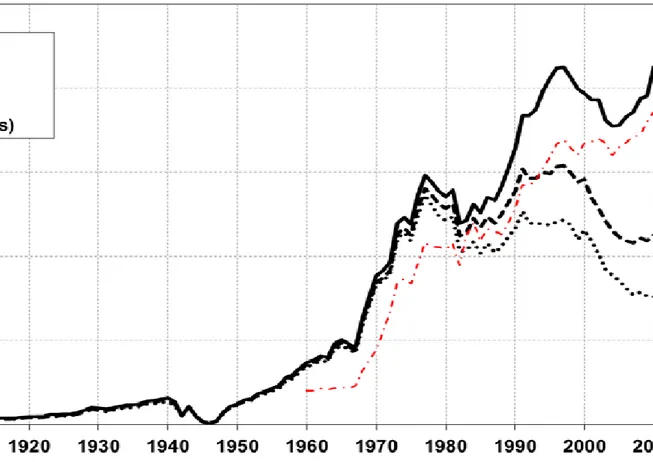
Figure 1: Gross Value Added in Mining, 1870-2010 (billion 2000 Rupiah)
Sources: Calculated from a wide range of sources comprising data on production and prices
39
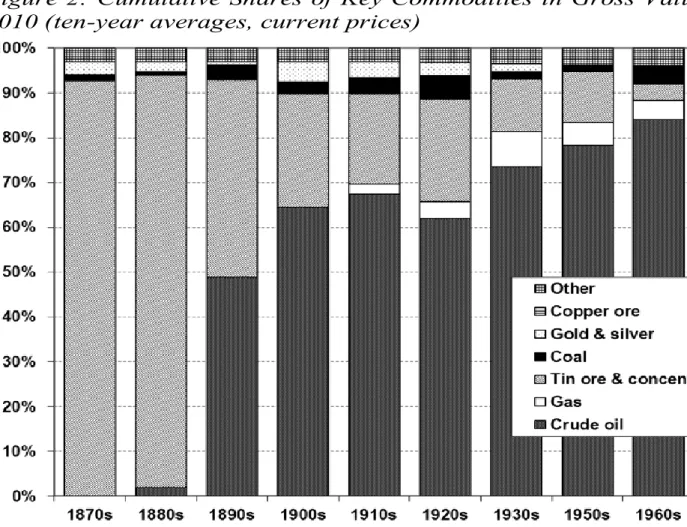
Figure 2: Cumulative Shares of Key Commodities in Gross Value Added in Mining, 1870-2010 (ten-year averages, current prices)
40
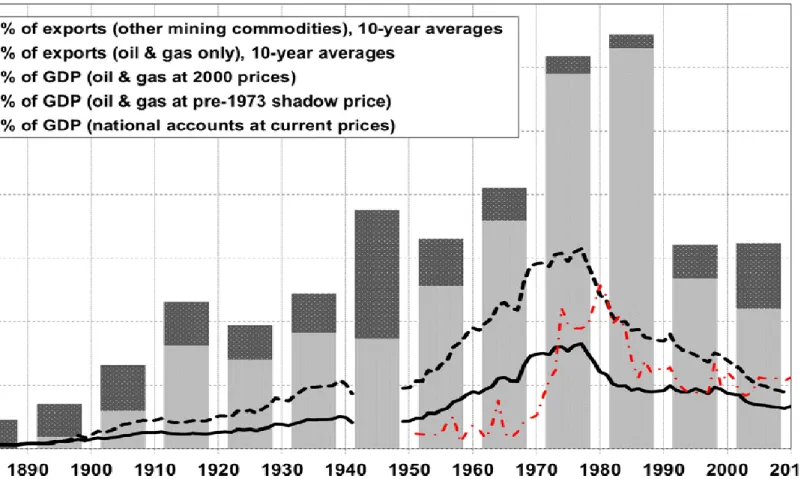
Figure 3: Shares of Mining Commodities in Exports and of Mining Gross Value Added in GDP, 1870-2010 (percentages)
Notes: No data 1942-45 for foreign trade and 1942-48 for GDP. Van der Eng (2010) only
contains GDP estimates in 2000 prices, not current prices. Nominal oil and gas prices in Indonesia rose by a factor of 465 from 1973 to 2010, while nominal prices of all other goods and services combined rose by a factor of 180. The share of oil and gas GVA in GDP in 2000 prices is therefore also estimated with just 40% of GVA in oil and gas as a proxy for the contribution of oil and gas to total GVA at an assumed pre-1973 shadow price.
Sources: Calculated from Indonesia’s foreign trade statistics 1870-2010, see the Appendix;
Indonesia’s national accounts in current prices 1951-2010; GVA in Mining in 2000 prices, see Figure 1; GDP in 2000 prices 1880-2010 Van der Eng (2010), replacing the old estimates of total GVA in mining with the ones in Figure 1.
41
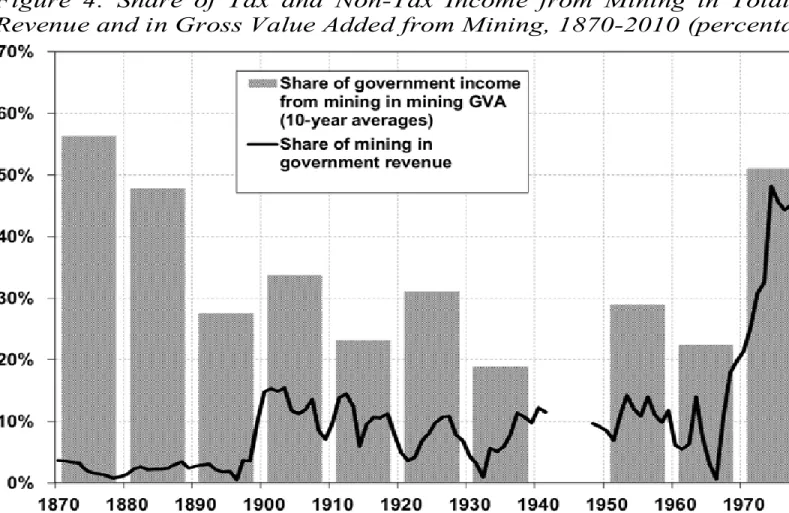
Figure 4: Share of Tax and Non-Tax Income from Mining in Total Central Government Revenue and in Gross Value Added from Mining, 1870-2010 (percentages)
Notes: No data for 1942-47. 1870-1940 comprises net government income from tin, coal,
gold and silver mining, revenues from mining concessions, dividends from NIAM and GMB joint ventures, oil industry crisis levy in the 1930s, mining export duties and mining company tax (both estimated from totals in proportion to the share of mining in exports), and excludes income from the salt monopoly; 1948-2010 comprises 1948-66 mining company tax and 1948-2010 mining-related export duties (both estimated from totals in proportion to the share of mining in exports), 1952-59 net transfers from all SOEs, 1960-72 net transfers from SOEs Permina and Pertamina, 1967-89 oil company tax, 1990-2010 non-tax revenue from mining, 1994-2010 net profit transfers by SOEs (mining SOEs were predominant), 1999-2010 income tax from oil and gas firms.
Sources: Mining GVA in current prices, see the Appendix; government income 1870-1940
calculated from Encyclopedia (Vol.1: 750-758; Vol.7: 154-163), Mulder (1938), and budget papers included in Bijlagen bij de Handelingen van de Staten Generaal (1870-1940) and
Bijlagen bij de Handelingen van de Volksraad (1918-1942); 1948-2010 from Nota Keuangan Negara (1948-1959), Statistik Keuangan (1960-89), Statistik Ekonomi dan Keuangan Indonesia (1990-2010).