Performance Evaluation of Estimators for Porphyry Copper Resource Modeling
Waterman Sulistyana Bargawa1,a, Sulfajar Asmaul2,b
1,2Master of Mining Engineering, UPN Veteran Yogyakarta Indonesia
a[email protected] b[email protected]
Abstract:
Mineral resource modeling is very useful for mine planning. The modeling process starts from the data entry, statistical analysis, variography calculation, construction of 3D models with block size determination, and the selection of appropriate methods for estimating grades. The problem is the selection of appropriate estimation methods suitable geological conditions and mineralization. Case study in this research is porphyry copper deposit modeling using geostatistical methods. Verification of the geological model and evaluate the performance of each estimator undertaken to produce the most suitable estimator for the modeling of the porphyry copper ore. Based on statistical analysis and verification of the models and composite data, it can determine the most accurate estimator in the resource modeling of porphyry copper ore.
Keywords: resource modeling, geostatistics, porphyry copper
1. Introduction
Modeling of resources and reserves mineral becomes very important because the ore geological model can yield information about the 3-D distribution of ore grade. This is very useful for mine planning and design. The problem is to determine an accurate estimator in the estimation of ore grade in accordance with the conditions of geology and mineralization. Many estimation methods developed in the estimation of ore grades [1,2]. The conventional method for example, inverse distance weighting (IDW) and unconventional methods such as kriging are techniques for the estimation of ore grade [3]. Another problem is how the determination procedure concerning the accuracy of the estimator in ore resource modeling.
the variogram [5]. Theoretically, kriging is an optimal interpolation method, based on the determination of the spatial structure obtained from the calculation of variography and the selection of accurate variogram models [6]. Gundogdu and Guney (2007), Uyan and Cay (2010) use the variogram to describe the spatial variability structure [7]. Variogram has an important role in data analysis geostatistics, using the method of kriging. Variogram always take into account the spatial autocorrelation in the data to create a mathematical model of the spatial correlation structure through variogram.
Based on the above discussion, the research carried out to evaluate these estimation techniques in porphyry copper resource modeling. The estimation technique we use in this study are ordinary kriging, simple kriging, inverse distance squared (ID2) and neighborhood nearest point. The purpose of this study is to evaluate the performance of estimators used in porphyry copper resource modeling, to determine the procedure of statistical analysis, and to compare visually between model and raw data.
2. Material and Methods
This research has identified 30 types of rocks based on data from 123 boreholes. To facilitate block modeling, the authors classified into eight rock types. Overburden, consists of gravel and fluvial material, not mineralized. Volcanic, covering rhyolite, andesite and basalt, mineralized. Sediment, composed of mudstones, siltstones, chert, and graywacke found in the northern part of the orebody. Lag, monzonite collapse without displacement of fragments form a supergene layer. Supergene monzonite, a process of economic mineralization in the mid Jurassic quartz monzonite; based on mineralogy supergene monzonite distinguished by hypogene; these rocks contain copper, chalcocite, hematite, clay and carbonate; supergene zone usually consists of a low copper content, but the content of gold is higher than the hypogene zone; supergene monzonite covers about 20% of ore deposit. Hypogene monzonite, covers about 70% of ore deposit, consists of pyrite, chalcopyrite, bornite, and molybdenite. Tertiary sediments, rocks that formed after the mineralization process, composed of a conglomerate, basalt, siltstones, greywacke and others. Undefined is the last rock type.
Mineral grade estimation method using geostatistical method begins with basic statistics data analysis. In addition, to describe the data we use basic statistics data analysis. Based on the assay and composite database, the next stage is variography calculation and estimation grade. Variogram fitting, here utilizing spherical function formulated as [8],
γ(h)=
{
0,C0 C0
+c
[
1.5(
|h|a
)
−0.5(
|h|
a
)
3]
|h|≥a h=00<|h|≥ a (1)
^
Z(B)=
∑
i=1
N
λiz
(
xi)
,(2)
and the weights sum to 1. The prediction variance of Z(B) is now
var
[
Z
^
(
B
)
]
=
Ε
[
{
Z
^
(
B
)
−
z
(
B
)
}
2]
=2
∑
i=1
N
λi¯γ
(
xi, B)
−∑
i=1
N
∑
j=1N
λiλjγ
(
xi−xj)
−¯γ(B , B),(3)
where ´γ=(xi, B)is the average semivariance between data point xi and the target
block B, and ´γ=(B , B) is the average semivariance within B, the within block variance.
The next step in kriging is to find the weights that minimize the kriging variances subject to the constraint that they sum to 1. The equivalent kriging system for blocks is
∑
i=1N
λiγ
(
xi−xj)
+ψ(B)=¯γ(
xj−B)
for all j
∑
i=1N
λi=1
(4)
ψ(B) is a Lagrange multiplier purposed to achieve minimization and the block kriging variance is obtained as
σ2(B)=
∑
i=1
N
λiγ
(
xi, B)
+ψ(B)−¯γ(B , B)(5)
Ordinary kriging has assumption of intrinsic stationary easily satisfied and robustness in the face of deviations. There are situations where we can draw on assumptions rather strong second-order stationary on average a constant, which we might know or can assume. Under these circumstances we can improve our predictions with simple kriging. Krige estimates are still linear number of the data, but now they combine mean, μ. The equation for a simple block kriging is [9]:
^
Z(B)=
∑
i=1
N
λiz
(
xi)
+{
1−∑
i=1
N
λi
}
μ.(6)
C, rather than semivariances. The equations to be solved as expressed in the simple block kriging system are
∑
i=1 NλiC
(
xi, xj)
=C(
B , xj)
for j = 1, 2,…, N (7)
Because the mean is assumed to be known so Lagrange multiplier is not exist again. The simple kriging variance is given by
σ
SK2
(B)=C(0)−
∑
i=1
N
λiC
(
xi, B)
(8)
where C(0) is the variance of the random process.
Inverse distance weighting applies a weighting factor, which based on linear or exponential distance function to each sample surrounding the central point of ore-block. The weighting factor is the inverse of the distance between each sample and the block centre, raised to the power ‘n’, where ‘n’ usually varies between 1 and 3 as below [10], but in this case we will utilize the power ‘2’ or we can call it inverse distance squared.
ZB=
∑
i=1
n
(
Zi/din)
/¿∑
i=1
n
(
1/din)
¿ (9)where: ZB= estimation grade Zi= grade sample
di= distance between ZB and Zi
Based on topography, geological information, and parameter estimation, 3D model of porphyry copper ore deposit was made. Digitization of topographic maps produce topographic model. Based on 123 drill holes, assay database and composite database created for further processing. Construction models are made with a block size of x = 15, y = 15, z = 15. Theoretical variogram fitting based on a spherical model, current anisotropy parameters are ellipsoid plunge = 0, ellipsoid bearing = 99, ellipsoid dip = 0, major/semi-major = 1.719; major/minor= 3.123. Current variogram parameters are nugget (C0) = 0.218, sill (C) = 0.840, total sill (C0 + C) = 1.058, range= 556.951 meters.
3. Results and Discussion
This research categorizes data from 123 drill holes into 30 types of rock, and simplified into eight rock types. Resource modeling and estimation of porphyry copper ore using a mining software. The parameters of the estimation consists of maximum number of samples is 10, minimum number of samples is 3, variogram model are spherical with parameters of nugget = 0.218, C = 0.840, sill = 1.058, range = 556.951 meters. In this research the grade estimation technique is OK, SK, IDS (inverse distance square), and NNP (neighborhood nearest point).
between the model and the composite. Analysis of the probability curve shows the performance evaluation of the various estimators. Fig.1 shows the probability curve of composite and OK, SK, IDS, NNP estimators. Based on the cumulative probability curve, it shows four estimators have similar performance, and relatively coincide.
Figure 1. Curve of probability cumulative
0 0.5 1 1.5 2 2.5
0 0.2 0.4 0.6 0.8 1 1.2
f(Composite) f(OK) f(SK)
f(IDS) f(NNP)
Table 1 shows the results estimated grade using the OK, SK, IDS, and NNP. Average grade of estimates indicate the similar value of OK, SK, IDS, NNP respectively 0.4876; 0.4886; 0.4899; 0.4837. CV value of composite is relatively low (0.7), it allows estimate results of four methods to be relatively similar. CV of each estimations of OK, SK, IDS, and NNP is 0.6032; 0.6035; 0.6539; 0.7200. Due to the smoothing effect, CV value of OK and SK is lower than IDS and NNP.
Table 1. The comparison of statistic parameters between composite and each methods
Statistic Parameters Composite OK SK IDS NNP
Minimum (%) 0.0100 0.0108 0.0046 0.0103 0.0100
Maximum (%) 2.1100 1.3617 1.3698 1.7190 2.1100
Mean (%) 0.4847 0.4876 0.4886 0.4899 0.4837
Median (%) 0.4400 0.4576 0.4566 0.4548 0.4400
Standard deviation (%) 0.3479 0.2941 0.2948 0.3203 0.3483
Variance (%)2 0.1210 0.0865 0.0869 0.1026 0.1213
CV 0.7177 0.6032 0.6035 0.6539 0.7200
Skewness 0.7556 0.4471 0.4581 0.5900 0.7711
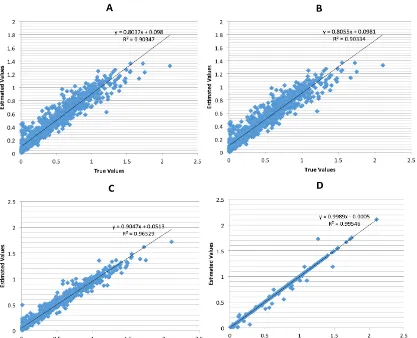
Performance evaluation of the estimator conducted by comparing models and composite using cross-validation [11]. The cross-validation approach use 1129 data. Fig.2 below shows cross validation of composites versus estimates of OK, SK, IDS, and NNP.
The following discussion based on the results of the regression of Fig.2 and Table 2. NNP gives the greatest weight to the nearest sample, so that the estimated value equal to the value of the nearest sample. Other samples were not considered in the estimation. In the analysis of XY-plot (see Fig.2), the estimated grade always be the same as the composite, so that estimates be biased.
Table 2. The comparison of regression statistic between composites and four estimation methods
Regression Statistic OK SK IDS NNP
SEE 9.143 9.171 5.971 2.348
slope 0.804 0.806 0.905 0.999
y-int 9.805 9.811 5.133 -0.049
r 0.951 0.950 0.982 0.998
Based on the value of the SEE, slope, Y-intercept, and r, OK, SK estimates showed similar values, but the IDS estimates indicate better performance. If the value of the CV data is close to 0.5, then the entire estimator has a similarity value of the estimated grade. These results are in line with another research [12], when the CV is less than 0.4, OK has lower error than IDW; when CV is between 0.4 - 0.8, the OK method has a higher interpolation error than IDW. The solution is data can be separated into several populations and variography carried out over to get a better variogram parameters and grade estimation performed on each population data.
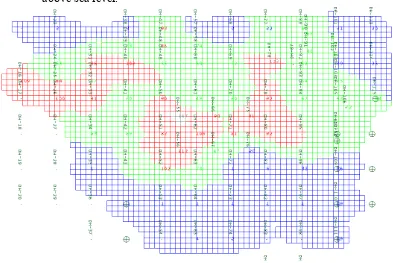
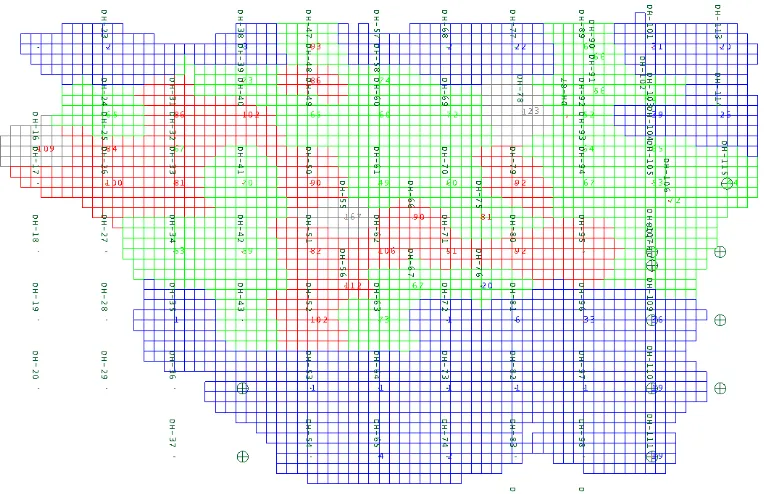
Analysis of the performance of the other estimators is to compare composite and model. Analysis of all visual estimation techniques shown in the plan view map, where: blue = 0 to 0.4% Cu, green = 0.4-0.8% Cu, red = 0.8 to 1.2% Cu, grey = 1.2 to 99% Cu.
Figure 3. SK estimation of block model section on the elevation 1282.5 meters above sea level.
Figure 5. IDS estimation of block model section on the elevation 1282.5 meters above sea level.
Based on Figure 3, 4, 5, 6, SK, OK, IDS method relatively provide color trend, which is similar to composite. While most of the trend of the NNP methods produce good estimates, but in some locations such as in Figure 6 shows a composite grade, which is red, but the NNP methods provide estimates that are colored green (underestimation), and some locations produce a grey color (overestimation). SK methods, OK and IDS, providing the same color trends except in high grades (gray), IDS provides a better estimate than SK and OK. Based on the correlation coefficient NNP method should produces a value of one because at the same location gives the same result with a composite value. In all three methods SK, OK, IDS provides the correlation coefficient close to one. But the IDS method provides higher correlation coefficient than SK and OK.
Table 3 shows the results of porphyry copper resources modeling and estimation (density factor 2.69 tons/m3).
Table 3. Resources estimation results of copper deposit.
Grade Cu
(%) 0.0 - 0.4 0.4 - 0.8 0.8 - 1.2 1.2 - 1.6 1.6 - 2.0 2.0 - 2.4
Tonnes OK 197,816,883 152,650,102 58,803,063 1,443,521 0 0 Avg Grade
OK (%) 0.22 0.58 0.93 1.26 0 0 Tonnes SK 198,443,317 150,616,462 60,055,931 1,597,860 0 0 Avg Grade
SK (%) 0.22 0.58 0.93 1.26 0 0 Tonnes IDS 194,321,565 152,641,023 61,254,326 2,469,420 27,236 0 Avg Grade
IDS (%) 0.22 0.58 0.93 1.28 1.69 0 Tonnes NNP 207,540,225 130,488,873 61,690,106 9,496,372 1,234,710 263,283 Avg Grade
NNP (%) 0.18 0.56 0.96 1.32 1.72 2.11
models.
4. Conclusion
Based on the basic statistics CV value is 0.7. OK, SK, IDS, NNP estimators relatively provide similar estimates in porphyry copper resource modeling. Results of linear regression analysis and visual analysis between the estimation model compared to composites can be concluded that the model IDS provides slightly better than the OK, SK, NNP methods on modeling of this porphyry copper resources.
Reference
1. Bargawa, W. S. (2016, July). Mineral resource estimation using weighted
jackknife kriging. In ADVANCES OF SCIENCE AND TECHNOLOGY FOR
SOCIETY: Proceedings of the 1st International Conference on Science and Technology 2015 (ICST-2015) (Vol. 1755, No. 1, p. 120001). AIP Publishing. 2. Bargawa, W. S., Rauf, A., & Amri, N. A. (2016, February). Gold resource
modeling using pod indicator kriging. In PROGRESS IN APPLIED
MATHEMATICS IN SCIENCE AND ENGINEERING PROCEEDINGS (Vol. 1705, p. 020025). AIP Publishing.
3. Bargawa, W. S., & Amri, N. A. (2016, February). Mineral resources estimation based on block modeling. In PROGRESS IN APPLIED MATHEMATICS IN SCIENCE AND ENGINEERING PROCEEDINGS (Vol. 1705, p. 020001). AIP Publishing.
4. Olea, R. A. (1991). Geostatistical glossary and multilingual dictionary (No. 3). Oxford University Press on Demand.
5. Miller, J., Franklin, J., & Aspinall, R. (2007). Incorporating spatial dependence in predictive vegetation models. Ecological modelling, 202(3), 225-242.
6. Isaaks, E. H., Srivastava, R. M. (1989). Applied Geostatistics. New York: Oxford University Press.
7. Almasi, A., Jalalian, A., & Toomanian, N. (2014). Using OK and IDW methods for prediction thespatial variability of a horizon depth and OM in soils of Shahrekord, Iran. Agrochimica, 58(1).
8. Cressie, N. (1993). Statistics for spatial data: Wiley series in probability and statistics. Wiley-Interscience, New York, 15, 105-209.
9. Oliver, M. A., & Webster, R. (2015). Basic steps in geostatistics: the variogram and kriging. Springer International.
10. Annels, A. E. (1991). Mineral Deposit Evaluation: a practical approach. London: Chapman & Hall.
11. Oliver, M. A., & Webster, R. (2014). A tutorial guide to geostatistics: Computing and modelling variograms and kriging. Catena, 113, 56-69.