Free Basic Education
Strategy Development
Volume 5
Survey of Parental Contributions in Basic Education
Published by:
Education Sector Analytical and Capacity Development Partnership (ACDP) Agency for Research and Development (BALITBANG), Ministry of Education and Culture Building E, 19th Floor
Jl. Jendral Sudirman, Senayan, Jakarta 10270 Tel.: +62-21 5785 1100, Fax: +62-21 5785 1101 Website: www.acdp-indonesia.org
Secretariat email: [email protected]
Printed in April 2017
The Government of Indonesia (represented by the Ministry of Education and Culture, the Ministry of Religious Affairs and the Ministry of National Development Planning/ BAPPENAS, the Australian Agency for International Development (AusAID), the European Union (EU) and the Asian Development Bank (ADB) have established the Analytical and Capacity Development Partnership (ACDP) as a facility to promote policy dialogue and institutional and organizational reform of the education sector to underpin policy implementation and help reduce disparities in provincial and district education performance. The facility is an integral part of the Education Sector Support Program (ESSP) which consists of EU sector budget support with agreed arrangements for results-led grant disbursement, and earmarked policy and program-led AusAID sector development grant support consisting of a school infrastructure program, a nationwide district and school management development program and a program to accelerate the GOI’s accreditation of private Islamic schools. This report has been prepared with grant support provided by AusAID and the EU through ACDP.
The institutions responsible for implementation of the study were PT. TRANS INTRA ASIA in cooperation with the Institute of Public Administration of Canada (IPAC).
The Consultants Who Prepared This Report Are:
1. Chris Majewski, Team Leader/Basic Education Policy and Governance Expert 2. Achmadi Ringoringo, Education Finance Expert
3. Robertus Soeharno, PFM & Decentralization Expert 4. Umaedi, Capacity Development Expert
5. I Made Sumertajaya, Data Analyst
6. Jeffry Fanciscus Haloho, Research Assistant
The views expressed in this publication are the sole responsibility of the authors and do not necessarily represent the views of the Goverment of Indonesian, the Goverment of Australia, The European Union or the Asian Development Bank.
Free Basic Education Strategy Development
Volume 5
Survey of Parental Contributions in Basic Education
Free Basic Education
Strategy Development
Volume 5
ACDP – 006
Free Basic Education Strategy Development
Table of Contents
Survey of Parental Contributions in Basic Education Report Page i
TABLE OF CONTENTS
TABLE OF CONTENTS ... I LIST OF TABLES ... III LIST OF ILLUSTRATIONS ... IV ABBREVIATIONS AND ACRONYMS ... V
1. BACKGROUND AND CONTEXT ... 1
2. SAMPLING ... 1
2.1. Structure Of The Sampel ... 1
2.2. Comment On The Sample ... 3
3. MAIN FINDINGS OF THE SURVEY ... 4
3.1. Total Parent Contributions To Basic Education ... 4
3.2. Parent Contributions To School/Madrasah Budgets ... 6
3.3. Details Of Parental Contributions As Reported By Schools/Madrasahs ... 7
3.4. Difference Between Parents' And Schools'/Madrasahs' Reporting Of Level Of Parental Contributions ... 8
3.5. Use Made Of Parental Contributions By Schools/Madrasahs ... 9
3.6. Relationship Between Parental Contributions And Per-Student Cost ... 9
3.7. Willingness Of Parents To Make Contributions To Basic Education ... 10
3.8. Impact Of Bos Funds And Policy On Free Basic Education On Parental Contributions To Basic Education ... 12
3.9. Principals' Perceptions Of Impact Of No Fees On Education Quality ... 17
3.10. Relationship Between School Budgets, Parent Funding And Student Learning Outcomes ... 18
4. CONCLUSIONS ... 19
APPENDIX 1 IMPLEMENTATION OF SURVEY ACTIVITIES ... 21
ATTACHMENTS (IN CD) 1. DATA
a. Parent Survey Data b. School Survey Data
c. Susenas Education Module Data d. Field Label for Susenas Data
e. Variable Label for School Survey Data f. Variable Label for Parent Survey Data
2. REPORT
a. Draft Parent Survey Report (Indonesian) b. Final Survey Report
c. Final Parent Survey (English)
3. OTHER SURVEY DOCUMENTS
a. Notice to participants b. List of sample schools c. Sample distribution
ACDP – 006
Free Basic Education Strategy Development
Table of Contents
Survey of Parental Contributions in Basic Education Report Page ii
h. Field work guidelines
i. Activity Implementation Guidelines
j. Guidelines for Completion of Parent Questionnaires
This document is Volume 5 from the Free Basic Education Strategy Development. The full report comprises nine volumes:
• Volume 1. Final Report
• Volume 2. Free Basic Education Conceptual Framework
• Volume 3. Analysis of School Operational Funds
• Volume 4. Financing Projections To 2020 For Implementation Of Free Basic Education
• Volume 5. Survey Of Parental Contributions In Basic Education
• Volume 6. Human Resource And Institutional Capacity Development Strategy To Support Implementation Of Free Basic Education Report
• Volume 7. Support for poor families in meeting the personal costs of basic education
• Volume 8. Accountability framework
ACDP – 006
Free Basic Education Strategy Development
Table of Contents
Survey of Parental Contributions in Basic Education Report Page iii
LIST OF TABLES
Table 1. Distribution of the sample: area and type of school/madrasah ... 1
Table 2. Sample of schools: government and private ... 2
Table 3. Distribution of schools by standard of accreditation ... 2
Table 4. Distribution of parents in the sample ... 3
Table 5. Total parent expenses per student for basic education 2010-2011 (madrasahs) ... 4
Table 6. Total parent expenses per student for basic education 2010-2011(schools) ... 5
Table 7. Proportion of parent expenditure on education as school/madrasah fees ... 6
Table 8. Average total budgets for and sources of funding for schools/madrasahs ... 6
Table 9. Parent contributions as a percentage of school/madrasah budgets ... 7
Table 10. Detailed parent contributions as reported by schools/madrasahs ... 7
Table 11. Total payments to schools/madrasahs for the 2010-2011 school year as reported by parents and schools/madrasahs. ... 8
Table 12. Relationship between per-student cost and parental contributions ... 10
Table 13. Willingness of parents to make a contribution to the cost of educating their children, in order to improve the quality of education offered. ... 10
Table 14. Size of contribution to basic education parents are willing to make ... 11
Table 15. Average total parents’ costs for basic education per student per year 2003 - 2009 (values in nominal and constant Rp 2011) ... 12
Table 16. Percentage of parents not paying any school/madrasah fees 2003 - 2011 Data 2003-2009 from Susenas, data 2011 from ACDP survey ... 13
Table 17. Average total parents’ costs for basic education by are 2003 - 2009 (values in constant 2011) ... 14
Table 18. Principals' perception of the impact of elimination of parental contributions on the quality of education ... 17
Table 19. Percentage of principals' identifying a negative impact on education quality of elimination of parental contributions to education, by area of negative impact (principals able to nominate more than one area of impact) ... 17
Table 20. Relationship between increasing per-student cost and learning outcomes ... 18
Table 21. List of Provinces and Districts/Municipalities in the Sample ... 23
Table 22. Amount of sample schools and parents in each selected province and district ... 24
Table 23. Details of Supervisor Training Activity ... 25
Table 24. List of survey areas for each supervisor ... 26
Table 25. Schedule of Field Survey Implementation ... 27
Table 26. Type of data collected from each respondent ... 28
Table 27. Details of Assignment for Each Areal Supervisor ... 29
Table 28. Details of Assignment for Each Field Surveyor ... 29
Table 29. List of Supervised Survey Areas ... 30
ACDP – 006
Free Basic Education Strategy Development List of Illustrations
Survey of Parental Contributions in Basic Education Report Page iv
LIST OF ILLUSTRATIONS
Illustration 1. Total Parent Expenses for Basic Education ... 5 Illustration 2. Average Parent Expenditure on Basic Education by Area ... 14 Illustration 3. Major Parent Expenses by Category, Primary schools, Susenas 2003 - 2009. ... 15 Illustration 4. Major parent expenses by category, primary madrasahs, Susenas 2003 -
2009. ... 15 Illustration 5. Major Parent Expenses by Category, Junior Secondary Schools, Susenas
2003 - 2009. ... 16 Illustration 6. Major Parent Expenses by Category, Junior Secondary Madrasahs,Susenas
ACDP – 006
Free Basic Education Strategy Development
Abbreviations and Acronyms
Survey of Parental Contributions in Basic Education Report Page v
ABBREVIATIONS AND ACRONYMS
ACDP Analytical and Capacity Development Partnership
ADB Asian Development Bank
AusAID Australian Agency for International Development
Bappeda Regional Agency for Development Planning (Badan Perencanaan Pembangunan Daerah) Bappenas National Agency for Development Planning (Badan Perencanaan Pembangunan
Nasional)
BOS School Operations Funds (Bantuan Operasional Sekolah) BSM Scholarships for Poor Students (Bantuan Siswa Miskin)
EMIS Education Management Information System
FBE Free Basic Education
FGD Focus Group Discussion
GoI Government of Indonesia
HLTWG High Level Technical Working Group
MI Primary Madrasah (Madrasah Ibtidaiyah)
MoEC Ministry of Education and Culture
MoF Ministry of Finance
MoHA Ministry of Home Affairs MoRA Ministry of Religious Affairs
MSS Minimum Service Standards
MTs Junior Secondary Madrasah (Madrasah Tsanawiyah)
NES National Education Standard
SD Primary School (Sekolah Dasar)
SMP Junior Secondary School (Sekolah Menengah Pertama)
SNP National Education Standards (Standar Nasional Pendidikan) SUSENAS National Socio-Economic Survey (Survei Sosial Ekonomi Nasional) TNP2K National Team for Accelerating Measures for Countering Poverty
ACDP - 006
Free Basic Education Strategy Development
Main Text
Survey of Parental Contributions in Basic Education Report Page 1
1. BACKGROUND AND CONTEXT
The Survey of Parent Contributions to Basic Education was required as a deliverable of ACDP 6, Free Basic Education Strategy. Its draft methodology and instruments were approved as a part of the project's Inception Report. Documents outlining the survey's methodology and instruments are provided as Appendices 1 - 8. The sample size of the survey, as proposed in the Inception Report, was to include 4,032 parents from 336 schools/madrasahs in 14 districts/cities. Budgetary constrains resulted in the sample having to be reduced to 2,781 parents in 228 schools/madrasahs in 10 districts/cities.
The study was carried out to establish the education-related costs borne by parents of children in basic education. In addition, data gathered from the schools/madrasahs in the sample included information about their total budgets and total contributions received from parents during the 2010/2011 school year, as well as information about how these funds were used.
By utilising data from the Education and Social Module of the National Economic and Social Survey (Susenas), the study was also able to analyse the trends in parental contributions over time, and the effect of the provision of School Operational Funding (BOS) on parents’ expenditure in educating their children. The Education and Social Module is administered every three years, with the most recent one administered in 2009. Data for years 2003, 2006, and 2009 were analysed to determine overall trends in parents’ contributions over time including an analysis of the change in sub-sets of the expenses such as fees, uniforms, snacks and transport.
2. SAMPLING
2.1. Structure of the Sampel
The methodology used to design the sample was multi stage stratified random sampling. The survey provinces were chosen first on the basis of broad geographical coverage, and then on their degree of development as determined on the basis of a range of factors including gross domestic product and education participation rates. The selection of districts/cities was similarly made on the basis of degree of development.
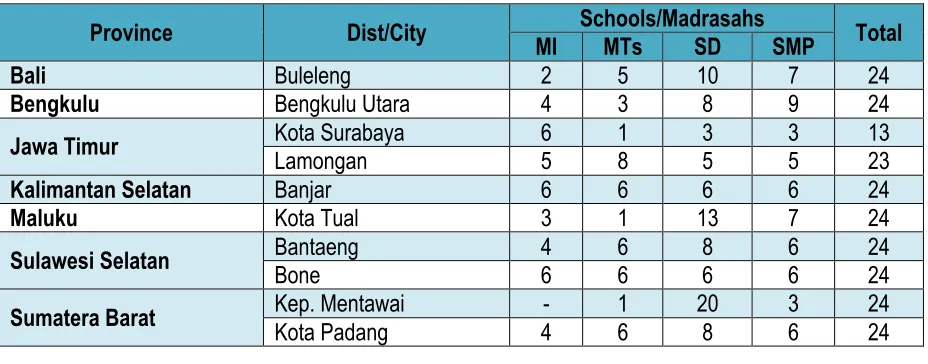
The selection of schools was made to ensure representation of each of the main kinds of education institutions delivering basic education: schools and madrasahs, primary and junior secondary, government and private. See Tables 1 and 2, below.
Table 1. Distribution of the sample: area and type of school/madrasah
Province Dist/City Schools/Madrasahs Total
ACDP - 006
Free Basic Education Strategy Development
Main Text
Survey of Parental Contributions in Basic Education Report Page 2
Province Dist/City Schools/Madrasahs Total
MI MTs SD SMP
Total 40 43 87 58 228
Table 2. Sample of schools: government and private
Schools/madrasahs
Total
MI MTs SD SMP
Government 17 11 69 33 130
Private 23 32 18 25 98
Total 40 43 87 58 228
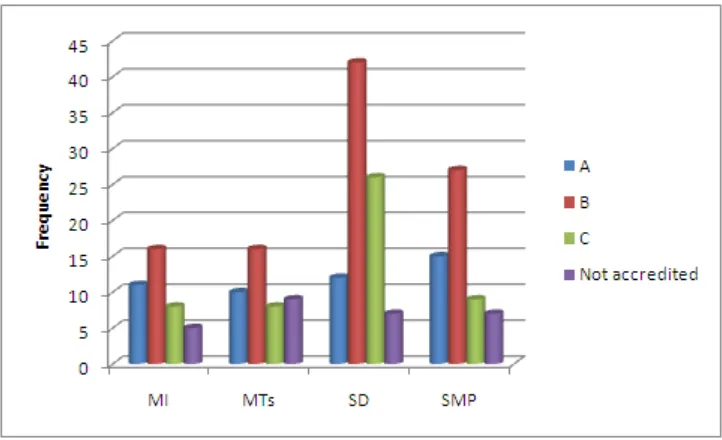
The schools/madrasahs were also chosen on the basis of their level of accreditation, taken to be an indirect indicator of quality.
Table 3. Distribution of schools by standard of accreditation
Accreditation Schools/madrasahs Total
MI MTs SD SMP
A 11 10 12 15 48
B 16 16 42 27 101
C 8 8 26 9 51
Not accredited 5 9 7 7 28
ACDP - 006
Free Basic Education Strategy Development
Main Text
Survey of Parental Contributions in Basic Education Report Page 3
The survey targeted 12 parents from each of the schools/madrasahs as per Table 4, below.
Table 4. Distribution of parents in the sample
Province Dist/City Type of sch/mad Total
MI MTs SD SMP
Bali Buleleng 24 60 120 84 288
Bengkulu Bengkulu Utara 48 36 96 108 288
Jawa Timur Kota Surabaya 66 24 48 84 222
Lamongan 49 96 59 60 264
Kalimantan Selatan Banjar 72 72 72 72 288
Maluku Kota Tual 36 12 156 84 288
Sulawesi Selatan Bantaeng 48 72 96 76 292
Bone 72 72 72 72 288
Sumatera Barat Kep. Mentawai - 11 233 33 277
Kota Padang 45 72 97 72 286
Total 460 527 1,049 745 2,781
2.2. Comment on the sample
ACDP - 006
Free Basic Education Strategy Development
Main Text
Survey of Parental Contributions in Basic Education Report Page 4
The limitations of the sample size mean that the data generated are illustrative only, and are not representative of Indonesia. They are also not able to be compared directly with the data generated by Susenas which is much more representative.
3. MAIN FINDINGS OF THE SURVEY
3.1. Total parent contributions to basic education
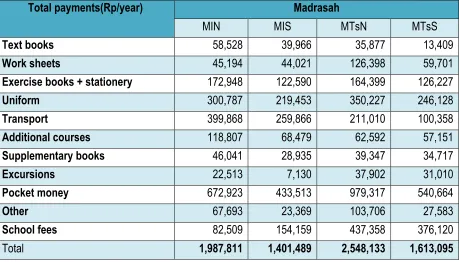
The survey found that parents in all types of schools/madrasahs made substantial contributions to the cost of providing basic education to their children (Tables 5 and 6, below). Costs of junior secondary students were generally higher than those of primary students, except for students in private MTs's, who tend to come from the lowest socio-economic strata of Indonesian society.
The highest categories of cost incurred by all parents were pocket money, student transport and uniforms. School fees were a major expenditure item in secondary schools/madrasahs, with those in private SMPs being the highest, followed by government MTs. The cost of pocket money may appear high, but it is common in Indonesia for parents to give children money to buy a "snack" on a school day. There is no mandated number of days on which Indonesian children have to attend school, but given an average of around 200 effective school days in a year, the average value of pocket money given to a student on a school day ranges from approximately Rp 4,900 in government MTs to Rp 2,200 in private MIs.
Table 5. Total parent expenses per student for basic education 2010-2011 (madrasahs)
Total payments(Rp/year) Madrasah
MIN MIS MTsN MTsS
Text books 58,528 39,966 35,877 13,409
Work sheets 45,194 44,021 126,398 59,701
Exercise books + stationery 172,948 122,590 164,399 126,227
Uniform 300,787 219,453 350,227 246,128
Transport 399,868 259,866 211,010 100,358
Additional courses 118,807 68,479 62,592 57,151
Supplementary books 46,041 28,935 39,347 34,717
Excursions 22,513 7,130 37,902 31,010
Pocket money 672,923 433,513 979,317 540,664
Other 67,693 23,369 103,706 27,583
School fees 82,509 154,159 437,358 376,120
ACDP - 006
Free Basic Education Strategy Development
Main Text
Survey of Parental Contributions in Basic Education Report Page 5
Table 6. Total parent expenses per student for basic education 2010-2011(schools)
Total payments(Rp/year) School
SDN SDS SMPN SMPS
Text books 22,219 70,399 35,269 41,901
Work sheets 58,633 80,070 90,478 65,931
Exercise books + stationery 180,502 211,682 186,477 160,997
Uniform 257,160 288,144 257,030 286,536
Transport 343,347 498,364 266,535 150,682
Additional courses 85,304 163,972 124,069 88,631
Supplementary books 30,052 73,246 72,577 60,588
Excursions 10,860 11,221 28,296 17,699
Pocket money 494,886 590,558 829,750 698,300
Other 12,127 35,007 83,686 91,693
School fees 54,043 173,857 352,565 628,410
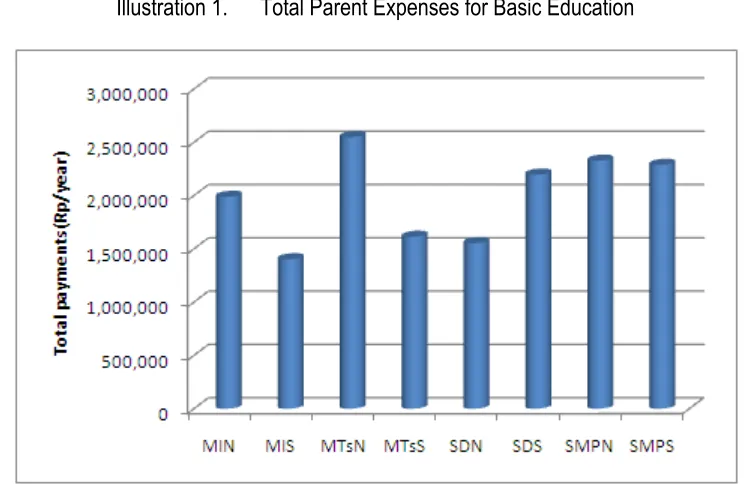
Total 1,554,133 2,196,520 2,326,732 2,288,368
Illustration 1. Total Parent Expenses for Basic Education
The proportion of parental expenditure on education consumed by schools fees, defined as any contribution paid directly to the schools or school committees, varies substantially, being only 3.5% for government SDs, but 27.5% for private SMPs and 23.3% for private MTs's (Table 7, below). It can be noted that, for comparison, the recently completed ACDP study on Madrasah Funding found that in the five provinces where the study was conducted, the average parent contribution to the budgets of private MTS's was 31%.
end-of-ACDP - 006
Free Basic Education Strategy Development
Main Text
Survey of Parental Contributions in Basic Education Report Page 6
year examinations. It is therefore possible that some of the parents tended to report costs related to 2011-2012 rather than 2010-2011.
Table 7. Proportion of parent expenditure on education as school/madrasah fees
Type of school/mdrs. Gov/ private % percentage of expenditure as school/madrasah fees
3.2. Parent contributions to school/madrasah budgets
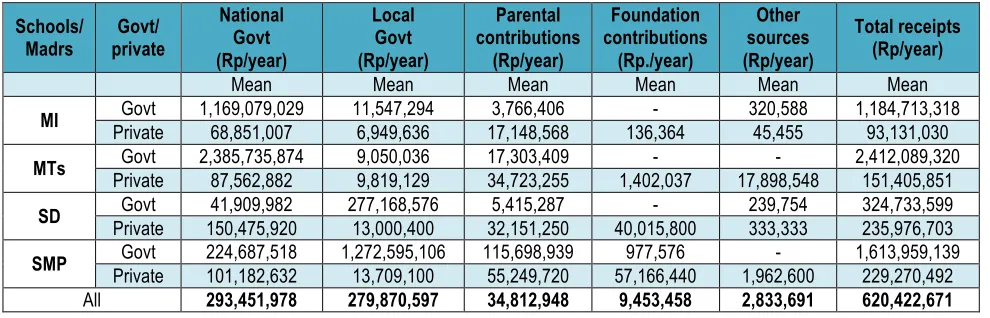
Average total budgets of the school/madrasahs in the survey are provided in Table 8, below. The table, sourced from school annual reports for the 2010-11 school year, also identifies the sources of funding including governments, parents and foundations.
Table 8. Average total budgets for and sources of funding for schools/madrasahs
Schools/
Private 68,851,007 6,949,636 17,148,568 136,364 45,455 93,131,030
MTs Govt 2,385,735,874 9,050,036 17,303,409 - - 2,412,089,320
Private 87,562,882 9,819,129 34,723,255 1,402,037 17,898,548 151,405,851
SD Govt 41,909,982 277,168,576 5,415,287 - 239,754 324,733,599
Private 150,475,920 13,000,400 32,151,250 40,015,800 333,333 235,976,703
SMP Govt 224,687,518 1,272,595,106 115,698,939 977,576 - 1,613,959,139
Private 101,182,632 13,709,100 55,249,720 57,166,440 1,962,600 229,270,492
All 293,451,978 279,870,597 34,812,948 9,453,458 2,833,691 620,422,671
ACDP - 006
Free Basic Education Strategy Development
Main Text
Survey of Parental Contributions in Basic Education Report Page 7
Table 9. Parent contributions as a percentage of school/madrasah budgets
It is of concern that parental contributions to school budgets are particularly high in the private madrasah sector. It is generally accepted that the school communities served by these madrasahs tend to be the poorest. A recent study of madrasah financing in eight district completed by ACDP also shows that parent contributions constituted more than 25% of the budgets of private madrasahs.
Another concern is that schools and madrasahs with a low accreditation status, or with no accreditation to date, tend to have the highest percentage of their budgets funded from parental contributions. Non-accredited private MTs's and SMPs have the highest levels of parental contributions, at 27% and 28.2% respectively.
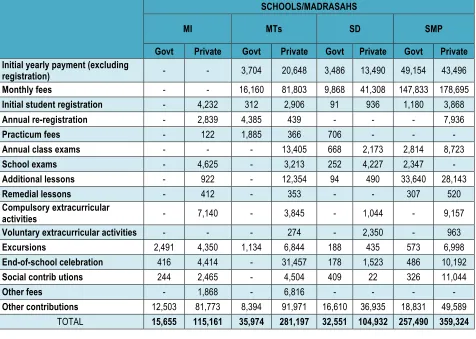
3.3. Details of parental contributions as reported by schools/madrasahs
Table 10. Detailed parent contributions as reported by schools/madrasahs
SCHOOLS/MADRASAHS
Other contributions 12,503 81,773 8,394 91,971 16,610 36,935 18,831 49,589
TOTAL 15,655 115,161 35,974 281,197 32,551 104,932 257,490 359,324
Schools/ Madrasahs Gov/ private % of budget from parent contributions
ACDP - 006
Free Basic Education Strategy Development
Main Text
Survey of Parental Contributions in Basic Education Report Page 8
The data shows that parents of secondary students tend to make larger contributions than do parents of primary students, with the exception of government MTs, which report their parents making low average contributions, averaging only Rp 35,974 per year. Both private SDs and private MIs report parent contributions larger than those of their government equivalents.
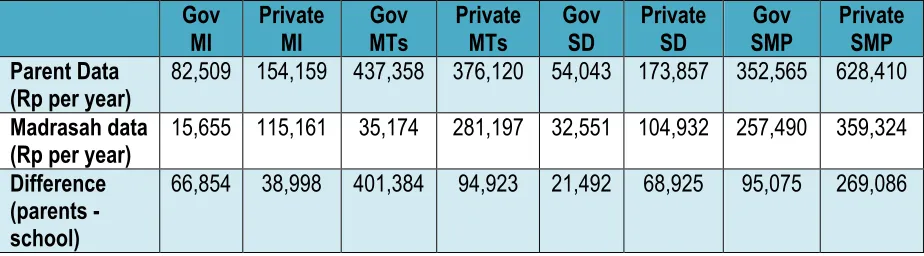
3.4. Difference between parents' and schools'/madrasahs' reporting of level of parental contributions
Parents report higher payments to schools/madrasahs than the parent payments identified in school annual reports. The difference between these two sets of reports is provided in Table 11, below.
Table 11. Total payments to schools/madrasahs for the 2010-2011 school year as reported by parents and schools/madrasahs. significantly larger payments than are recorded in the schools'/madrasahs' financial reports. There are several possible explanations for this phenomenon:
1. the payments which parents report making to schools/madrasahs are exaggerated;
2. the parent sample is unrepresentative of the parents of the schools/madrasahs in the sample; 3. administrators of the schools/madrasahs, in particular the principals, under-report the receipts
from parents;
4. some payments made by parents are made to the school committees rather than to school accounts, and some, like payments for science practical activities are paid directly to teachers, and are not reported by the school; and
5. payment for additional courses offered by schools/madrasahs may not be included in their reports.
It is accepted that the parent sample for each school/madrasah is not representative of Indonesian parents, since 17.1% had a post-secondary qualification as opposed to 5.2% as identified by the 2010 census. It is also possible that it is not representative of the parent bodies in the sample schools. The survey data shows that among parents who made payments to schools/madrasahs, the median payment of those with post-secondary qualifications, at Rp 240,000 per year, was 145% of the Rp 165,000 paid by parents without such qualifications.
ACDP - 006
Free Basic Education Strategy Development
Main Text
Survey of Parental Contributions in Basic Education Report Page 9
replaced some of these with other forms of payments. A 2011 paper published by the Institute for Development Studies of the University of Sussex also reports that the practice of soliciting funds from parents and not reporting on those funds is not unusual in the Indonesian education system. A 2010 study undertaken for the Australian Indonesian Basic Education Partnership found that even in the most remote and poor schools, around one-third of school committees engaged in fund-raising.
As documented in Illustrations 1 - 4 (below), Susenas data shows that between 2003 and 2009, payment for courses offered by schools increased markedly. In 2006, these payments had risen to an average of around Rp 100,000 per student in SDs and MIs, and just over Rp 160,000 per student in SMPs and MTs's. Table 10 (above) shows that schools/madrasahs report only small amounts of parent contributions which could be assigned to this category.
In addition to collecting copies of the 2010/11 school/madrasah budgets, the ACDP survey also obtained copies of their reports on the use of BOS funding. It is a formal requirement that this report identifies and reports on all sources of funding, but only less than 10% reported on any sources of funding other than BOS, strengthening the presumption that money raised from parents by school committees and parent associations is frequently not reported by schools/madrasahs. It is important that this practice be addressed and remedied.
A detailed examination of the differences between what the parents report to have paid to the schools/madrasahs and what those institutions report to have received shows that there are two other items of expenditure which stand out in particular. The parents of all schools/madrasahs report much higher charges for registration costs, both for new and returning students. Those in private schools and in government madrasahs, both primary and junior secondary, report substantially higher monthly fees than are reported by the schools/madrasahs.
3.5. Use made of parental contributions by schools/madrasahs
An examination of the use which schools and madrasahs make of parental contributions reveals that there is a worrying lack of transparency in how the use of these funds is reported. On average, 42% of the expenditure of parents' contributions is assigned to the category of "other". Of the other 16 categories of expenditure only one is substantial, with 35% assigned to teacher salaries and other teacher allowances. The next highest expenditure item reported relates to facilities, which consumed 5% of the contributions. There is a clear need for fuller reporting of the use of parental contributions, and for demonstrating the relationship between such expenditure and the schools'/madrasahs' educational or developmental priorities.
3.6. Relationship between parental contributions and per-student cost
Average per-student costs in the surveyed schools/madrasahs show a wide variation, ranging from a high of Rp 6,696,000 in government MIs to a low of Rp 966,000 in private MIs. The relationship between per-student cost and the proportion of parental contributions is demonstrated in Table 12,
ACDP - 006
Free Basic Education Strategy Development
Main Text
Survey of Parental Contributions in Basic Education Report Page 10
Table 12. Relationship between per-student cost and parental contributions
Schools/
The data in Table 12 shows that there is an inverse relationship between per-student costs and parent contributions. Where the cost is higher, the proportion of government contribution is high and the parent contribution low, and where the per-student cost is low the government contribution is proportionally low and the parent contribution high. it is very noticeable that government madrasahs, both primary and junior secondary, have a particularly high per-student cost, but receive a proportionally small parent contribution.
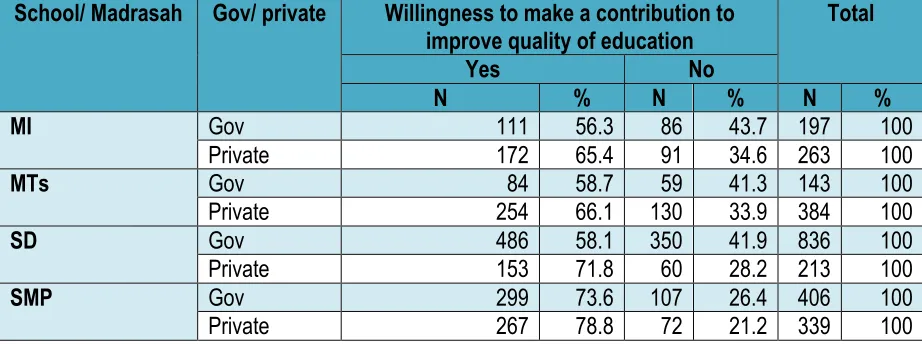
3.7. Willingness of parents to make contributions to basic education
Parents participating in the survey were asked whether they were willing to make a contribution to the operations of their children's schools/madrasahs in order to improve the quality of education offered. Table 11, below, summarises their responses.
Table 13. Willingness of parents to make a contribution to the cost of educating their children, in order to improve the quality of education offered.
ACDP - 006
Free Basic Education Strategy Development
Main Text
Survey of Parental Contributions in Basic Education Report Page 11
contribution because they did not believe any funds provided by them would be used to improve the quality of education.
Willingness of parents to make contributions was highest among schools/madrasahs with highest level of national accreditation (A), and lowest among those with lowest accreditation (C), probably indicating that the perceived quality of a school/madrasah has an impact in this regard.
Parents from all schools/madrasahs indicated that among budget items to which they were prepared to contribute, teacher wages and incentives rated very highly. The only items rated more highly were laboratories for SMPs. These also rated highly among parents of MTs's, both private and government. Student excursions and books for libraries generally rated lowest.
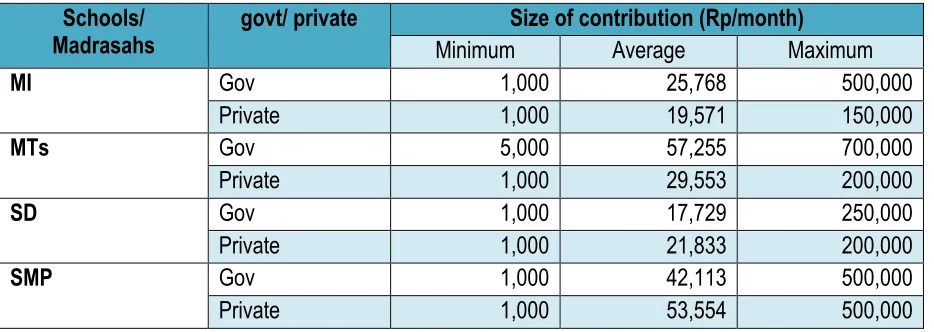
The amount of contribution parents were willing to make ranged from Rp 1,000 to Rp 700,000 per month, with an average between Rp 19,571 and Rp 57,255 depending on the kind of school/madrasah, as per Table 12, below.
Table 14. Size of contribution to basic education parents are willing to make
Schools/ Madrasahs
govt/ private Size of contribution (Rp/month)
Minimum Average Maximum
MI Gov 1,000 25,768 500,000
There is a notable difference in the size of contribution parents are willing to make to the operations of government and private junior secondary schools/madrasahs, indicating parent awareness that costs of education per student can be expected to be higher in the junior secondary sector.
Parents of students in government MTs's are most willing to make a large contribution, and parents in government MIs offered the largest average contribution at primary education level. As noted above, these madrasahs appear to be the most generously government-funded institutions in basic education. Parents from private MTs's want to make the lowest level of donation among all parents of junior secondary students. This may be indicative of that group's low socio-economic capacity.
Parents of SD and SMP students were willing to make the largest contributions for schools with the highest level of accreditation, and smallest contributions for schools with lowest accreditation, but in MIs and MTs's, the highest level of contribution was offered for madrasahs with the middle level of accreditation (B).
ACDP - 006
Free Basic Education Strategy Development
Main Text
Survey of Parental Contributions in Basic Education Report Page 12
homes, and the size of the contribution they report being willing to make. The analysis showed a positive relationship between rising levels of economic capacity and rising levels of contributions offered. The richer the parents were, the larger the contribution that they were on average willing to make. The parents who reported the lowest level of family income and who had a small electricity supply offered an average of Rp 18,573, while the richest group with a large electricity supply offered on average Rp 133,336. Only a small proportion of parents indicated a willingness to make a contribution which appeared to be disproportionate to their means.
3.8. Impact of BOS funds and policy on free basic education on parental contributions to basic education
This analysis makes use of Susenas data for the years 2003, 2006, and 2009. Susenas collected this set of data from interviews with parents in which they were asked to estimate their out of pocket costs to send their children to basic education level schools/madrasahs. The costs include both contributions provided directly to schools/madrasahs such as fees, and personal costs such as transport and uniforms. For 2003, Susenas data did not separate government and private schools/madrasahs.
Table 15 (below) shows that parents’ costs have increased over the six years between 2006 and 2009 in each category of school/madrasah. Parents of students in SD and MI saw particularly steep increases over this period. The only parents who experienced a reduction in costs were those whose children attended MTs between 2003 and 2006, but the reduction was slight and was followed by a significant rise between 2006 and 2009. The cost displayed in Table 15 uses constant value rupiah for 2011, to allow ready comparison with costs of the ACDP survey.
Table 15. Average total parents’ costs for basic education per student per year 2003 - 2009 (values in nominal and constant Rp 2011)
Schools/madrasahs Average Total Parents’ Costs/Year
2003 2006 2009
ACDP - 006
Free Basic Education Strategy Development
Main Text
Survey of Parental Contributions in Basic Education Report Page 13
Schools/madrasahs Average Total Parents’ Costs/Year
2003 2006 2009
745,834 (2011) 730,172 (2011) 1,004,112 (2011)
Private MTs
776,182 (2006)
731,352 (2011)
1,261,060 (2009)
996,414 (2011)
Data from Table 15 (above) appears to indicate that the introduction of BOS funding did not result in a reduction of parental contributions to education. But as evidenced by Table 16, below, the Susenas data shows that the percentage of parents who paid no school/madrasah fees at all rose dramatically between 2003 and 2006, and then dropped dramatically between 2006 and 2009. It appears that the initial impact of the provision of BOS funding was very strong, raising parental expectations that they would be freed from paying fees. The change between 2006 and 2009 may indicate that parents were persuaded by schools/madrasahs that despite the provision of BOS funding, the total school/madrasah resources were not sufficient, and that parental contributions were still required.
Data from the ACDP survey shows that the proportion of parents not paying fees rose again in 2011 (see Tables 5 and 6 above), although it must be borne in mind that this survey's sample was too small to be representative of Indonesia. The per-student allocation of BOS funding did not change between 2009 and 2011. A possible explanation for the change is the strengthening of national and local policies relating to free basic education, and the increasing publicity about and enforcement of this policy.
Table 16. Percentage of parents not paying any school/madrasah fees 2003 - 2011 Data 2003-2009 from Susenas, data 2011 from ACDP survey
Schools/madrasahs
Percentage of parents not paying fees
2003-2009 Susenas, 2011 ACDP survey
ACDP - 006
Free Basic Education Strategy Development
Main Text
Survey of Parental Contributions in Basic Education Report Page 14
Table 17. Average total parents’ costs for basic education by are 2003 - 2009 (values in constant 2011)
Level of Education Average Total Parents’ Costs/Semester/Year
2003 2006 2009
Status Desa Status Desa Status Desa
Urban Rural Urban Rural Urban Rural
SD 279,052 114,703 359,336 157,431 354,935 336,428
MI 233,977 136,190 391,916 171,594 341,486 336,060
SMP 600,669 334,226 717,463 366,932 629,355 489,230
MTs 432,203 342,730 474,769 321,924 550,633 481,205
There is also a variation in costs according to regions, as demonstrated in Illustration 1 (below). The data is presented in constant 2011 rupiahs to facilitate comparison.
Illustration 2. Average Parent Expenditure on Basic Education by Area
The data shows that the biggest variation in costs by region occurs at the level of private SMPs and private SDs, with Maluku - Papua having the lowest parent contributions and Jawa and Kalimantan the highest. While parent costs in other categories of schools/madrasahs do show some regional variability, the variability is not of the order seen among private SDs and SMPs. The cost borne by parents of students in government-provided basic education, both in schools and madrasahs, generally shows a good level of consistency across regions.
ACDP - 006
Free Basic Education Strategy Development
Main Text
Survey of Parental Contributions in Basic Education Report Page 15
monthly fees were also significant items of expenditure, particularly in private schools and madrasahs. The major categories of expenses for 2009 are shown in Illustrations 2 - 5.
Illustration 3. Major Parent Expenses by Category, Primary schools, Susenas 2003 - 2009.
ACDP - 006
Free Basic Education Strategy Development
Main Text
Survey of Parental Contributions in Basic Education Report Page 16
Illustration 5. Major Parent Expenses by Category, Junior Secondary Schools, Susenas 2003 - 2009.
ACDP - 006
Free Basic Education Strategy Development
Main Text
Survey of Parental Contributions in Basic Education Report Page 17
The Susenas data provides information about the difference in costs borne by parents in urban and rural areas.
3.9. Principals' perceptions of impact of no fees on education quality
The principals were asked about the impact on quality of the education offered in their schools/madrasahs which would result from the elimination of all parental contributions. Table 18, below, provides the summary of their responses.
Table 18. Principals' perception of the impact of elimination of parental contributions on the quality of education
Schools/Madrasah Govt/private Negative impact of elimination of compulsory contributions on quality of education
All
Overall, 58.8% of principals report that if parents are not required to contribute to the cost of education, the negative effect on the quality of education they can offer will be medium or large. The highest level of concern was expressed by principals of private primary schools of whom 66.7% thought that the impact would be large. Concern that the impact would be large was also found among principals of private SMPs (44%) and government SDs (40.6%). Principals of government MTs's were most likely (36.4%) to say that the impact would be little or none. It should be noted that a significant percentage of principals chose not to provide a response to this question.
The most negative impact was thought to be on the standard of school facilities, incentive payment for teachers, extra-curricular activities and reduction in the quantity of educational activities offered.
Table 19. Percentage of principals' identifying a negative impact on education quality of elimination of parental contributions to education, by area of negative impact (principals able to nominate more than one area of impact)
Schools/
Percentage of principals identifying the area
MI Govt 52.9% 23.5% 17.6% 5.9% 29.4% 41.2% 5.9%
ACDP - 006
Free Basic Education Strategy Development
Main Text
Survey of Parental Contributions in Basic Education Report Page 18
MTs Govt 45.5% 27.3% 9.1% 0.0% 18.2% 27.3% 9.1%
The principals of all schools/madrasahs report significant negative impact on areas such as facilities, but private schools and madrasahs appear to be much more affected in their ability to pay teacher honorariums. These principals also report a greater impact on their ability to employ teachers than do principals of government schools/madrasahs, though the level of impact on this area is not as severe, indicating that reduction of teacher remuneration rather than reducing the total number of teachers is the strategy more likely to be used by them.
3.10. Relationship between school budgets, parent funding and student learning outcomes
The study attempted to analyse the relationship between total per-student school funding, parental contributions, and student learning outcomes as represented by results of national examinations for class 6 of primary education, and class 3 of junior secondary education.
A regression analysis was undertaken to study the relationship, with schools/madrasahs divided into three groups according to achievement of learning outcomes: low, medium and high. The results show that there is a positive relationship between increasing per-student cost and improved learning outcomes for the two higher-scoring groups of schools/madrasahs, but not for the low-scoring group, as per Table 20, below. This means that schools/madrasahs which perform badly on national examinations can have low, medium or high per-student costs.
Table 20. Relationship between increasing per-student cost and learning outcomes
Low national
Positive relationship Positive relationships
ACDP - 006
Free Basic Education Strategy Development
Main Text
Survey of Parental Contributions in Basic Education Report Page 19
The analysis was unable to identify a differential impact of government or parental funding of education on student learning outcomes. There was no discernible difference between schools/madrasahs which got a higher proportion of funds from parents and those with a similar total budget but with a larger proportion of non-parent funding.
4. CONCLUSIONS
Parents of children in Indonesia's basic education institutions make a significant contribution to the cost of educating their children, when both school contributions and personal costs are taken into account. Data from the national census shows that the trend since 2003 has been for these costs to increase in real terms, in every kind of school/madrasah, even though the national government introduced and then increased school operational funding through the provision of BOS funding. It is not clear why the rate of increase has been higher in rural than urban schools/madrasahs.
The rising cost of the personal items paid for by parents is likely to increase, probably at a rate higher than inflation. With the predicted growing average income levels, Indonesian parents are likely to be providing both more and better quality of education-related items for their children, including stationery books and clothing. It can also be expected that there will be increased participation in non-compulsory extra-curricular activities and excursions. Cost of transport is also likely to rise. For poor parents this situation will provide increased challenges, which will need a government policy response. ACDP 006 is working on this issue and will produce a paper on Pro-Poor Policies.
Over the last decade, there has been significant fluctuation in the proportion of parents who have paid school/madrasah fees. Before the introduction of BOS funding, nearly all parents paid school fees. In 2006, the year after the introduction of this funding, the proportion of parents paying fees dropped dramatically, only to rise again in 2009. The data from 2011 indicates that the proportion of parents paying fees has dropped again.
The volatility in this pattern is likely to have been caused by the impact of government policy. The initial introduction of BOS appears to have led many parents to believe that the schools/madrasahs no longer needed their contributions to operating costs. By 2009, they appear to have been convinced that their contributions were still needed, but by 2011-2012, with governments at all levels actively promoting "free basic education" policies, many have again stopped paying fees.
It should be noted that despite the changes in the proportion of parents paying fees, the average cost of parent contributions has continued to rise, indicating that those who have been paying have been paying significantly more.
The ACDP survey shows that there is a major discrepancy between what the parents report as paying to schools/madrasahs, and what those institutions report to have received. The survey data is broadly consistent with the data from Susenas, with the increase reported in 2011 total parent payments being in line with the trend of increasing parental contributions since 2003. This raises the presumption that schools/madrasahs are not reporting accurately the full measure of contributions received from parents.
It is also the case that at present, schools/madrasahs are not effectively reporting what use they make of parent contributions. Nearly half of the funds which they report receiving from parents are reported to be spent on "other" activities.
ACDP - 006
Free Basic Education Strategy Development
Main Text
Survey of Parental Contributions in Basic Education Report Page 20
not being enforced. In the Indonesian context, it is important that all parent payments, regardless of the channel used, are recorded and reported on. These channels include payments made to school committees and directly to class teachers.
It is difficult to predict what the pattern of payments to schools/madrasahs will be in the future. The policy context is currently clear for government schools - it is governed by Ministerial Regulation 44/2012 which determines that government schools providing basic education should not charge fees. The implications for the madrasah system are yet to be clarified, but government madrasahs are likely to follow the example of government schools. This means that in the government system, schools and madrasahs will rely only on voluntary parental contributions. How large these voluntary contributions are will depend on several factors. Key among these will be:
• parent confidence that their contributions will be well used'
• increased transparency in schools/madrasahs reporting receipts and expenditure of parent funds; and
• effectiveness of school administrations in demonstrating to parents the need for funding additional to that provided by government.
It should also be noted that schools/madrasahs already have methods of persuading some parents to make contributions which while formally "voluntary", are in effect highly pressured. The longer-term policy objective should be to replace these with more transparent and accountable strategies for seeking parent support.
LAMPIRAN 1
ACDP - 006
Free Basic Education Strategy Development
Appendix 1 Implementation of Survey Activities
Survey of Parental Contributions in Basic Education Report Page 21
APPENDIX 1 IMPLEMENTATION OF SURVEY ACTIVITIES
Survey activities on parental contribution to basic education were conducted in several stages, as follows :
• Preparation
• Questionnaire trial
• Selection of survey objects
• Supervisor/Surveyor training
• Administration and permits
• Execution of field survey
• Document handling and data entry
Each sub-activity is elaborated in the sub-sections below.
1. Preparation Stage
Activities conducted in the preparation stage were, among others
a. Collection of school data (Diknas), regional characteristic data and susenas data (BPS), b. Coordination with relevant institutions (MONE, MORA and Bappenas),
c. Structuring of survey instruments (questionnaire and guidelines on questionnaire completion).
There were two types of survey questionnaires:
a. Questionnaire for parents
This aimed to collect data/information about parental contributions, particularly their financial contributions, over the last calendar year. Instruments used were open- ended and closed questionnaires.
b. Questionnaire for schools
Questionnaire for schools aimed to collect data /information about the kind and amount of parental contribution received by schools in the last calendar year (Jan-Dec 2011). Its main focus was to identify how much financial support was gained from the students’ parents, and how this money was used by the schools. Instruments used were open- ended and closed questionnaires.
The draft of these two types of questionnaire is presented in Appendices A and B.
The activities were conducted in parallel during the period of December 2011-March 2012, under the coordination of Mr. Chris Majewski.
2. Questionnaire Trial
ACDP - 006
Free Basic Education Strategy Development
Appendix 1 Implementation of Survey Activities
Survey of Parental Contributions in Basic Education Report Page 22
also evaluated. Apart from testing the questionnaire, the trial was also used to train the master trainer candidates who subsdequently trained district/sub-district surveyors, all of whom had previous experience in conducting real field surveys.
Trial activity for the parent questionnaire was conducted by the research team (Mr. Majewski, Mr. Robert Suharno and Mr. I Made Sumertajaya) in Jakarta and Bogor. This activity was conducted during 1-7 April 2012.
The trial of the school questionnaire was performed in 6 schools/madrasahs in the Jabodetabek area, conducted on 10 April 2012 at the ACDP office, Kompleks Lotte Mart Blok G No 32, Jalan Fatmawati, Jakarta. This activity was coordinated by I Made Sumertajaya, with the support of Mr Chris Majewski and Amril Muhammad (Universitas Negeri Jakarta).
3. Selection of Survey Objects
Survey objects in this activity were the regional government (education offices and religious affair offices), schools and students’ parents. Sampling method used was multi stage stratified random sampling. Stages of sample selection were as follows: (1) selection of provinces, (2) selection of districts/municipalities of the selected provinces, (3) selection of schools in each selected district/municipality, and (4) selection of parents in each selected school. To avoid bias in the samples collected, sample selection took into account the characteristics of targeted population. Some considerations needed to be taken into account in each stage of sampling, as per the following:
Illustration 7. Sampling in the selection of provinces and districts/municipalities
1. Province selection was conducted in each area (Sumatera, Jawa, Bali & Nusa Tenggara, Kalimantan, Sulawesi, Maluku & Papua). In each area, 1-2 provinces were selected randomly and proportionally.
ACDP - 006
Free Basic Education Strategy Development
Appendix 1 Implementation of Survey Activities
Survey of Parental Contributions in Basic Education Report Page 23
representativeness of strata based on economic background and the quantiy of basic education services available.
Based on the above methodology, the provinces and districts/municipalities selected as survey locations are presented in Table 1.
Table 21. List of Provinces and Districts/Municipalities in the Sample
Area Prov
Code
Province Dist./Muni.
Code
District/Municipality
SUMATERA 13 SUMATERA BARAT 1371 PADANG
1301 KEPULAUAN MENTAWAI
17 BENGKULU 1703 BENGKULU UTARA
JAWA 35 JAWA TIMUR 3578 SURABAYA
BALI AND NUSA TENGGARA 51 B A L I 5108 BULELENG
KALIMANTAN 63 KALIMANTAN SELATAN 6303 BANJAR
SULAWESI 73 SULAWESI SELATAN 7311 BONE
7303 BANTAENG
MALUKU&PAPUA 81 M A L U K U 8103 MALUKU TENGAH
3. School selection in each selected district/municipality took into account features such as school type (school and madrasah), school level (SD or equivalent, SMP or equivalent), school status (government, private), school quality (accreditation A, B, C), schools/madrasahs in urban, rural, remote areas, as well as islands, and rich or poor schools.
4. Sampling of students’ parents in each school too into consideration economic and educational background of parents, as well as parents whose child does not go to the selected school but lives around the area of the school.
ACDP - 006
Free Basic Education Strategy Development
Appendix 1 Implementation of Survey Activities
Survey of Parental Contributions in Basic Education Report Page 24
Illustration 8. Sampling of schools and parents’ selection
Sample Size
Determining the sample size in each stage was done by quotas, taking into account the representativeness of each stratum, time and funding available. The distribution of sample for each type of the survey objects is as follows:
Table 22. Amount of sample schools and parents in each selected province and district
Prov.
Sekolah 1 Sekolah 2 Sekolah ... Sekolah 24
ACDP - 006
Free Basic Education Strategy Development
Appendix 1 Implementation of Survey Activities
Survey of Parental Contributions in Basic Education Report Page 25
Note: *) There are 24 school strata and 1 school is selected in each stratum
**) There are 6 parent strata and 2 parents are selected in each stratum
4. Training of Supervisors and Surveyors
Training activity aims to standardize the perception toward the technical implementation of survey and its output.
Training is conducted in 2 stages: (1) training of areal coordinators and (2) training of field surveyors.
Areal coordinator training is performed in Jakarta. Seven areal coordinators are invited to Jakarta, representing 7 selected provinces. Training of field surveyor is then conducted in each province, where participants are trained by the areal coordinators having been trained in Jakarta. Two surveyors from each area participate in the training.
In the training, an in-depth familiarization is performed for the surveyors, which involves among others the general description of survey activity, the legal framework of activity, data collection/questionnaire completion method, and interview ethics/procedures. To increase participants’ level of understanding towards the material presented, trial on questionnaire completion is conducted. For maximum results, surveyors are expected to be able to perform interviews with regard to interview procedure. Data collection from selected survey objects is performed through face-to-face interview between the surveyors and respondents.
Supervisor training activity was conducted on 13 April 2012 at Golden Plaza Office Complex, Lotte Mart Blok G-32, Jakarta.
Table 23. Details of Supervisor Training Activity
SESSION TIME ACTIVITY PERSON IN CHARGE
I 09.00-09.15 REGISTRATION OF SUPERVISORS APRIANI WULANDARI
09.15-09.45 INTRODUCTION TO PARENTAL
CONTRIBUTION SURVEY
CHRIS MAJEWSKI
09.45-10.30 IMPLEMENTATION STAGES OF
SURVEY ACTIVITY
CHRIS MAJEWSKI/I MADE SUMERTAJAYA
10.30-11.30 DISCUSSION: COMPLETING THE
QUESTIONNAIRE FOR PARENTS
CHRIS MAJEWSKI/I MADE SUMERTAJAYA
11.30-13.00 BREAK
II 13.00-14.00 DISCUSSION: COMPLETING THE
QUESTIONNAIRE FOR SCHOOLS
CHRIS MAJEWSKI/ I MADE SUMERTAJAYA
14.00-15.00 DISCUSSION CHRIS MAJEWSKI/ I MADE
SUMERTAJAYA
15.00-16.00 DISCUSSION: ADMINISTRATION ARI AGUNG
ACDP - 006
Free Basic Education Strategy Development
Appendix 1 Implementation of Survey Activities
Survey of Parental Contributions in Basic Education Report Page 26
Table 24. List of survey areas for each supervisor
No Location Name & Contacts. Number of Survey Objects
1 Kota Padang, Kab. Kep.
3 Kota Surabaya, Kab. Lamongan – Jawa Timur
Fahmi Hasan Bakran (085724163456)
48 schools, 576 parents
4 Kab. Buleleng - Bali Boy Ishak (081280500299) 24 schools, 288 parents
5 Kab. Bengkulu Utara – Bengkulu
TB Sastra Mulyana (085218360603)
24 schools, 288 parents
6 Kota Tual – Maluku Jajat Sudrajat (085693333312) 24 schools, 288 parents
7 Kab. Banjar - Kalimantan
Permits are crucial to make activities run smoothly. Permits required include:
a. Central Level Permits (Diknas, MORA, Office of Internal Affairs)
Permits from the central level had to be obtained to support the activity. The central authority then appoints a level below it to produce a permit letter for the activity. This permit is significant as a base for the survey activity.
b. District/Municipality Level of Permits
Peremission at the district/municipality level were manisfested in the form of cooperation and coordination with the district/municipal government.
c. Permits from Relevant Stakeholders
Several survey objects in this activity were partners from particular institutions such as religious organizations NU and Muhammadiyah.
6. Implementation of Field Survey
ACDP - 006
Free Basic Education Strategy Development
Appendix 1 Implementation of Survey Activities
Survey of Parental Contributions in Basic Education Report Page 27
Table 25. Schedule of Field Survey Implementation
DATE ACTIVITY PERSON IN CHARGE
7-8 May 2012 Survey Preparation
a. Letter of Introduction/Appointment Dety/Wulan
b. Lists of surveyed schools and backup schools I Made Sumertajaya c. Questionnaire duplication (Form A1, Form A2, Form B1,
Form B2)
TIA (Ela/Ari/Wulan)
d. Procurement of departure tickets for supervisors to the field (departure was scheduled to be on 10 May 2012)
TIA (Ela/Ari/Wulan)
d. Procurement of departure tickets for counterpart team to the field (departure was scheduled to be on 13-18 May 2012)
TIA (Ela/Ari/Wulan)
e. Funding for the implementation of survey TIA (Ela/Ari/Wulan)
f. Souvenirs for survey objects TIA (Ela/Ari/Wulan)
8 May 2012 Inviting the counterpart teams to the ACDP office at D'Best Complex Lotte Mart
Dety/Wulan
9 Mei 2012 Inviting the supervisors to the ACDP office at D'Best Complex Lotte Mart to get the equipment and supplies for the survey
TIA (Ela/Ari/Wulan)
10 Mei 2012 Supervisors depart to each survey area Supervisor
Supervisors collect and train the surveyors Supervisor
11 May 2012 Supervisors together with the surveyors visit the education offices and the religious affairs offices in the province and district/municipality levels
Supervisor
11-23 May 2012 Survey Implementation Supervisor
a. Surveyors conduct data collecting in schools Surveyor b. Surveyors collect data from students’ parents Surveyor c. Supervisors perform mentoring on the first day of visits
to schools and to parents
Supervisor
d. Supervisors perform quality control on the implementation of survey (periodical visits to survey objects)
Supervisor
e. Collection of completed questionnaires and validation of questionnaire responses
Supervisor
f. Coordinating the data entry Supervisor
g. Accompanying the counterpart teams performing field supervision
Supervisor
ACDP - 006
Free Basic Education Strategy Development
Appendix 1 Implementation of Survey Activities
Survey of Parental Contributions in Basic Education Report Page 28
DATE ACTIVITY PERSON IN CHARGE
24 May 2012 Supervisors are back to Jakarta Supervisor
a. Submission of policy documents
b. Submission of completed school questionnaires and their supporting documents
c. Submission of completed parent questionnaires d. Submission of school and parent database softcopy
e. Submission of administrative documents
Guidelines for data collection in the field are shown in the table below. Basically, there were 3 main activities performed in the field, i.e. collection of regulations/policies on the delivery of education in each area, data collection at schools (Questionnaire A) and data collection of parental participation in education (Questionnaire B).
Table 26. Type of data collected from each respondent
Data Respondent Communication
ACDP - 006
Free Basic Education Strategy Development
Appendix 1 Implementation of Survey Activities
Survey of Parental Contributions in Basic Education Report Page 29
List of assignment and responsibility of each supervisor and surveyor is presented in the below table.
Table 27. Details of Assignment for Each Areal Supervisor
NO DETAILS OF ACTIVITY
1 Training on survey methodology in Jakarta
2 Training of district/municipal supervisors and field surveyors
3 Collection of regional policy/regulation documents related with the delivery of education,
conducted in Education Offices and MORA Offices in the provincial level
4 Collection of regional policy/regulation documents related with the delivery of education,
conducted in Education Offices and MORA Offices in the district/municipal level
5 Mentoring of surveyors in the field on the first day
6 Collection of school and parent questionnaires which surveyors have completed periodically
7
Quality control:
- Checking complete documentation from the district/municipal level - Random testing: making calls to 10% of respondents
8
Data Validation:
- Checking the completion and validation of questionnaires’ response
9
Data Entry:
- Checking the consistency of questionnaires’ response with data entry
10 Dispatching the documents and data entry to Jakarta
Table 28. Details of Assignment for Each Field Surveyor
NO DETAILS OF ACTIVITY
1 Training on survey methodology in provinces
2 Conducting the survey in 24 schools and 12 parents per school.
3 Collecting documents and handing them in to the provincial supervisors
7. Handling of the Survey Result Document
ACDP - 006
Free Basic Education Strategy Development
Appendix 1 Implementation of Survey Activities
Survey of Parental Contributions in Basic Education Report Page 30
Quality Assurance (QA) and Quality Control(QC)
QA/QC activity is a form of control of the quality of data gathered from the field. The scope of QA/QC involves random testing and data validation.
Random Testing
The implementation of random testing focuses on school and parental contribution survey activities. The scale of each random testing object is decided using a sampling method. The number of samples per object is 15% of the targeted objects in each district. In the implementation, random testing was performed per surveyor/verifier on 15% of the total work completed.
Random testing methods performed in this work, among others, were:
1. RecTotal by Phone: a random test performed by making phone calls to the respondents, asking them about the process they have undergone with a surveyor/verifier in the data collection phase. Questions posed can be about the appearance, manners or attitudes of the surveyor/verifier. Along with those, several questions in the questionnaire are re-asked to cross-check answers provided by the respondents.
2. Check on the Spot: a random test performed by making an unannounced visit to the surveyor at work. After the surveyor completed the data collection, the completed forms are reviewed to see whether s/he has done it correctly (all sections of the form are filled out) and to ensure that there is no cheating by, for instance, filling out the forms without conducting any interviews.
3. Check in the field: a random test performed by revisiting the respondents who have been interviewed by the surveyors. QC personnel ask them about the appearance, manners or attitudes of the surveyors/verifiers. Along with those, several questions in the questionnaire are re-asked to cross-checkanswers provided by the respondents.
Random testing was performed by field supervisors/coordinators depending on relevant circumstances. Additionally, the expert team from headquarter performed supervision in several areas. This supervision by the expert team was done in the period of 14-24 May 2012.
Table 29. List of Supervised Survey Areas
No Area Expert Team Member Date
1 Jawa Timur Chris Majewski 14-16 May 2012
2 Sumatera Barat Robert Suharno 14-16 May 2012
3 Bali I Made Sumertajaya 16-18 May 2012
Should there be an indication that a surveyor cheats or does not perform her/his task according to the agreed SOP, the coordinator and the QC personnel would perform the random testing together. It is the coordinator who has the authority to pose questions to respondents. Respondents’ answers in the random test become the base to decide whether a surveyor/verifier makes mistakes or a respondent incorrectly provides answers.
ACDP - 006
Free Basic Education Strategy Development
Appendix 1 Implementation of Survey Activities
Survey of Parental Contributions in Basic Education Report Page 31
Data Validation
Results of data collection from schools and parents in the selected districts/municipalities were validated in the district/municipal level to ensure all forms about schools and parents were completed according to the form filling-out guidelines. Upon validation, data was sent to headquarter to begin the process of data entry.
If a problem regarding the questionnaire responses was found during the validation process, QC returned the survey form to the surveyor coordinator to be forwarded to the relevant surveyor for correction.
Corrected data is then resubmitted to the coordinator by the surveyor, and is revalidated until it is free from problem. If no further problem is found, the data is then accepted and included into the next phase of process.
Document Handling
Document handling involves a range of document dispatching from the field (the surveyor level) to the central management in headquarters. Movement process of documents is accompanied by QC and validation processes. Documents considered as valid in the checking process will be forwarded to the next phase. The objective of document handling is so that the documents are consistently controlled and selected according to good data quality.
Verified and validated documents from the surveyor level will be passed on to the lead surveyor level. Once regarded as suitable, documents are once again passed on to the areal/district validators. In the QC process, data will be grouped according to particular categories by the areal validators. Document dispatch to headquarter QC will be accompanied by proof that QC has been performed in the area level. QC in headquarter will be performed on the valid documents with the same standard. Once they are found to be suitable, control cards will be written as data validation proof. Control cards are used to manage document quality. Documents considered valid will be categorized into three groups: school data, parent data and regional regulation/policy document in education.
To differentiate document types, valid documents are grouped in batches of different colors. Designation is done through coloring and naming on the cover of document batch for each document group.
Data Entry
Data entry is performed in each survey area, coordinated by the supervisor. Entried data will then be sent to headquarter passing through several phases of QC and according to the data validity.
Table 30. Details of Assignment for Each Data Entry Personnel
NO URAIAN KEGIATAN
1 Data coding for several open-ended questions