Adaptive Neuro-Fuzzy Inference System
for Texture Image Classification
B. Ari Kuncoro
Master of Information Technology Bina Nusantara University
Jakarta, Indonesia Email: b.kuncoro [at] binus.ac.id
Suharjito
Master of Information Technology Bina Nusantara University
Jakarta, Indonesia Email: suharjito [at] binus.ac.id
Abstract—One of the most important problems in pattern recognition is texture-based image classification. In this pa-per, the combination of Discrete Cosine Transform (DCT) and Gray Level Co-Occurrence Matrix (GLCM) methods for feature extraction was proposed. The attributes extracted from DCT method were mean and variance, while the attributes extracted from GLCM method were energy and entropy. Adaptive Neuro-Fuzzy Inference System (ANFIS) was used as a classifier. The classifier model was trained using 50% of the texture images and remaining images were used for testing. Four classes of texture images were downloaded from KTH-TIPS (Textures under varying Illumination, Pose and Scale) image database, three of which were used in each experiments thus there were four data combination. The best data testing accuracy result towards textures of crumpled aluminium foil, corduroy, and orange peel is 98.3%, which is 1.6% better than one hidden-layer feed forward neural network classifier. In average, testing accuracy result of ANFIS excelled one hidden-layer feed forward neural network with 93.7% over 90.4%.
Index Terms—Texture Images; Discrete Cosine Transform, Gray Level Co-Occurence Matrix, Adaptive Neuro-Fuzzy Infer-ence System
I. INTRODUCTION
Texture has been studied for a long time as a primitive visual cue and is known as low-level image features [1]. It is useful in recognition and interpretation, because as image, it consists of related and interrelated elements [2]. To extract the features from the texture images, several steps must be applied. Many researchers reported various methods in how to extract features based on textures. They include statistical methods of GLCM, energy filters and edgeness factor, Gabor filters, and Wavelet transform [3], [4]. There is no strict guideline to determine what features are most suitable for specific data, thus experimental methods such as empirical and heuristic methods are commonly used.
Upon extracting features, the classification is applied. There were various techniques reported and developed for classi-fication by many researchers such as feed-forward neural networks, extreme learning machine, and ANFIS. The
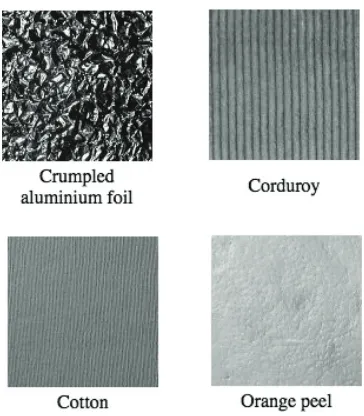
ap-Fig. 1. Samples of Dataset
plications of this development are also various such as the classification of fruits (e.g. oranges) and rocks [5]. Those applications are useful to help industries expedite classification process.
In this study, the used features extraction methods are based on DCT and GLCM. In DCT, statistical components of mean and variance of DCT matrix were used, while in GLCM, the energy and entropy of GLCM matrix were used. The classifier used in this study is ANFIS. To classify images based on texture and to know the accuracy of the model is the objective of this work.
II. DATASET
The image dataset can be downloaded at http://www.nada.kth.se/cvap/databases/kth-tips/download.html [6]. Four-class texture image samples consist of alumunium foil, corduroy, orange peel, and cotton are illustrated in Fig. 1. Each class contains 80 texture images, thus there were 320 2015 International Conference on Automation, Cognitive Science, Optics, Micro Electro-Mechanical System, and Information Technology
texture images collected. Using combinational method, each of experiments used three out of four classes or 240 images.
III. METHODOLOGY
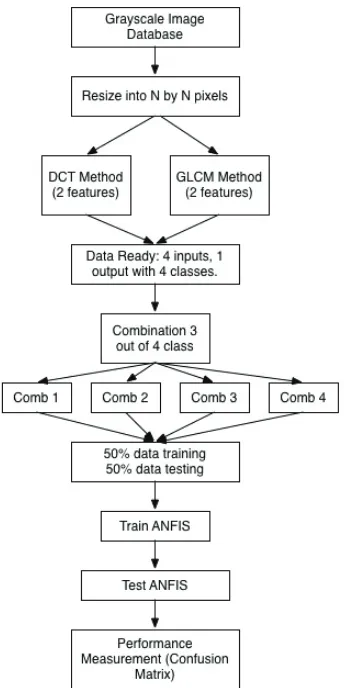
The methodology of this study is illustrated in Fig. 2. First, 320 gray-scale images were collected in one folder. Then the images were resized into64×64pixels. On each images, DCT
and GLCM blocks were applied thus DCT and GLCM matrix were produced. From DCT matrix, mean and variance were calculated as attribute 1 and attribute 2, while from GLCM, energy and entropy were extracted as attribute 3 and attribute 4. Upon extracting, 3 out of 4 classes were combined into four different combination of dataset. The first experiment utilized 80 aluminium foil, 80 corduroy, and 80 orange peel texture. The second until the forth experiment involved cotton texture using combinational method. As a result there were four experiments in total. The combination of experiments based on the data involved is written as follows.
• Combination 1: aluminium foil, corduroy, and orange
peel
• Combination 2: aluminium foil, corduroy, and cotton
• Combination 3: aluminium foil, cotton, and orange peel
• Combination 4: corduroy, cotton, and orange peel
Each combination of dataset was divided equally into 50% data training and 50% data testing. Data training was used for ANFIS training and to build the model of classifier, while data testing was used for testing the model. The last step was computing the confusion matrix and accuracy. Detail description is written in the following subsection.
A. Discrete Cosine Transform (DCT)
The first step in DCT is usually to convert an RGB image into a gray level image. Since in this dataset each image has been in gray level image, no conversion is needed. The next step is resizing the images intoN×N sub-blocks where the size of N depends on size of image. The 2D DCT can be written in terms of pixel values [2] [7]. The resized image matrix is represented by f(i, j) fori, j = 0,1, ..., N−1 and
the frequency-domain transform coefficients can be obtained from the general equation N ×M below. To simplify the
computation, square-size images were used. Thus in this case, M equals to N.
F(u, v) =
2
N
12 2 M
12N−1
i=0
M−1
j=0
Λ(i)Λ(j)
cosπu
2N (2i+ 1)
cosπv
2M (2j+ 1)
f(i, j)
where Λ(i) =
1
√
2 f or ε= 0 1 otherwise
(1)
Fig. 2. Flowchart of Image Classification using ANFIS
The size of matrixF(u, v)is similar tof(i, j). If the image size is64×64, then the matrix size of DCT is also64×64. In
DCT matrix, the upper left corner of the matrix represents the low frequency part [8]. As the used image size in this study is64×64and the used DCT matrix part is the low frequency,
thus the first8×8components was collected to calculate mean
and variance. Those parameters were used as as attribute 1 and attribute 2 respectively.
B. Gray Level Co-Occurrence Matrix (GCLM)
1) Angular Second Moment (Energy): Angular Second Moment or Energy is the sum of squares of entries in the GLCM matrix. It is also known as homogeneity. The value of which energy high when image has very good homogeneity or when pixels are very similar [4].
Energy=
N g−1
i=0
N g−1
j=0
P(i, j)2
(2)
2) Entropy: Entropy shows the amount of information of the image that is needed for the image compression. Entropy measures the loss of information or message in a transmitted signal and also measures the image information.
Entropy=
N g−1
i=0
N g−1
j=0
−P(i, j)×log(P(i, j)) (3)
In this paper, each class was represented by integer. For combination 1, integer 1, 2, and 3 represent aluminium foil, corduroy, and orange peel respectively. Since the feature extraction process produced four features, each of the data contains four attributes. As a result, the used data contains four inputs and one output. The snippet of the data is as follows.
880.729,4.68593e+06,2.98135,0.0891916,1 811.697,1.73683e+06,2.72428,0.13527,1 732.743,2.2623e+06,2.62406,0.119913,1 418.068,509726,2.0458,0.348333,1 424.64,689089,2.30269,0.239463,1 408.461,800735,2.57124,0.158994,1 ...
246.253,2.61788e+06,1.78639,0.261709,2 248.174,2.52921e+06,2.14585,0.183963,2 281.978,3.66744e+06,2.4358,0.110385,2 284.576,3.38465e+06,1.57276,0.260701,2 277.482,2.82053e+06,1.78907,0.234655,2 323.808,3.50561e+06,1.97454,0.183467,2 282.32,3.3365e+06,1.54988,0.3172,2 ...
399.822,6.94773e+06,1.48722,0.302955,3 378.079,6.5303e+06,1.51542,0.26855,3 370.851,4.96315e+06,1.5838,0.322928,3 368.65,6.50668e+06,1.31369,0.321808,3 354.542,5.24536e+06,0.844406,0.66578,3 374.87,5.52941e+06,1.35618,0.422251,3 398.339,6.67421e+06,1.43632,0.30473 ...
C. Adaptive Neuro-Fuzzy Inference System
The definition of ANFIS is derived from the combination of Artificial Neural Network and Fuzzy Inference System (FIS) in
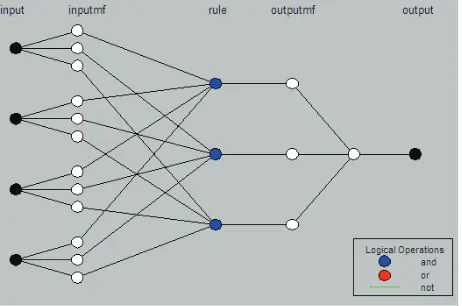
Fig. 3. ANFIS Model Structure
Fig. 4. Membership Function of FCM Generated FIS
such a way that neural network learning algorithms are used to determine the parameters of FIS. This system takes the benefits of both Artificial Neural network system and Fuzzy Logic system and eliminates their limitations [10]. An even more important aspect is that the system should always be interpretable in terms of fuzzy if-then rules, because it is based on the fuzzy system reflecting vague knowledge [7]. In this study, the structure of ANFIS is illustrated in Fig. 3. It consists of 4 inputs, 3 membership functions, 3 rules, and 1 output.
Using training data containing 4 inputs and 1 output, ANFIS constructs a FIS whose membership function parameters are tuned (adjusted) using Fuzzy C-Mean (FCM) clustering and Sugeno structure type. The membership functions were built using Gaussian as illustrated in Fig. 4.
The three rules used are written as follows:
Rule 1: If (In1 is In1cluster1) and (In2 is In2cluster1) and (In3 is In3cluster1) and (In4 is In4cluster1) then (out1 is out1cluster1)
Rule 2: If (In1 is In1cluster2) and (In2 is In2cluster2) and (In3 is In3cluster2) and (In4 is In4cluster2) then (out1 is out1cluster2)
Fig. 5. Plot Input data in 2-D
and (In3 is In3cluster3) and (In4 is In4cluster3) then (out1 is out1cluster3)
D. Artificial Neural Network
In order to evaluate the performance of ANFIS, ANFIS parent’s method called Artificial Neural Network (ANN) with feed forward network type was used on the same data. The structure used was one hidden-layer. The similar strategy in how to divide the data training and data testing was also applied.
IV. RESULTS ANDDISCUSSION
To visualize the data based on generated attributes, 2-D plotting data graph is required. It is depicted in Fig. 5 that color of blue, green, and red represent aluminium foil, corduroy, and orange peel textures respectively. Based on that figure, it is seen that aluminium foil texture is well grouped compare to the other two textures. Despite that it is still a good signal for classification purposes.
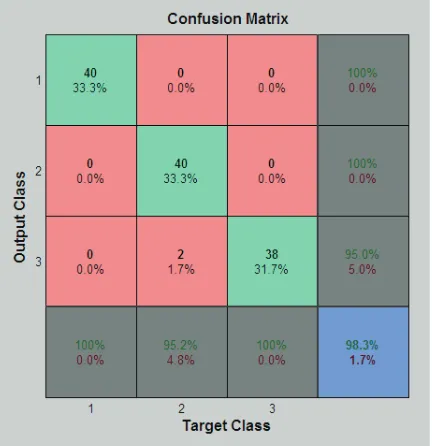
The data performance graph of combination 1 can be seen in Fig. 6. It is quite impressive that from epoch 1 to 20, root mean square error (RMSE) decreased significantly from 0.07 to 0.023. Its value is unchanged when epoch reached 22. Another performance indicated by confusion matrix is shown in Fig. 7. This confusion matrix was built based on data testing. The parameter of accuracy is used to measure the effectiveness of the system which can be derived from equation 4 or simply collect the value of confusion matrix with blue background color located in the most lower right position. Figure 7 shows that the accuracy of ANFIS for combination 1 data is 98.3%.
Accuracy= T P +T N
T P +F N+T N+F P ×100% (4)
Fig. 6. Epoch vs RMS Graph of Combination 1 ANFIS
Fig. 7. Confusion matrix against data testing of Combination 1
Where,
• True Positive (TP) represents the number of positive data
that is correctly labeled by a classifier
• True Negative (TN) represents the number of negative
data that is correctly labeled by a classifier
• False Positive (FP) represents the number of positive data
that is incorrectly labeled by a classifier
• False Negative (FN) represents the number of negative
data that is incorrectly labeled by a classifier
TABLE I
PERFORMANCEMEASUREMENTRESULT OFANFISANDONE
HIDDEN-LAYERANN
Accuracy Data ANFIS One HL ANN
Data Training
Combination 1 99.2% 98.3% Combination 2 94.1% 91.7% Combination 3 97.5% 92.5 Combination 4 90.8% 87.5%
Average 95.4% 92.5%
Data Testing
Combination 1 98.3% 96.7% Combination 2 94.1% 89.2% Combination 3 95% 88.2%
Combination 4 87.5% 87.5% Average 93.7% 90.4%
and combination 1 data, accuracy against data testing is 98.3%. It is 1.6% better than the accuracy against data testing based on one hidden-layer ANN classifier. In average of combination 1, 2, 3, and 4 data, ANFIS surpassed one hidden-layer ANN in term of accuracy which is 95.4% over 92.5% for data training and 93.7% over 90.4% for data testing.
V. CONCLUSION
The combination of DCT and GLCM methods is really powerful to be used in features extraction of texture images. Mean and variance of DCT, entropy and energy of GLCM are the features that were extracted in this work. It was proven that ANFIS works well to classify the texture images. ANFIS can classify aluminium foil, corduroy, and orange peel textures data with 98.3% data testing accuracy with only 22 epoch. Overall, ANFIS performance surpasses the one hidden-layer ANN performance in term of accuracy with 95.4% over 92.5% data training accuracy and 93.7% over 90.4% data testing accuracy.
ACKNOWLEDGMENT
The author would like to thank Dr. Diaz D. Santika of Bina Nusantara University, Jakarta, Indonesia for his guidance and Dr. Bayram Cetili Suleyman of Demirel University, Computer Engineeering, Isparta, Turkey for his work in ANFIS MAT-LAB program that was used and modified in this study.
REFERENCES
[1] D. Avci, M. Poyraz, and M. Leblebicioglu, “An expert system based on discrete wavelet transform - anfis for acquisition and recognition of invariant features from texture images,” in Signal Processing and Communications Applications Conference (SIU), 2015 23th, May 2015, pp. 1070–1073.
[2] P. H. Chandankhede, “Soft Computing Based Texture Classification with MATLAB Tool,” International Journal of Soft Computing and Engineering, no. 2, pp. 475–480, 2012.
[3] L. A. Ruiz, A. Fdez-Sarr´ıa, and J. A. Recio, “Texture Feature Extraction for Classification of Remote Sensing Data using Wavelet Decomposi-tion: A Comparative Study,” inInternational Archives of Photogramme-try and Remote Sensing, vol. XXXV, 2004, pp. 1682–1750.
[4] P. Mohanaiah, P. Sathyanarayana, and L. Gurukumar, “Image Texture Feature Extraction Using GLCM Approach,”International Journal of Scientific & Research Publication, vol. 3, no. 5, pp. 1–5, 2013. [5] C.-H. Wu, J.-S. Lee, C.-Y. Shie, and M.-Y. Su, “Rock classification
via a mobile device,” in Communications and Networking in China (CHINACOM), 2012 7th International ICST Conference on, Aug 2012, pp. 663–666.
[6] B. C. Mario Fritz, Eric Hayman and J.-O. Eklundh, “The KTH-TIPS and KTH-KTH-TIPS2 Image Databases,” 2004. [Online]. Available: http://www.nada.kth.se/cvap/databases/kth-tips/documentation.html [7] G. Sorwar and A. Abraham, “DCT based texture classification using
soft computing approach,”CoRR, vol. cs.AI/0405013, 2004. [Online]. Available: http://arxiv.org/abs/cs.AI/0405013
[8] W. Zhen and X. Zhe, “SIFT Feature Extraction Algorithm for Image in DCT Domain,”Proceedings of the 2nd ISCCCA-13, pp. 261–264, 2013. [9] P. Costianes and J. Plock, “Gray-level co-occurrence matrices as features in edge enhanced images,” in Applied Imagery Pattern Recognition Workshop (AIPR), 2010 IEEE 39th, Oct 2010, pp. 1–6.