THE INFLUENCE OF CONCENTRATION AND FREQUENCY OF CHITOSAN DISTRIBUTION ON THE VEGETATIVE GROWTH OF KEMIRI SUNAN PLANT
Ellen Rosyelina Sasmita, Ami Suryawati and Endah Budi Irawati,
Agrotechnology Study Program Faculty of Agriculture UPN "Veteran" Yogyakarta Jl. North Ring Road 104 Condongcatur Yogyakarta
ABSTRACT
Kemiri sunan (Reutealis trisperma (Blanco) Airy Shaw) is one of the plants that produce vegetable oil which can be processed into biodiesel and can be planted on marginal land. In order to have a better vegetative growth of plants, fertilization technology can be carried out on immature plants by giving chitosan. This research was carried out in Kelir Mountain energy garden from January to May 2018 using a complete randomized block design of two factors, namely concentration and frequency of chitosan distribution. The results showed that there was an interaction between the treatment of chitosan concentration and the frequency of chitosan distribution in the addition of stem diameter in 70 and 90 days after the initial observation and the increase in the number of the secondary branches on 90 days after the initial observation. The concentration of 20 and 30 ml / l chitosan and the frequency of 4 times chitosan distribution gave a better effect than other treatments. Plants that were treated with chitosan had a better vegetative growth than those without chitosan (control).
Keywords: vegetative growth, kemiri sunan, chitosan
INTRODUCTION
Kemiri sunan (Reutealis trisperma (Blanco) Airy Shaw) is one type of plant that contains
vegetable oil which is potential as a raw material for biodiesel (Herman et al., 2009). Biodiesel
from kemiri sunan has advantages over other vegetable sources, including high yields and has a
long production life. Kemiri sunan plants can be used as conservation plants because their
growth is fast and their roots are deep so they are able to withstand the landslides and erosion,
reclaim marginal lands so it increases the economic value of the land. This plant has a high
adaptability to the environment, is able to grow in dry land of wet climate, has strong and deep
roots, is able to survive on sulfur land so it can withstand the erosion, its lush and its wide and
dense leaves can absorb CO2 and produce a lot of O2 and the leaves will fall out in the dry season
so that it can form a thick humus as a soil fertilizer (Pranowo and Rusli, 2012).
Kemiri sunan plants are able to produce seeds as much as 4-6 tons of dry beans per hectare
when being extracted will produce vegetable oil. Vossen and Umali (2002) cit., Syafruddin and Wahyudi (2012) states that kemiri sunan oil containing 50% ∝-eleostearate acid is a compound
that causes poisonous kemiri sunan oil so it cannot be consumed. This oil can be used for various
purposes such as natural insecticides which are very effective for killing pests (Burkill, 1966 cit.,
Syafruddin and Wahyudi, 2012), industrial raw materials for paint, varnish, ink, wood
preservatives, cosmetics, and pharmaceuticals. Paying attention on the various uses of kemiri
sunan, this plant has the potential to be developed.
Chitosan is an organic compound derived from chitin, derived from chitin biomaterial
which is currently widely used for various purposes such as plant growth promoters, natural
biopesticides to protect plant crops from bacterial and fungal attacks, and as a coating material
for various plant seeds (Uthairatanakij et al., 2007 cit., Anisa, 2014). The provision of chitosan in agriculture can reduce environmental stress due to the dryness or nutrient deficiency, and
improve seed viability, vigor and production. The distribution of chitosan is also able to increase
the chlorophyll content so it increases the effectiveness of photosynthesis (Anonim, 2016). In
addition, chitosan acts as a fertilizer to strengthen the growth (Anisa, 2014). The distribution of
chitosan must be done with the right concentration and frequency in order to be able to increase
the vegetative growth of kemiri sunan plants.
Chitosan has a wide range of uses with high not toxic affinity, is easily degraded, and has
raw materials derived from the nature. Chitosan regulates the plant's immune system and causes
the excretion of an opposing enzyme. Moreover, chitosan not only activates cells, but also
enhances the defense capabilities against the diseases and insects. Chitosan has an effect on
agriculture, for example it acts as a carbon source for microbes in the soil, accelerates the process
of transforming organic compounds into inorganic compounds and helps the root system in
plants to absorb more nutrients from the soil. Chitosan is absorbed by the roots after being
broken down by bacteria in the soil. The usage of chitosan in agriculture, even without chemical
fertilizers, increases the population of microbes in large numbers and the process of transforming
nutrients from organic to inorganic which is more easily absorbed by plant roots (Boonlertnirun
et al., 2008 cit., Ianca, 2010). Chitosan also contains growth regulating substances such as giberelin: GA3, GA5, GA7, Auxin (Indole Acetic Acid) and Cytokines (Kinetin and Zeatin)
Vegetative growth is characterized by various plant growth and development activities
related to the leaf formation and enlargement, the formation of apical or lateral meristems and
growth into branches, and the expansion of plant root systems. The vegetative growth of kemiri
sunan plants is an important thing to know which will be expected to support better generative
growth of plants so that the plants can provide an optimum productivity. Therefore, the
technology innovation of kemiri sunan cultivation is done, one of which is by the chitosan
distribution (Sasmita and Haryanto, 2016) by conducting research entitled "The Effect of
Concentration and Frequency of Chitosan Distribution on the Vegetative Growth of Kemiri
Sunan Plants".
MATERIALS AND RESEARCH METHODS
The research was conducted at the Energy Garden located in Gunung Kelir, Pleret
Subdistrict, Pleret District, Bantul Regency, Special Province of Yogyakarta, which was a garden
developed under the collaboration between the Center for Research and Development of
Electricity Technology, New, Renewable Energy and Energy Conservation (P3TKEEBTKE)
Ministry of Energy and Resources of Mineral Power of the Republic of Indonesia and Universitas Pembangunan Nasional “Veteran” Yogyakarta. This Energy Garden is a pilot plant for vegetable energy sources, one of which is based on kemiri sunan. The research took place
from January to May 2018.
The materials used in this research were seedlings of ± 36 months old high yielding
varieties (KS2), Chitosan, and Insecticides. The tools used were hoes, buckets, stirrers, calipers,
rulers, and stationery.
The research used a Randomized Complete Block Design consisting of 2 factors. The first
factor was the concentration of chitosan (C) consisting of 4 levels, namely: C1 (10 ml / l), C2 (20
ml / l), C3 (30 ml / l), and C4 (40 ml / l). The second factor was the frequency of chitosan (F)
distribution, consisting of 3 levels, namely: F1: 3 times distributin at 20, 40 and 60 days from the
start of observation, F2: 4 times distribution at 15, 30, 45 and 60 days from the start of
observation, and F3: 5 times distribution at 20, 30, 40, 50 and 60 days from the start of the
observation. Of these two factors, 12 treatment combinations were obtained, repeated three
times, and each treatment combination consisted of 3 plants. Being a control i\wass without
Plant preparation began with the plants selection and determination in the field which
would be the object of research. In the field, the planting distance of kemiri sunan was 8 m x 8
m, so that the number of plants that had been determined were in the land of of ± 7000 m2 area.
Chitosan was distributed according to the concentration and time, for the distribution of 15
days in F2 treatment, 20 days in F1 and F3 treatments, 30 days in F2 and F3 treatment, 40 days
in F1 and F3 treatments, 45 days in F2 treatment, 50 days in F3 treatment, and 60 days in F1,
F2, and F3 treatment.
The observation of agronomic characters for the vegetative growth of kemiri sunan plants
was carried out at the age of 70 and 90 days after the initial observation on the parameters of
plant height (cm), number of leaves (strands), and increase in stem diameter (cm), number of
secondary branches, and width of leaves (cm).
The observation data were analyzed for the diversity at the 5% level. To find out the
differences between levels, the analysis continued with DMRT (Duncan Multiple Range Test) at
the level of 5%.
RESULTS AND DISCUSSION
Plant height (cm), number of leaves (strands) and stem diameter (cm) at the beginning of the observation
The results of variance showed that there were interactions between plants that would be
treated with chitosan concentration and the frequency of chitosan distribution on the stem
diameter parameters at the beginning of the observation. The average plant height, number of
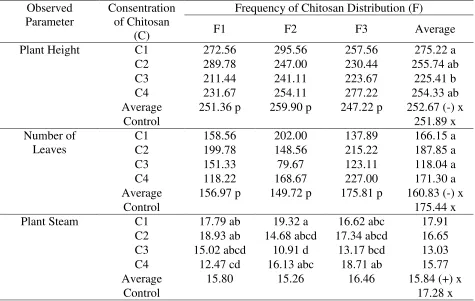
Table 1. Average plant height (cm), number of leaves (strands) and plant stem diameter (cm) of kemiri sunan at the beginning of observation
Observed Parameter
Consentration of Chitosan
(C)
Frequency of Chitosan Distribution (F)
F1 F2 F3 Average
Plant Height C1 272.56 295.56 257.56 275.22 a
C2 289.78 247.00 230.44 255.74 ab
C3 211.44 241.11 223.67 225.41 b
C4 231.67 254.11 277.22 254.33 ab
Average 251.36 p 259.90 p 247.22 p 252.67 (-) x
Control 251.89 x
Number of Leaves
C1 158.56 202.00 137.89 166.15 a
C2 199.78 148.56 215.22 187.85 a
C3 151.33 79.67 123.11 118.04 a
C4 118.22 168.67 227.00 171.30 a
Average 156.97 p 149.72 p 175.81 p 160.83 (-) x
Control 175.44 x
Plant Steam C1 17.79 ab 19.32 a 16.62 abc 17.91
C2 18.93 ab 14.68 abcd 17.34 abcd 16.65 C3 15.02 abcd 10.91 d 13.17 bcd 13.03 C4 12.47 cd 16.13 abc 18.71 ab 15.77
Average 15.80 15.26 16.46 15.84 (+) x
Control 17.28 x
Description: The mean (average) treatment between columns and rows followed by the same letter showed no significant difference in the DMRT test at the 5% level. The sign (-) showed no interaction.
Table 1 showed that the initial observations for plants with the C1F2 code had the largest
stem diameter compared to the diameter of the other plants. The average plant height, number of
leaves and stem diameter between plants that would be treated with chitosan and control were
not different.
Number of Secondary Branches (fruit), Leaf Width (cm) at the beginning of observation
The results of variance showed that there were interactions between plants that would be
treated with chitosan concentration and the frequency of chitosan distribution to the width of the
leaf at the beginning of the observation. The average number of secondary branches and the
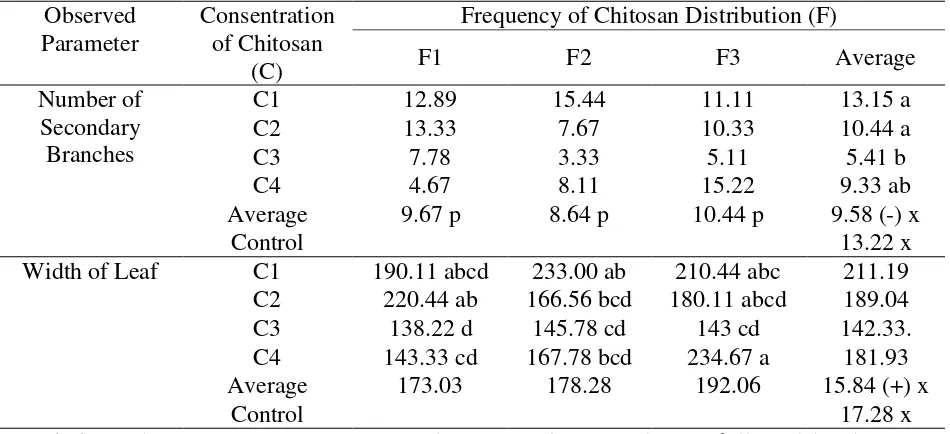
Table 2. Average number of secondary branches (fruit) and width of leaf (cm) kemiri sunan at the beginning of observation
Observed Parameter
Consentration of Chitosan
(C)
Frequency of Chitosan Distribution (F)
F1 F2 F3 Average
Number of Secondary Branches
C1 12.89 15.44 11.11 13.15 a
C2 13.33 7.67 10.33 10.44 a
C3 7.78 3.33 5.11 5.41 b
C4 4.67 8.11 15.22 9.33 ab
Average 9.67 p 8.64 p 10.44 p 9.58 (-) x
Control 13.22 x
Width of Leaf C1 190.11 abcd 233.00 ab 210.44 abc 211.19 C2 220.44 ab 166.56 bcd 180.11 abcd 189.04
C3 138.22 d 145.78 cd 143 cd 142.33.
C4 143.33 cd 167.78 bcd 234.67 a 181.93 Average 173.03 178.28 192.06 15.84 (+) x
Control 17.28 x
Description: The mean (average) treatment between columns and rows followed by the same letter showed no significant difference in the DMRT test at the 5% level. The sign (-) showed no interaction.
Table 2 showed that plants that would be treated with chitosan with the C4F3 code had
the widest leaf. The average of plants that would be given chitosan and would not be given
chitosan (control) had a number of secondary branches and the width of the leaf that were no
different.
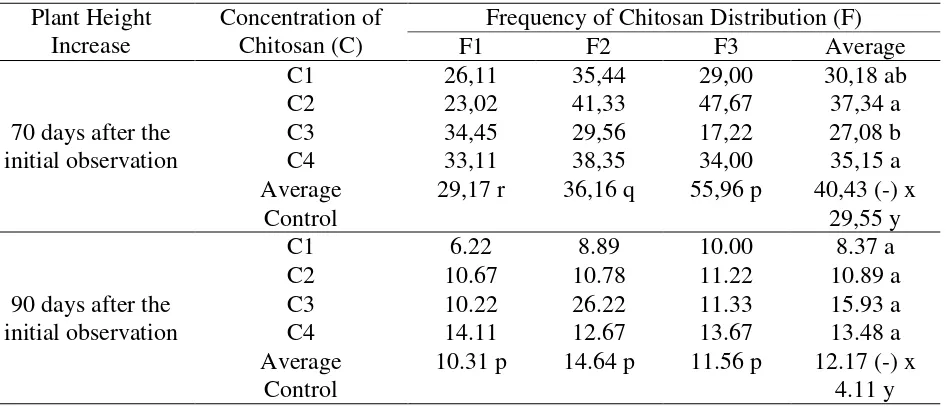
Plant Height Increase (cm)
The results of variance showed that there was no interaction between chitosan
concentration and the frequency of chitosan distribution on the plant height on 70 days and 90
days after initial observation. The average height increase of plants is presented in Table 3.
Table 3 below showed that in observing the high growth of 70-day-old plants, the real
difference occured in each of the single factors. The concentrations of 20 ml / l (C2) and 40 ml / l
(C4) gave higher plant growth than other concentrations. The frequency of 5 times chitosan
distribution (F3) gave higher plant height. The 90 days increase of the plant height after the
initial observation between the treatment concentration and frequency of chitosan of each level
did not show a different effect. Plants that were given chitosan showed the effect of higher and
Table 3. Average height increase of kemiri sunan plants on 70 and 90 days observations after the initial observation
Plant Height Increase
Concentration of Chitosan (C)
Frequency of Chitosan Distribution (F)
F1 F2 F3 Average
70 days after the initial observation
C1 26,11 35,44 29,00 30,18 ab
C2 23,02 41,33 47,67 37,34 a
C3 34,45 29,56 17,22 27,08 b
C4 33,11 38,35 34,00 35,15 a
Average 29,17 r 36,16 q 55,96 p 40,43 (-) x
Control 29,55 y
90 days after the initial observation
C1 6.22 8.89 10.00 8.37 a
C2 10.67 10.78 11.22 10.89 a
C3 10.22 26.22 11.33 15.93 a
C4 14.11 12.67 13.67 13.48 a
Average 10.31 p 14.64 p 11.56 p 12.17 (-) x
Control 4.11 y
Description: The mean (average) treatment between columns and rows followed by the same letter showed no significant difference in the DMRT test at the 5% level. The sign (-) showed no interaction.
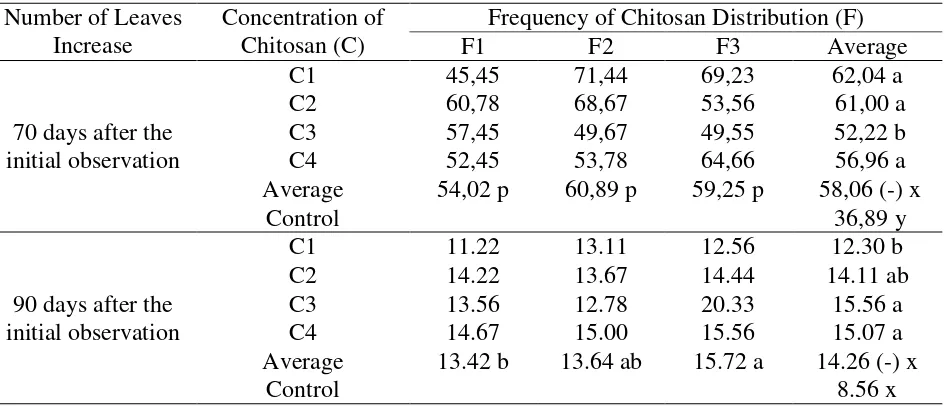
Amount of Leaves (strands)
The results of variance showed that there was no interaction between chitosan
concentration and the frequency of chitosan distribution on the number of leaves at 70 days and
90 days after the initial observation. The average number increase is presented in Table 4.
Table 4 below showed that the observation of the increasing number of leaves aged 70
days after the initial observation at 30 ml / l (C3) concentration treatment showed a different
effect with a smaller average number of leaves than the other concentrations. The chitosan
frequencies on each level did not show a different effect. In observing the increasing number of
leaves aged 90 days after the initial observation, the real difference only occured in each single
factor. The concentrations of 30 ml / l (C2) and 40 ml / l (C3) gave more leaves than other
concentrations. The frequency of 5 times chitosan distribution (F3) gave more number of leaves.
Plants that were given chitosan showed the influence on the different and more number of leaves
Table 4. Average increase in the number of kemiri sunan leaves on the 70 and 90 days observations after the initial observation
Number of Leaves Increase
Concentration of Chitosan (C)
Frequency of Chitosan Distribution (F)
F1 F2 F3 Average
70 days after the initial observation
C1 45,45 71,44 69,23 62,04 a
C2 60,78 68,67 53,56 61,00 a
C3 57,45 49,67 49,55 52,22 b
C4 52,45 53,78 64,66 56,96 a
Average 54,02 p 60,89 p 59,25 p 58,06 (-) x
Control 36,89 y
90 days after the initial observation
C1 11.22 13.11 12.56 12.30 b
C2 14.22 13.67 14.44 14.11 ab
C3 13.56 12.78 20.33 15.56 a
C4 14.67 15.00 15.56 15.07 a
Average 13.42 b 13.64 ab 15.72 a 14.26 (-) x
Control 8.56 x
Description: The mean (average) treatment between columns and rows followed by the same letter showed no significant difference in the DMRT test at the 5% level. The sign (-) showed no interaction.
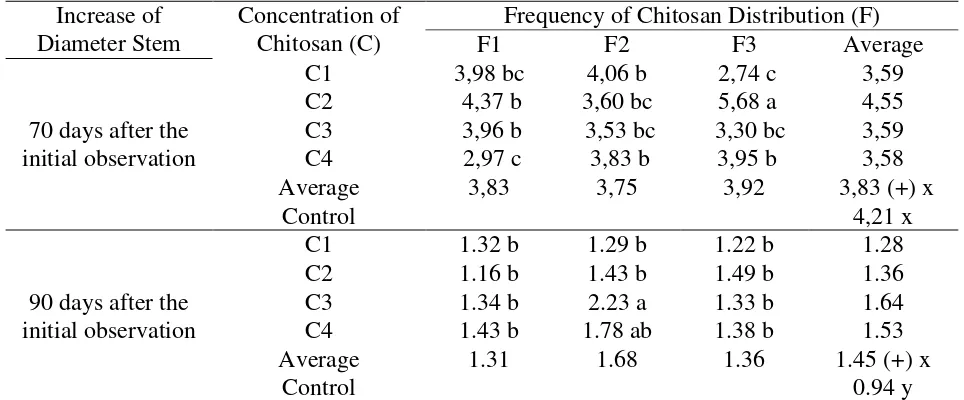
Stem Diameter Increase (cm)
The results of variance showed that there was an interaction between chitosan
concentration and the frequency of chitosan distribution on the increase of the stem diameter at
70 days and 90 days after the initial observation. The average increase in stem diameter is
presented in Table 5.
Table 5 below showed that the 70 days observations since the initial observation of C2F3
treatment combination (concentration of 20 ml / l and frequency of 5 times distribution) gave a
different effect on the increase of stem diameter than the other treatment combinations. At the 90
days observation since the initial observation, the combination of C3F2 treatment (concentration
of 30 ml / l and frequency of 4 times distribution) gave a greater increase in the stem diameter
than other treatment combinations. The average increase in stem diameter on the 90 days
observations after the initial observation for plants given chitosan showed a different and greater
Table 5. Average increase of the diameter of kemiri sunan stems on 70 and 90 days observations after the initial observation
Increase of Diameter Stem
Concentration of Chitosan (C)
Frequency of Chitosan Distribution (F)
F1 F2 F3 Average
70 days after the initial observation
C1 3,98 bc 4,06 b 2,74 c 3,59
C2 4,37 b 3,60 bc 5,68 a 4,55
C3 3,96 b 3,53 bc 3,30 bc 3,59
C4 2,97 c 3,83 b 3,95 b 3,58
Average 3,83 3,75 3,92 3,83 (+) x
Control 4,21 x
90 days after the initial observation
C1 1.32 b 1.29 b 1.22 b 1.28
C2 1.16 b 1.43 b 1.49 b 1.36
C3 1.34 b 2.23 a 1.33 b 1.64
C4 1.43 b 1.78 ab 1.38 b 1.53
Average 1.31 1.68 1.36 1.45 (+) x
Control 0.94 y
Description: The mean (average) treatment between columns and rows followed by the same letter showed no significant difference in the DMRT test at the 5% level. The sign (-) showed no interaction.
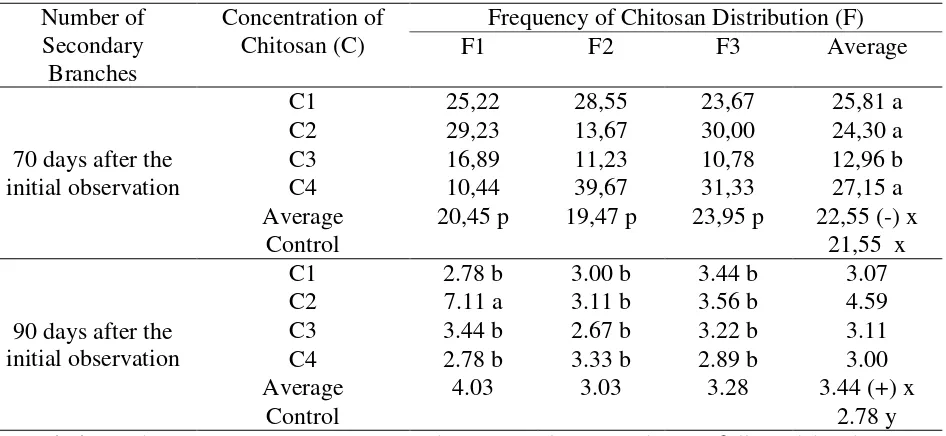
Number of Secondary Branches
The results of the variance showed that there was an interaction between chitosan
concentration and the frequency of chitosan distribution on the average number of secondary
branches increased on the 90 days after the initial observation. The average increase in stem
diameter is presented in Table 6.
Table 6 below showed that the observation on the number of secondary branches on the
70 days after the initial observation at 30 ml / l (C3) concentration treatment showed a different
effect with a smaller number of secondary branches compared to the other concentrations. Each
level did not show a different effect for the chitosan frequencies. The average number of
secondary branches increased on the 90 days observations after the initial observation, the
number of secondary branches was more than the other treatments for C2F1 treatment
combination (concentration of 20 ml / l and frequency of 3 times distribution). The number of
secondary branches was different and more numerous between plants that were given chitosan
with plants that were not given chitosan (control).
Table 6. Average increase in the number of secondary branches of kemiri sunan plants on the 70 and 90 days observations after the initial observation
Number of Secondary Branches
Concentration of Chitosan (C)
Frequency of Chitosan Distribution (F)
F1 F2 F3 Average
70 days after the initial observation
C1 25,22 28,55 23,67 25,81 a
C2 29,23 13,67 30,00 24,30 a
C3 16,89 11,23 10,78 12,96 b
C4 10,44 39,67 31,33 27,15 a
Average 20,45 p 19,47 p 23,95 p 22,55 (-) x
Control 21,55 x
90 days after the initial observation
C1 2.78 b 3.00 b 3.44 b 3.07
C2 7.11 a 3.11 b 3.56 b 4.59
C3 3.44 b 2.67 b 3.22 b 3.11
C4 2.78 b 3.33 b 2.89 b 3.00
Average 4.03 3.03 3.28 3.44 (+) x
Control 2.78 y
Description: The mean (average) treatment between columns and rows followed by the same letter showed no significant difference in the DMRT test at the 5% level. The sign (-) showed no interaction.
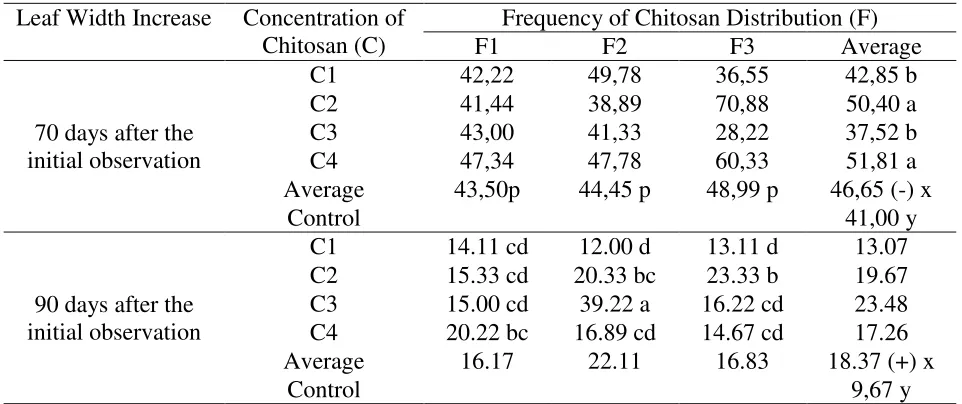
Leaf Width Increase (cm)
The results of variance showed that there was an interaction between chitosan
concentration and the frequency of chitosan distribution on the average width of the leaf growth
on the 90 days from the initial observation. The average width of the leaf is presented in Table 7.
Table 7 showed that there was a significant difference occurred in the chitosan
concentration factor after observing the increase of the the 70-day-old leaf width, where the
concentrations of 20 ml / l (C2) and 40 ml / l (C4) gave wider width of the leaf than the other
concentration. The frequency factor of chitosan distribution in each level showed the same
effect. On the 90 days observation after the initial observation, the average increase of the width
in the C3F2 treatment combination (30 ml / l concentration and 4 times the frequency of
distribution) gave the largest increase in leaf compared to the other treatment combinations.
There was a wide and different width of leaf between the plants given chitosan and not given
Table 7. The average leaf width increase of the kemiri sunan plant canopy on the 70 and 90 days observations after the initial observation
Leaf Width Increase Concentration of Chitosan (C)
Frequency of Chitosan Distribution (F)
F1 F2 F3 Average
70 days after the initial observation
C1 42,22 49,78 36,55 42,85 b
C2 41,44 38,89 70,88 50,40 a
C3 43,00 41,33 28,22 37,52 b
C4 47,34 47,78 60,33 51,81 a
Average 43,50p 44,45 p 48,99 p 46,65 (-) x
Control 41,00 y
90 days after the initial observation
C1 14.11 cd 12.00 d 13.11 d 13.07 C2 15.33 cd 20.33 bc 23.33 b 19.67 C3 15.00 cd 39.22 a 16.22 cd 23.48 C4 20.22 bc 16.89 cd 14.67 cd 17.26
Average 16.17 22.11 16.83 18.37 (+) x
Control 9,67 y
Description: The mean (average) treatment between columns and rows followed by the same letter showed no significant difference in the DMRT test at the 5% level. The sign (-) showed no interaction.
The use of chitosan can be an alternative in an effort to increase the vegetative growth of
kemiri sunan plants. The distribution of chitosan with a concentration of 20 ml / l, 30 ml / l and
40 ml / l generally gave a better effect than the concentration of 10 ml / l. The frequency of 4
times and 5 times chitosan distribution in general gave a better effect than the frequency of 3
times chitosan distribution and could increase the vegetative growth of kemiri sunan plants. The
results showed that from the observed parameters, the vegetative growth of the kemiri sunan
plant which was given chitosan showed a better growth rate compared to plants that were not
given chitosan (control). The role of chitosan in improving plant metabolism caused the increase
plant growth. Chitosan is a form of polysaccharide that functions as a biological signal in cells
and is able to regulate symbiotic defenses, as well as plant development processes (Dzung,
2010). Chitosan contains Plant Growth Promotor in the form of giberelin, IAA, and Zeatin
(Rekso, 2005). According to Mawgoud et al. (2016), chitosan is known to increase the number of
CONCLUSIONS AND RECOMMENDATIONS Conclusion
1. There was an interaction between the treatment of chitosan concentration and the frequency
of chitosan distribution on the parameters of the increase in stem diameter (C2F3), the
increase of the number of secondary branches (C2F1) and the width of the leaf (C3F2).
2. The concentration of chitosan 20 ml / l, 30 ml / l, and 40 ml / l gave a better effect than the
concentration of 10 ml / l in all parameters observed.
3. Frequency of 4 and 5 times chitosan distribution gave a better effect on most of the
parameters observed compared to the frequency of 3 times distribution.
4. Plants that were treated with chitosan had a better vegerative growth than those without
chitosan (control).
Recommendation
The frequency of 4 times chitosan distribution is recommended to be applied to kemiri
sunan plants because it gives the same good effect as the 5 times chitosan distribution.
Besides, seen from the aspect of efficiency in using chitosan, the 4 times distribution was
more economical than 5 times, be able avoide the waste.
REFERENCES
Anisa, F. 2014. Pengaruh Chitosan dan Coumarin terhadap Pertumbuhan dan Hasil Benih Kentang (Solanum tuberosum) G2 Kultivar Granola. Agric. Sci. J. Vol I No. 4: 100-10 (2014).
Anonim. 2013. Oligokhitosan sebagai Plant Elicitor (pe), Plant Growth Promotor (pgp), dan Anti Virus. Pelatihan Perakitan Varietas Padi dan Penangkaran Benih. Jakarta. 19 November 2013. Badan Tenaga Nuklir Nasional.
Anonim. 2016. Fitosan. Laboratorium Bahan Industri – Pusat Aplikasi Teknologi Isotop & Radiasi. Jakarta.
Darwis, D. 2015. Oligokhitosan sebagai Plant Elicitor dan Zat Pemercepat Tumbuh Tanaman.Pelatihan Aplikasi Iptek Nuklir dalam Pengembangan Pertanian Mendukung Kedaulatan Pangan Nasional. Jakarta. 20 April 2015. Pusat Pendidikan dan Pelatihan Badan Tenaga Nuklir Nasional.
Herman, M., N. Heryana, dan H. Supiadi. 2009. Prospek Kemiri Sunan Sebagai Penghasil Minyak Nabati: Kemiri Sunan Penghasil Biodiesel. Bunga Rampai, Solusi Masalah Energi Masa Depan. Unit Penerbitan dan Publikasi Balittri Sukabumi. Hal 5-12.
Herman, M dan E.Wardiana.2009. Pengaruh Naungan dan Media Tanam Terhadap Pertumbuhan Bibit Kemiri Sunan (Reutealis trisperma (Blanco) Airy Shaw).Buletin RISTRI Vol. 1 (4). Hal 197-205.
Herman, M., M. Syakir, D. Pranowo, Saefudin, dan Sumanto. 2013. Kemiri Sunan (Reutealis trisperma (Blanco) Airy Shaw). Tanaman Penghasil Minyak Nabati dan Konservasi Lahan. IAARD Press. Jakarta. 91 Hal.
Ianca, B. F. 2010. Pengaruh Perlakuan Kitosan terhadap Pertumbuhan dan Hasil Tanaman Kedelai Selama Fase Vegetatif dan Awal Fase Generatif. Departemen Teknologi Hasil Perairan. Fakultas Perikanan dan Ilmu Kelautan.Institut Pertanian Bogor.
Kumar MNR. 2000. A review of Chitin and Chitosan Application. J. Reac and Func Poly. 46: 1-27.
Pranowo, D., dan Rusli. 2012. Penampilan Sifat Agronomi Tanaman Kemiri Sunan (Reutealis trisperma (Blanco) Airy Shaw) yang Berasal Dari Biji dan Grafting. Buletin RISTRI 3 (3): 251-252.
Sasmita, E. R. dan D. Haryanto. 2016. Penerapan Kitosan terhadap Pertumbuhan Vegetatif Tanaman Kemiri Sunan. Agrivet. Jurnal Prodi Agroteknologi Fakultas Pertanian UPN “Veteran” Yogyakarta. Vol. 22 No. 2 Desember 2016. 27-36.
Syafaruddin dan A. Wahyudi. 2012. Potensi Varietas Unggul Kemiri Sunan Sebagai Sumber Energi Bahan Bakar Nabati. Perspektif Vol. 11 No. 1.Juni. Hal 59-67.
Suptijah P. 2006. Deskripsi Karakteristik Fungsional dan Aplikasi Kitin dan Kitosan. Prosiding Seminar Nasional Kitin dan Kitosan.
Tresniawati, C., E. Murniati, E. Widayati. 2014. Perubahan Fisik, Fisiologi dan Biokimia Selama Pemasakan Benih dan Studi Rekalsitran Benih Kemiri Sunan. J. Agron Indonesia 42 (1): 74-79.
Vossen, H.A.M., dan B.E. Umali. 2002. Plant Resources of South East Asia No. 14. Prosea Foundation. Bogor. Indonesia.