www.oecd.org/publishing
DAC Guidelines and Reference Series
A Good Practice Paper
Natural Resources
and Pro-Poor Growth
AND DEVELOPMENT
The OECD is a unique forum where the governments of 30 democracies work together to address the economic, social and environmental challenges of globalisation. The OECD is also at the forefront of efforts to understand and to help governments respond to new developments and concerns, such as corporate governance, the information economy and the challenges of an ageing population. The Organisation provides a setting where governments can compare policy experiences, seek answers to common problems, identify good practice and work to co-ordinate domestic and international policies.
The OECD member countries are: Australia, Austria, Belgium, Canada, the Czech Republic, Denmark, Finland, France, Germany, Greece, Hungary, Iceland, Ireland, Italy, Japan, Korea, Luxembourg, Mexico, the Netherlands, New Zealand, Norway, Poland, Portugal, the Slovak Republic, Spain, Sweden, Switzerland, Turkey, the United Kingdom and the United States. The Commission of the European Communities takes part in the work of the OECD.
OECD Publishing disseminates widely the results of the Organisation’s statistics gathering and research on economic, social and environmental issues, as well as the conventions, guidelines and standards agreed by its members.
Also available in French under the title:
Ressources naturelles et croissance pro-pauvres
ENJEUX ÉCONOMIQUES ET POLITIQUES Revised version (2009)
For more details, please visit: http://www.oecd.org/dataoecd/56/63/42341879.pdf.
Corrigenda to OECD publications may be found on line at: www.oecd.org/publishing/corrigenda. © OECD 2008
You can copy, download or print OECD content for your own use, and you can include excerpts from OECD publications, databases and multimedia products in your own documents, presentations, blogs, websites and teaching materials, provided that suitable acknowledgment of OECD as source and copyright owner is given. All requests for public or commercial use and translation rights should be submitted to [email protected]. Requests for permission to photocopy portions of this material for public or commercial use shall be addressed directly to the Copyright Clearance Center (CCC)
Foreword
I
t is widely acknowledged that the eradication of poverty and the achievement of the Millennium Development Goals are closely linked to sound natural resource and environmental management. Threats to the environment and natural resources, coupled with poor management, have serious implications for both poverty reduction and sustainable economic development.The “OECD Environmental Strategy for the First Decade of the 21st Century”, adopted in 2001, and the 2008 OECD Environmental Outlook recognise these linkages and the need for co-operative action to support effective and sustainable natural resource management in developing countries.
Acknowledgements
This publication is the result of work undertaken by the OECD-DAC Network on Development Co-operation and Environment (ENVIRONET). It was prepared by a Task Team led by the Netherlands (Mr. Piet Klop and Mr. Jos Lubbers).
For the following chapters, special mention must be made as follows:
● Chapter 3. The Economics of Sustainable Natural Resource Management: Mr. Denis Loyer and Mr. Dominique Rojat (France).
● Chapter 4. Politics of Natural Resources: Mrs. Anke Fischer and Mr. Jan-Peter Schemmel (Germany).
● Chapter 5. Conclusions and Recommendations for Policy Makers: Mr. Jos Lubbers (Netherlands).
● Chapter 6. Fisheries for Pro-Poor Growth: Mr. Tim Bostock (UK).
● Chapter 7. Forestry for Pro-Poor Growth: Mr. Paul Steele (UNDP) and Mr. Remy Paris (OECD).
● Chapter 8. Wildlife and Nature-Based Tourism for Pro-Poor Growth: Mr. James MacGregor and Mrs. Dilys Roe (IIED).
● Chapter 9. Soil Productivity and Pro-Poor Growth: Mr. Piet Klop (Netherlands).
● Chapter 10. Water Security and Pro-Poor Growth: Mr. Piet Klop (Netherlands).
● Chapter 11. Minerals for Pro-Poor Growth: Mr. Jon Hobbs (UK) and Mr. Olof Drakenberg.
● Chapter 12. Renewable Energy and Pro-Poor Growth: Mrs. Jo-ella van Rijn (Netherlands).
Inputs were provided by representatives of the following partner governments: Ghana (Mr. Winfed Nelson), Tanzania and Vietnam (Mr. Tien).
The following OECD bodies and directorates also provided input: the joint ENVIRONET/ WPGSP Task Team on Governance and Capacity Development for Natural Resource and Environmental Management, the DAC POVNET, the Committee on Fisheries, the OECD Trade and Agriculture Directorate, and the unit in the Secretary-General’s Office working on Policy Coherence for Development.
Mr. Remy Paris, Mr. Clemens Beckers, Mrs. Tamara Levine and Mrs. Anna Brüderle of the OECD Secretariat provided substantive and managerial assistance to the Task Team, while Mrs. Maria Consolati provided invaluable secretarial assistance.
Workshops and seminars to provide inputs were held in Paris (hosted by the OECD), Germany (hosted by BMZ/GTZ), London (hosted by IIED), in the US (hosted by the IMF), Canada (hosted by CIDA), and the Netherlands (hosted by DGIS). A description of the drafting process and supporting case studies have been collected and published on the poverty-environment website www.povertyenvironment.net/pep.
Table of Contents
Preface. . . 13
Natural Resources and Pro-Poor Growth: The Economics and Politics. . . 15
Executive summary . . . 16
Introduction to Part I: Overview of key issues . . . 16
Introduction to Part II: Key natural resources for pro-poor growth. . . 20
Part I Overview of Key Issues Chapter 1. Introduction . . . 25
Notes . . . 27
Chapter 2. Some Unique Features of Natural Resources. . . 29
2.1. The varied forms and functions of natural capital . . . 30
2.2. Measuring and monitoring natural resource stocks . . . 30
2.3. The natural resources “curse” . . . 31
Note. . . 33
Chapter 3. The Economics of Sustainable Natural Resource Management. . . 35
3.1. Overview . . . 36
3.2. Natural capital contributes directly to incomes, employment and fiscal revenues . . . 37
3.3. Natural resources underpin the livelihoods of many among the poorest. . . 38
3.4. Natural resources provide a safety net in times of crisis. . . 40
3.5. Natural resources generate a wide range of positive externalities at the national and global levels . . . 41
3.6. Sustainable natural resource management raises unique challenges . . . 41
3.7. Converting natural resources into other forms of capital: Some key issues. . . 45
3.8. Natural resource management in support of pro-poor growth: Key approaches . 49 Notes . . . 54
Chapter 4. Politics of Natural Resources. . . 55
4.1. Key factors for natural resource management . . . 56
4.2. Policies and measures for pro-poor, sustainable resource governance. . . 63
4.3. Managing the policy process: Political change in support of pro-poor natural resource management. . . 66
4.4. Conclusions. . . 68
Chapter 5. Conclusions and Recommendations for Policy Makers. . . 71
5.1. Conclusions. . . 72
5.2. Recommendations . . . 73
Notes . . . 78
Checklist for Practitioners. . . 79
Socio-economic aspects of natural resource management . . . 79
Capacity and governance for natural resource management . . . 80
Part II Key Natural Resources for Pro-Poor Growth Chapter 6. Fisheries for Pro-Poor Growth. . . 83
6.1. Overview . . . 84
6.2. The contribution of fisheries towards growth and the economy . . . 84
6.3. What role can fisheries play in lifting people out of poverty? . . . 89
6.4. The politics of sustaining pro-poor fisheries . . . 92
Notes . . . 94
Chapter 7. Forestry for Pro-Poor Growth . . . 95
7.1. Overview . . . 96
7.2. Contribution of forests towards growth and the economy . . . 96
7.3. What is the potential for forests to lift the poor out of poverty? . . . 98
7.4. The politics of increasing the role of forests to promote pro-poor growth . . . . 102
Chapter 8. Wildlife and Nature-Based Tourism for Pro-Poor Growth. . . 105
8.1. Overview . . . 106
8.2. Wildlife and poverty: Safety nets and wealth creation . . . 106
8.3. Contribution of nature-based tourism towards growth and the economy . . . . 107
8.4. What is the potential for nature-based tourism to lift the poor out of poverty? . . 108
8.5. Trophy hunting . . . 112
8.6. The politics of increasing the role of nature tourism to promote pro-poor growth . . . 113
8.7. Wildlife trade . . . 113
Notes . . . 115
Chapter 9. Soil Productivity and Pro-Poor Growth. . . 117
9.1. Overview . . . 118
9.2. The contribution of soil management to growth . . . 119
9.3. Policies and measures to encourage improved soil management . . . 121
Chapter 10. Water Security and Pro-Poor Growth . . . 123
10.1. Overview . . . 124
10.2. The potential contribution of water resources management to pro-poor growth . . . 126
10.3. Ensuring responsible water management . . . 129
10.4. The politics of water management to promote pro-poor growth. . . 131
Chapter 11. Minerals and Pro-Poor Growth. . . 135
11.3. Environmental impacts of mining. . . 138
11.4. What is the potential for mining to lift the poor out of poverty? . . . 139
11.5. The politics of increasing the role of mining to promote pro-poor growth . . . 142
Chapter 12. Renewable Energy and Pro-Poor Growth. . . 145
12.1. Overview . . . 146
12.2. Recent trends in renewable energy: Renewables on the rise . . . 146
12.3. What role can renewable energy play in supporting pro-poor growth? . . . 150
12.4. Policies and measures for harnessing the potential benefits of renewable energy. . . 152
12.5. Conclusion . . . . 156
Notes . . . 157
Bibliography. . . 159
Boxes 1.1. Climate change: The expected impacts on developing countries . . . 27
3.1. Pro-poor growth. . . 36
3.2. Some examples of accounting for informal forestry activities in national income accounts . . . 39
3.3. Importance of watersheds for urban electricity in Africa . . . 41
3.4. Payment for watershed preservation services . . . 44
3.5. Political priorities on the management of natural resources determine the optimal rate of exploitation . . . 44
3.6. Hartwick’s rule and Hotelling’s rule . . . 45
3.7. Genuine net saving: An indicator to assess overall capital stock . . . 46
3.8. Natural resources and the poor in India and Uganda . . . 49
3.9. Rising shrimp prices in Madagascar . . . 52
3.10. Growing demand for “fair trade” and environmentally certified products . . . 52
4.1. Clash of formal and informal land use rules. . . 62
4.2. Fisheries livelihoods dominated by the elite in Bangladesh. . . 62
4.3. Participatory forest management in Himachal Pradesh, India: Benefit flows and distribution . . . 65
4.4. Mining . . . 65
4.5. South Africa’s water laws and their implementation . . . 67
6.1. Aquaculture has rapidly gained economic importance, but is not necessarily pro-poor . . . 85
6.2. Economic role of the fisheries sector in Bangladesh . . . 88
6.3. Hard bargaining for public revenues from foreign fishers: Successes in Africa. . . 90
6.4. Improved fishery management and increased rent capture in Namibia . . . 91
6.5. Promoting growth of the Madagascar shrimp industry. . . 92
6.6. Pro-poor growth in South Africa’s hake fishery . . . 93
6.7. Trawler bans in Kerala: Mobilisation of marginal fishermen to demand pro-poor growth. . . 94
7.1. Outgrower schemes in South Africa (2000) . . . 100
7.2. Can forest conversion be economically beneficial and pro-poor? . . . 101
7.4. Bolivia is a world leader in certified timber. . . 103
7.5. Extractivist reserves in Brazil: Sustaining pro-poor growth . . . 104
8.1. Pro-poor growth in Indian protected areas . . . 110
8.2. Trophy hunting in Tanzania . . . 112
9.1. Conservation agriculture . . . 120
9.2. Investing in soil management in North China and in Niger . . . 121
10.1. Hostages to hydrology . . . 125
10.2. Irrigation water and economic growth in India: Successful investments in water resource management help India cope with climate variability . . . 128
10.3. Valuing the Zambezi’s wetlands as an infrastructure alternative. . . 130
10.4. Pakistan and water problems . . . 130
10.5. South Africa’s water laws and their implementation . . . 132
10.6. Importance of urban tenure for water supply: The example of Guatemala. . . 133
11.1. Diamond mining in Sierra Leone . . . 140
11.2. Artisanal mining in the Democratic Republic of the Congo (DRC). . . 141
11.3. Diamond mining in Botswana. . . 141
11.4. The Extractive Industries Transparency Initiative . . . 143
11.5. Three key elements of good governance . . . 144
12.1. Geothermal energy potential in Africa. . . 149
12.2. Cost-benefit analysis of a micro-hydro system in Nepal . . . 151
12.3. Sustainable small-scale biofuels promoting rural development in Kenya . . . 152
12.4. Wind energy in India . . . 153
12.5. Promoting solar photovoltaic systems in Africa. . . 154
12.6. Improving energy access in rural Argentina with renewable energy . . . 155
12.7. PSAES: The German-Senegalese Photovoltaic Project . . . 155
12.8. Solar home system electricity provision: Yeelen Kura, Mali. . . 156
Tables 9.1. Analysis of national annual costs of soil degradation in selected countries . . . . 119
11.1. Developing and transition economies with higher dependency on exports of minerals: Mining’s contribution to total exports . . . 138
Figures 3.1. Composition of total wealth in low-income countries . . . 37
3.2. Uganda: Quantifying the importance of environment and natural resources. . . 38
3.3. Household income by source, Masvingo province, Zimbabwe. . . 39
4.1. Characteristics of natural resources. . . 57
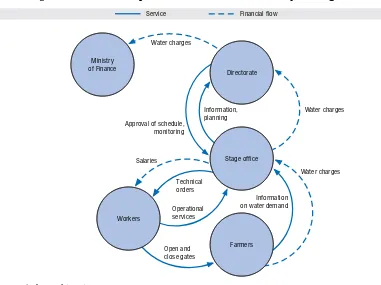
4.2. Relationships between actors: A case study on irrigation. . . 60
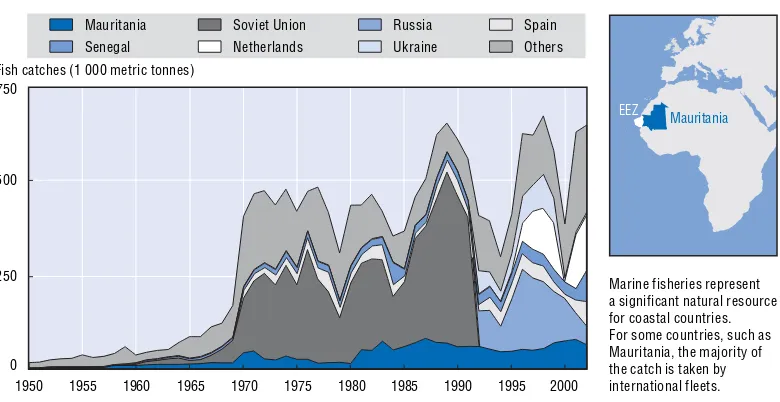
6.1. Catches in the Mauritania exclusive economic zone (EEZ), 1950-2002 . . . 85
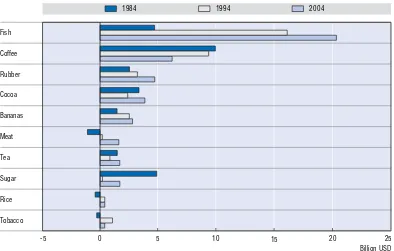
6.2. Net exports of selected agricultural commodities by developing countries . . . . 86
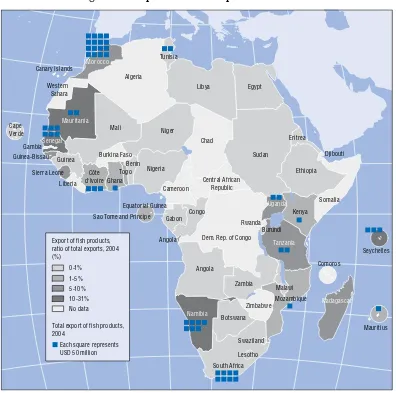
6.3. Export of fisheries products in Africa. . . 87
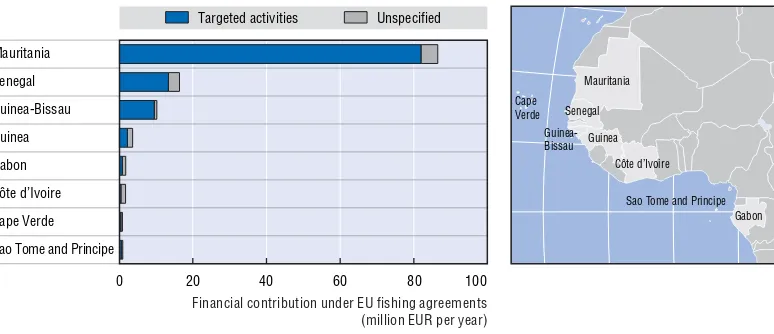
6.4. EU fishing agreements with West and Central African countries . . . 88
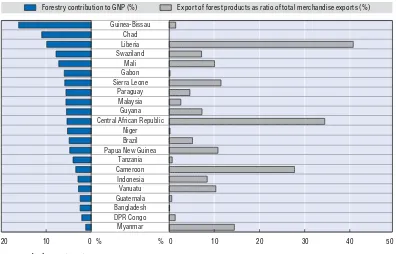
7.1. Contribution of forest to GDP, and ratio of forest exports out of total exports, for selected countries . . . 97
8.1. Employment in the travel and tourism industry in Africa, 2006 . . . 108
8.2. Economic impacts of gorilla tourism in Uganda. . . 109
12.1. Renewable energy: Electricity generation costs as a percentage of 1980 levels,
historical and projected . . . 147
12.2. Cost competitiveness of selected renewable power technologies . . . 147
12.3. Annual investment in renewable energy world total, 1995-2007 . . . 148
12.4. Renewable energy growth rates (UNDESA, 2005) . . . 149
Preface
I
f economic growth, poverty reduction and industrial development are top priorities for most developing countries, why should policy makers in partner and donor countries worry about natural resources?The answer is simple: natural resources provide soil to grow food, and water for drinking, washing and irrigation. Forests and rivers provide fish to eat or export and raw materials for a wide range of industries. In many countries natural landscapes and wildlife reserves are major factors in attracting tourism. So managing natural resources properly is actually about safeguarding food production, and about preserving livelihoods and export opportunities.
Moreover, in economic terms, natural capital constitutes a quarter of total wealth in low-income countries and natural resources are often the principal source of income of the poorest people.
Various global environmental assessments show a continuous decline of natural resources, increasing the vulnerability of the poor as a result of ecosystem stress, competition for space, soaring food and energy prices and climate change. Concerns about the implications of environmental degradation have never been as widely documented and shared as today.
By contrast, the resultant lost opportunities for economic development and poverty reduction in developing countries have received scant attention. This publication tries to make amends by highlighting the many contributions natural resources can make to economic development and the critical role sound natural resource management plays in pro-poor growth strategies.
But better management of natural resources will not automatically lead to poverty reduction. What is needed are conducive political, institutional and governance frameworks. Empowerment of the poor, women and marginalised groups is essential.
Let us be more aware of the opportunities represented by the world’s natural heritage and make every effort to bring about proper political processes and decisions that will enable the world’s natural resources to be enjoyed in a fair and sustainable manner.
Bert Koenders, Eckhard Deutscher,
Minister for Development Co-operation Chairman,
Natural Resources and Pro-Poor Growth: The Economics and Politics © OECD 2008
Executive summary
Natural resources can generate and sustain growth, thereby reducing poverty and supporting the achievement of the Millennium Development Goals (MDGs). It is therefore urgent to improve natural resource management for long-term pro-poor economic growth, i.e.a pace and pattern of growth that enhances the ability of poor women and men to participate in, contribute to and benefit from growth.
Moreover, the international context of natural resource management is changing. Many emerging economies are major importers of natural resources. This increased demand for natural resources makes improved resource management even more urgent.
This publication focuses on the economic dimensions of natural resource management. It is intended to encourage decision makers from development co-operation agencies and ministries of finance and planning in partner countries to recognise the contribution of natural resources to pro-poor growth and the importance of policies which nurture their sustainable management.
It also provides an overview of the “politics” of natural resource management, aimed at identifying the roles and influence of different stakeholders and their incentives and disincentives for sustainable natural resource use. It points to the need for innovative coalitions to drive change and promote sustainable management. Past approaches that focused on more technocratic interventions have often overlooked these political challenges. Additionally, ways to increase policy coherence for development in natural resource management are outlined. Policy makers in OECD and partner countries, as well as development co-operation agencies, are in prime positions to address the political challenges of natural resource management for long-term pro-poor economic growth.
Seven natural resource sectors are examined which have a critical role to play in sustaining pro-poor growth. They are: fisheries, forests, wildlife and nature-based tourism, soil productivity, water security, minerals, and renewable energy. They are all key natural resources which, if effectively managed, can contribute to sustainable pro-poor growth.
Introduction to Part I: Overview of key issues
Generating pro-poor growth is key to the achievement of the MDGs. There is a
While the proportion of the world’s poor living in towns and cities is gradually rising, most of the world’s poor will continue to live in rural areas for many decades to come. Poor people’s livelihoods will remain heavily dependent on natural resources: soil, water, forests and fisheries underpin commercial and subsistence activities and often provide a safety net for the poor in times of crisis. Strategies for rural poverty reduction, including pro-poor natural resource management, should remain at centre stage for poverty reduction.
Natural capital contributes directly to economic incomes, employment and fiscal
revenues. Natural resources, renewable and non-renewable, are fundamental to economic
activity in many ways. Goods produced from renewable natural capital include timber and non-timber forest products, catches of wild fish, etc. Goods produced from non-renewable natural resources are mainly oil and minerals. These goods form the basis of the economy in many developing countries. Examples include the forestry wealth of Cameroon and Indonesia and the fishery wealth of Mauritania and the Pacific islands. Nature-based tourism is an important component of the international tourist receipts earned in some low-income countries in Africa, Asia and Latin America. Soil and water resources are essential for agricultural activities, a key part of the economy in many developing countries. Mineral extraction contributes considerably to the wealth of countries such as Kuwait and Botswana. Renewable energy can play a key role in providing poor people with energy access.
Natural capital is particularly important in developing countries. It accounts for an estimated 26% of total wealth in low-income countries, 13% of wealth in middle-income countries and only 2% of wealth in industrialised or OECD countries. Moreover, primary production represents a much higher share of production, domestic trade, exports and national income in developing countries compared with that in industrialised countries. Natural resource-based enterprises thus provide important employment and income opportunities.
Natural resources underpin the livelihoods of many among the poorest. The poor are
often highly dependent on “common property” natural resources, which include fallow fields, forests, fishing grounds, pastureland and wetlands, for their livelihoods. For many rural poor, common property natural resources are an important source of food, fodder, fuel, building materials, medicinal plants and income. In India, it has been estimated that common property resources provide about 12% of household income to poor families. In general the poorer the household, the more important is the income contribution through common property resources.
Natural resources generate a wide range of positive externalities at the local,
national and global levels. In addition to goods, natural resources produce services; for
example, water filtration and purification services provided by wetlands or regulations of water cycles provided by watersheds. Local or national-level natural resource services
include, for example, the soil stability provided by upstream vegetation in a watershed, which contributes to the good functioning of downstream water supply, irrigation or hydro-electric facilities. Global level services include carbon sequestration by forests or soils, which helps mitigate climate change.
Sustainable natural resource management raises unique challenges. Sustainable
Natural resource management gives rise to unique challenges. Natural resource-based economies are vulnerable to “boom and bust” cycles, i.e. large terms of trade shocks caused by sharp falls in the prices of main export commodities. In addition, when a country suddenly discovers large quantities of natural resources and starts exporting them, or an existing resource sector increases its weight in the export market quickly, this can result in a significant change in the rate of exchange which in turn can lead to a decrease in competitiveness of other sectors. This situation is known as “Dutch disease”. Stabilisation funds, specific public investment funded by windfall revenue, the use of conservative price assumptions for major export commodities, export diversification, appropriate use of tax systems, and keeping external debt at a sustainable level are some important policy responses to these “boom and bust” cycles and “Dutch disease”. Payment for environmental service schemes and specially designed market mechanisms for environmental services such as carbon sequestration may also help to address the “absent market” challenge.
Furthermore, the international context of natural resource management is changing. Many emerging economies are major importers of natural resources. This increased demand for natural resources makes improved resource management even more urgent.
With sound management, natural resources can provide the basis for long-term
sustainable pro-poor growth. To ensure that natural resources help not only support but
also sustain growth, they need to be used efficiently, equitably and sustainably. For example, their commercial value can be maximised through increased quality or processing and their productivity can be increased through investment in human and man-made capital. Fiscal revenues can be channelled towards pro-poor investments, while framework conditions for policies that promote diversification away from natural resource extraction can facilitate more value-added activities.
The conversion of natural resources into other forms of capital, including social and human capital, can provide a basis for sustainable growth only if certain conditions are met (e.g.through investment in education). Decisions to convert natural resources into other forms of wealth must take into account all relevant social, economic and environmental factors. There are often trade-offs between different stakeholders as well as critical thresholds of conversion which must not be reached. Beyond certain limits, natural resource wealth and the associated flow of economic, social and environmental benefits can collapse, sometimes irreversibly. Certain natural resources are irreplaceable and need to be preserved to sustain long-term growth and inter-generational equity.
The political and governance dimensions play a key role in pro-poor natural
resources management. Governance of natural resources should be informed by the
characteristics of those resources, the actors involved and the institutional framework and rules. The special characteristics of natural resources (such as unclear property rights, multiple claims and functions, lack of market prices, remote location and difficult access), in combination with weak institutions, give rise to special challenges in this regard.
Governance of natural resources requires choosing policies that have political dimensions, such as market-based measures, regulation, co-operation, and information. The distributional impacts of these policies vary. To ensure pro-poor results, particular attention should be paid to a meaningful participation of the poor in governance processes. Political change can not be imposed from the outside. It must be based on broad ownership of decision-making processes. “Coalitions for change” (led by all citizens, civil society organisations, politicians, government bodies, the private sector and development agencies) can facilitate policy changes in support of natural resource management for pro-poor growth. A key challenge of political change is to move changes initiated at the local level up to the national level.
Conclusions and recommendations for policy makers
Some fundamental facts deserve more attention from policy makers if growth is to unfold its full potential for lasting poverty reduction. First, poor countries are much more dependent on natural resources as economic assets than are rich countries. Second, natural resources are a major – if not the major – asset of the poor. Third, the international context of natural resource management is changing. Many emerging economies are major importers of natural resources. This increased demand for natural resources makes improved resource management even more urgent.
Policy makers in OECD and developing countries as well as development co-operation agencies can play an important role in promoting political change to support natural resource management for pro-poor growth. First, development co-operation can facilitate improved natural resource management, for example, by funding projects to build the capacity of community-based co-operatives or organisations to manage natural resources. It can encourage clarification of land tenure and resource rights of the local poor including customary tenure and resource management rights. It can promote the use of tools such as participatory rural appraisal, strategic environmental assessment and poverty and social impact assessment to enhance long-term thinking and pro-poor strategic planning of natural resource use. Second, policy coherence for development should be enhanced. This implies making sure that the policies of industrialised countries in areas other than development co-operation give support to, or at least do not undermine, efforts by developing countries to attain internationally agreed development goals. Policies of emerging economies have to be aligned with these goals as well. Third, existing and potential future multilateral environmental agreements must be negotiated in a manner that is particularly sensitive to the needs of the poor. This requires political support for improved and secured access of the poor to natural resources in the context of negotiations of multilateral environmental agreements.
Checklist for practitioners
Introduction to Part II: Key natural resources for pro-poor growth
This section examines seven natural resource sectors which have a critical role to play in sustaining pro-poor growth: fisheries; forests; wildlife and nature-based tourism; soil productivity; water security; minerals; and renewable energy. These have been selected as key resources which, with improved management, can contribute to the growth process and in particular sustainable pro-poor growth. To support the analysis, a number of case studies have been prepared and are available on the Internet (www.povertyenvironment.net/ pep).
Fisheries
Fisheries are an important source of wealth for many coastal and island developing countries. With about 95% of the world’s 35 million fishermen living in developing countries, fisheries provide a critical source of food for millions. Internationally traded values in fish products from developing countries far exceed all other export commodities, and some countries generate up to 30% of their fiscal revenues through fisheries.
Fish stocks in many coastal areas of the developing world are severely threatened by overfishing. Institutional weaknesses, lack of capacity for effective policy implementation, as well as the migratory and open access character of fish resources underlie overexploitation. To reconcile the joint objectives of growth, poverty reduction and the safeguarding of the fishery resource, effective resource management is needed. Several political and management challenges in the fisheries industry, including illegal and unreported fishing, have to be addressed. Additionally, difficult choices on potential trade-offs between large-scale industrialised fishing and local small-scale fishermen have to be made, and more public revenues from fisheries have to be generated. Notwithstanding these challenges, with improved management fisheries can contribute increasingly to pro-poor growth, as several countries have shown.
Forestry
The forest industry is a major source of growth and employment. In many countries, the sector contributes more than 10% to GDP and provides formal and informal employment in developing countries for an estimated 40 to 60 million people. Developing countries also rely on timber for export earnings. Over 90% of the people living in extreme poverty depend on forests for some part of their livelihoods. But global forest cover has been reduced by at least 20% since pre-agricultural times. While forest area has increased slightly since 1980 in industrial countries, it has declined by almost 10% in developing countries.
Wildlife and nature-based tourism
Wildlife plays an important safety net role for many poor people. It provides food, fibre and medicines – but it can also be a source of wealth creation. An estimated 150 million poor people (one-eighth of the world’s poorest) perceive wildlife to be an important livelihood asset.
Nature-based tourism holds high potential for wildlife-based economic growth. It is one of the fastest growing segments of the global tourism industry, and one of the few export/service sectors in which poor countries have (or can develop) a clear comparative advantage as a result of their often rich natural resource base. Trophy-hunting can be a particularly lucrative sector of this industry for some states, generating significant public revenues in countries such as Tanzania.
Wildlife trade also deserves far greater attention – generating an estimated USD 15 billion per annum worldwide, excluding large-scale commercial trade in fish and timber. But overexploitation of species and illegal wildlife trade can be very economically and ecologically damaging. Better management, regulation and controls are needed to realise the potential of wildlife trade for pro-poor growth.
Soil productivity
Soil productivity is essential to agricultural growth, food security and support of the livelihoods of the poor. Agriculture is the major engine of economic growth in most developing countries, and growth in agriculture is particularly effective in reducing poverty. Low-income countries have the highest share of agriculture in GDP (typically, around 30%), as compared to less than 4% in high-income countries. Furthermore, a 1% increase in agricultural GDP leads to a 1.6% increase in the per capita income of the poorest fifth of the population. Additionally, the agricultural sector has to meet the food needs of an additional 1.7 billion people over the next 20 years. But pro-poor growth and food production are at risk from severe soil degradation.
Soil degradation has reduced agricultural productivity by 1% to 9% in Africa. More than 16% of the cropland and drylands in low-income countries have been degraded moderately or severely, primarily through soil erosion, nutrient depletion and salinisation. Soil degradation ranks among today’s greatest environmental challenges. Considering the enormous cost of soil degradation, investment in improving soil fertility is remarkably low for a variety of reasons related to tenure, access to credit and markets, and fiscal and trade policies. Given the growing pressure on land in the developing world, the economic value of soil conservation is likely to increase.
Water security
capacity, institutions and infrastructure to manage and mitigate these potentially major challenges are generally inadequate.
There is a re-emerging consensus that water resources development and management are essential not only for human well-being but also to generate wealth, mitigate risk, and alleviate poverty. Many developing countries will need to make large investments in water infrastructure at all levels. Furthermore, greater attention must be paid to institutional development, to the environment and to a more equitable sharing of benefits and costs.
Minerals
The mineral industry extracts non-renewable resources. To create and sustain wealth in the long term, mineral resources have to be converted into other forms of capital (human, social, financial and manufactured) and more sustainable livelihood opportunities.
Mining is an important source of growth, government revenues and foreign investment in many developing countries. The sector employs an estimated 22 to 25 million people worldwide, most of whom are abjectly poor. It includes those working in the artisanal (self-employed, independent and/or subsistence) and small-scale mining operations in developing countries. Furthermore, the economic importance of the sector is increasing. Between 2000 and 2005 the value of world trade in minerals grew by 17% annually. Mineral prices are volatile and have risen significantly in the past five years, driven in part by high demand and growth rates in China and India.
But mineral wealth does not automatically lead to economic prosperity and poverty reduction. Some resource-rich countries are among the poorest of the world and have high levels of corruption and conflict. The challenge is to recognise the potential for the “resource curse” and work effectively to counter it. Good governance, strong institutions, effective regulation and rigorous environmental and social safeguards are needed to realise the potential of mineral wealth for pro-poor growth. Both OECD and developing countries have shown how well-governed mineral wealth exploitation can power development.
Renewable energy
Overview of Key Issues
Natural Resources and Pro-Poor Growth: The Economics and Politics © OECD 2008
PART
I
Chapter 1
Introduction
“There is one final factor which will obviously be a major influence on Africa’s
future economic growth. It is the environment.”
Commission for Africa, 2005
“The 21st century will be marked by a crucial debate: how can we make
economic and social development compatible with the preservation of the
natural environment?”
Luiz Lula de Silva, President of Brazil1
“We recognise that the environment is not an obstacle to economic growth, but
offers opportunities for sustainable growth.”
Ministerial Declaration of the Fifth Ministerial Conference on Environment and Development in Asia and the Pacific, 2005
“Environmental wealth – natural resources – is one of the main sources of
growth in developing countries, and central to the livelihoods of poor people.”
G
enerating pro-poor growth is key to achieving the Millennium Development Goals (MDGs). While it is true that the proportion of the world’s poor living in towns and cities is gradually rising, three-quarters of all poor people still live in rural areas. The modest pace of urbanisation and current forecasts for urban population growth imply that most of the world’s poor will still live in rural areas for many decades to come (Ravallion et al., 2007).Poor people’s livelihoods will remain heavily reliant on natural resources. Soil, water, forests and fisheries underpin commercial and subsistence activities and often provide a safety net for the poor in times of crisis. Strategies for rural poverty reduction, including pro-poor natural resource management, should remain at the centre stage for poverty reduction.
This publication provides an overview of how natural resources can generate and sustain pro-poor growth. It also examines how effective policies and investments for natural resources can support the achievement of the MDGs. The objective is to highlight the need to improve natural resource management for long-term pro-poor economic growth.
Natural resource management and poverty reduction are complex issues and there are many interdependencies. This report focuses on the economic dimensions – i.e.benefits of natural resources in terms of production, incomes, employment creation, export revenues and fiscal resources. The many non-market environmental benefits provided by natural ecosystems, their intrinsic and aesthetic value and the threats to human development posed by pollution and other forms of degradation are not addressed specifically here. Recent publications, such as the Millennium Ecosystem Assessment (2005) and “World Resources 2005 – The Wealth of the Poor: Managing Ecosystems to Fight Poverty”3 address these critical issues in comprehensive detail.
Similarly, issues related to climate change are not addressed here. This is not to underplay their importance. Climate change is a serious and long-term challenge to social and economic development with the potential to affect every part of the globe, and developing countries in particular. Studies on the economic damage from climate change show that developing countries are expected to experience larger percentage losses of GDP than developed countries (IPCC, 2007). It should not be considered just as an environmental issue but also as a development issue. Readers are invited to refer to the growing literature on the economic impacts and costs of climate change for a detailed coverage of these issues (see also Box 1.1).
The focus on economic dimensions of natural resource management is intended to encourage economic decision makers from development agencies and ministries of finance and planning in partner countries to recognise the contribution of natural resources to pro-poor growth and the importance of policies encouraging the sustainable management of these resources.
identifies the roles and influence of different stakeholders and their incentives and disincentives for sustainable natural resource use. It points to the need for innovative coalitions to drive change and promote sustainable management. Past approaches focusing on more technocratic interventions and capacity building have often overlooked these political challenges. Additionally, ways to increase policy coherence for development in natural resource management are outlined. Therefore, the publication also signals to policy makers in OECD and partner countries as well as to development co-operation agencies the need to address the political challenges of natural resource management for long-term pro-poor economic growth.
Subsequently, seven natural resources are examined which have a critical role to play in sustaining pro-poor growth: fisheries; forests; oil and minerals; nature-based tourism; soils; water; and renewable energy. These have been selected as key resources whose improved management can contribute to the growth process. To support the analysis in this paper, a number of case studies have been prepared and are available on the web (www.povertyenvironment.net/pep).
Notes
1. “Join Brazil in planting oil”, comment, The Guardian, 7 March 2006.
2. Speech at New Economics Foundation, 19 January 2006, www.dfid.gov.uk/news/files/Speeches/ wp2006-speeches/growth190106.asp.
3. This publication is the result of collaboration between UNDP, UNEP, the World Bank and the World Resources Institute.
Box 1.1. Climate change: The expected impacts on developing countries
Natural Resources and Pro-Poor Growth: The Economics and Politics © OECD 2008
PART
I
Chapter 2
Some Unique Features
of Natural Resources
*
This chapter provides an overview of the various forms and functions of natural resources. It highlights why the unique features of natural resources pose special challenges to their effective management.
* This chapter draws on material from Ahrend (2006).
2.1. The varied forms and functions of natural capital
While natural capital assets are not created by human activity, their quality and capacity to yield goods and services – and therefore their value as productive inputs – are affected by it. In many cases, for example agricultural land, the relevant input into production can best be viewed as a combination of natural elements (soil and water) and man-made components (irrigation and transport infrastructure). It is, however, still useful to maintain the conceptual difference between natural and man-made capital.
Natural capital can be either renewable (such as land, water resources and forest) or non-renewable, including, for example, fossil fuel and mineral deposits. Natural capital is renewable if the resource can restock itself by natural processes. If the rate of extraction respects the limitations of reproductive capacity, renewable natural capital can provide yields over an infinite period of time. Non-renewable capital cannot regenerate at a rate that is comparable to the rate of extraction. Therefore the extraction of non-renewable resources is necessarily finite.
Renewable capital produces a flow of both goods and services. The two are often compatible. Goods produced from renewable natural capital include timber and non-timber forest products, catches of wild fish, etc. Goods produced from non-renewable natural resources are mainly oil and minerals.
Some of these goods are traded in formal markets and therefore accounted for in national economic statistics. They include, for example, timber and fish harvested by formal-sector operators as well as fossil fuels (oil, gas and coal) and important minerals. But many are consumed locally and do not enter formal markets. They include wild fruits, mushrooms or herbs, wild fish caught by small-scale fishermen, “bush meat”, palm, timber and non-timber forest products, among others.
Services produced from natural capital include, for example, water filtration and purification services provided by wetlands, regulation of water cycles provided by watersheds, etc. These services are generally not marketed and are invisible in standard economic statistics.
2.2. Measuring and monitoring natural resource stocks
Sustainable management of resources rests on a capacity to monitor the evolution of stocks and take corrective action in cases of significant degradation or decline.
In the case of non-renewable resources, such as minerals or fossil fuels, stock depletion is inevitable in the long run. In the formal sector, the value of the remaining stock (i.e.mineral or oil reserves) is estimated as accurately as possible and is an important factor conditioning the market value of the firm relying on a particular resource stock. An appropriately designed fiscal regime can make sure that stock depletion is recorded and thus made visible both at the level of the firm and at the aggregate level.
This does not apply in the case of informal-sector exploitation of “open access” resources. Where artisanal mining is significant or even predominant, for example, it is difficult to monitor the value created by the industry and the rate at which existing deposits are depleted, and to formulate corresponding policies. These issues are discussed in greater detail in Chapter 11.
Renewable natural resources can, in principle, be maintained in perpetuity so long as their rates of use do not exceed their rates of regeneration. However, a continued draw-down of the stock above a certain level may be unsustainable and lead to permanent reduction of the stock and to lower reproductive capacity. There is, however, no market mechanism to make this reduction in capital stock visible to users or policy makers.
Standard economic statistics can even provide a misleading picture of the performance of a natural resource-based sector. In the case of fisheries, for example, a high level of “gross value added” is consistent with poor economic performance if there is excess fishing capacity. In such a case, removing capacity from the sector will result in increased overall production.
Similarly, ecosystems may be degraded to the point where they are no longer able to provide a range of services. Because these services are not bought and sold in markets, this development is not directly visible through market mechanisms but may lead indirectly to increasing costs or decreasing outputs in related or dependent sectors. Specific mechanisms are needed to monitor both the level of stocks and their quality in terms of capacity to deliver both goods and services.
2.3. The natural resources “curse”
It is often suggested that natural resources are a curse rather than a benefit as a result of several unique factors:
● The finite nature of the non-renewable resources, which leaves producers vulnerable once stocks are depleted (i.e.natural resources are “dead end” sectors).
● The low growth potential of natural resource sectors, arising from the fact that they are “low tech” activities which do not stimulate productivity increases and a shift towards higher value-added products.
● Vulnerability to “boom and bust” cycles as a result of the volatility of commodity prices on international markets, which leaves exporters particularly vulnerable to external shocks (this applies to mineral resources, some renewable resources and a wide range of agricultural commodities).
● Vulnerability to the so-called “Dutch disease”.
2.3.1. Natural resources are a “dead end”
This argument must be qualified. While non-renewable natural resources are ultimately finite, this issue becomes relevant during the decades immediately prior to their total depletion. What is important is the quantity of known natural resource deposits that can be exploited profitably at current technology levels and expected long-term average prices. Moreover, technological progress in resource extraction often means that more can be extracted from existing reserves and new reserves become worth exploiting.
2.3.2. Natural resources are “low-tech”
This argument must also be qualified. Some natural resources require very high technology techniques (e.g.offshore oil) and/or call for increasingly advanced technologies as stocks become depleted. To the degree that one of the main economic explanations for a resource curse rests on the “low-tech” character of resource extraction, it is therefore doubtful whether there really is an inevitable economic resource curse. On the other hand, the “high-tech” or capital-intensive nature of extraction can itself lead to another problem, namely “enclave” types of economies around a particular deposit with few or no links with the local or national economy.
Poor economic performance in many natural resource-rich economies may have been caused not by resource abundance as such but by the weak institutions for resource management, structures of ownership and control, notably owned or state-controlled monopolies.
2.3.3. Vulnerability to “boom and bust” cycles
Compared to economies with diversified economic structures, resource-based economies are particularly exposed to large terms of trade shocks caused by sharp falls in the prices of their main export commodities. Good macroeconomic management and fiscal discipline cannot eliminate these risks but can significantly mitigate them. Conversely, fiscal irresponsibility, in any case, will tend to magnify, rather than smooth out, the effects of commodity price movements, contributing to “boom and bust” cycles.
2.3.4. Vulnerability to Dutch disease
The term “Dutch disease” is used to describe a situation in which a country suddenly discovers large quantities of natural resources and starts exporting them. However, Dutch disease can also become a pressing problem for a country if the weight of an existing resource sector in exports increases relatively fast. In either case, the increased resource wealth tends to raise the exchange rate and/or general wage levels, thereby putting pressure on the competitiveness of the other tradeable sectors in the economy.
Having a higher exchange rate is not all bad news, as it increases the purchasing power of the population (as imported goods become cheaper) and therefore raises living standards. The ensuing stronger consumption usually also boosts production in the non-tradeable sector. The drawback, however, is that the competitiveness of the non-resource based tradeable sectors comes under threat. To be able to continue exporting, or at least to withstand import competition, these sectors must therefore increase productivity sufficiently fast to keep their international competitiveness.
tradeable sectors may ultimately affect employment levels. The resource sector usually provides relatively little employment itself. Therefore, if resource-based currency strength leads to a more capital- and less labour-intensive production pattern in other industrial sectors, it risks contributing to reductions in industrial employment.
Natural Resources and Pro-Poor Growth: The Economics and Politics © OECD 2008
PART
I
Chapter 3
The Economics of Sustainable Natural
Resource Management
3.1. Overview
There is a consensus that, over the long term, economic growth is an essential requirement and, frequently, the main contributing factor in reducing income poverty. Evidence across countries and time periods shows that long-term reduction in income poverty results first and foremost from growth. At the same time, developing countries with similar rates of economic growth have experienced quite different levels of economic poverty reduction, due to initial conditions (particularly levels of inequality in incomes and assets) and whether growth occurs in areas and sectors where the poor live and are economically active. The pattern and pace of growth are thus interlinked and need to be addressed together in order to have a substantial and sustained impact on poverty reduction (Box 3.1) (OECD, 2007).
To improve the impact of growth on poverty reduction, the flow of output (or income) from the assets of the poor has to increase and the poor have to increase their asset base, or gain from shifting between assets. Growth that is accompanied by degradation or conversion of natural capital on which the poor depend for their livelihoods (for example, the conversion of open access natural forests into privately-held plantations) may even aggravate poverty.
This chapter provides an overview of how natural resources contribute to sustained pro-poor growth. It focuses on the benefits of sound natural resource management in terms of production, employment creation, export revenues and fiscal resources. It also points to policies and investments which can support pro-poor natural resource management.
Box 3.1. Pro-poor growth
Pro-poor growth focuses attention on the extent to which poor women and men are able to participate in, contribute to and benefit from growth. This is measured by changes in the incomes of the households in which they live and the assets they and their children acquire to earn higher incomes in the future.
But when may growth be termed “pro-poor”? There are different views on this issue:
For some, what matters is whether the incomes of the poor are rising relative to the incomes of the non-poor and hence inequality is falling. The merit of this perspective is that it focuses attention on whether the poor are benefiting more or less proportionately from growth and whether inequality, a key determinant of the extent to which future growth reduces poverty, is increasing or falling.
For others, what matters most is the absolute rate at which the incomes of the poor are rising. For example, are they rising fast enough to reduce the number of people living below the international poverty line in accordance with MDG-1?
3.2. Natural capital contributes directly to incomes, employment and fiscal
revenues
Natural resources underpin economic activities in many ways. Extractive resources, such as minerals, timber or fisheries, account for a large share of economic output in many countries. Soil and water resources are also fundamental to agricultural activities, a key part of the economy in many developing countries. Natural resources also act as an environmental host for goods, such as wild fruits, mushrooms, herbs, wild fish caught by small-scale fishermen, “bush meat”, palm, timber and non-timber forest products which contribute to the subsistence of many people.
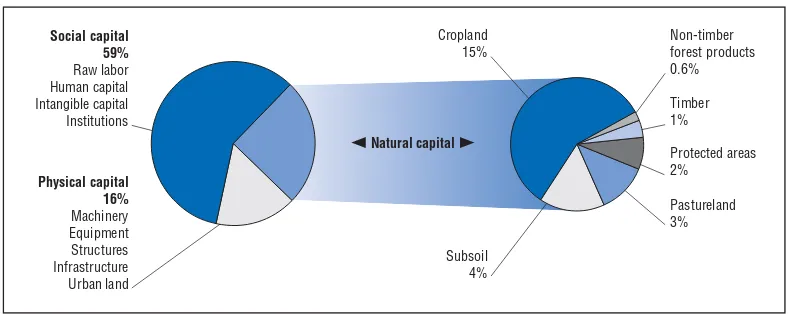
Natural capital is particularly important in developing countries. It is estimated to account for 26% of the total wealth in low-income countries (Figure 3.1), 13% of wealth in middle-income countries and only 2% of wealth in industrialised or OECD countries (World Bank, 2006b). Moreover, primary production represents a much higher share of production, exports and national income in developing countries compared with its share in industrialised countries. Natural resource-based enterprises thus provide important employment and income opportunities.
Forestry provides more than 10% of the GDP in many of the poorest countries. In all developing countries taken together, the forestry sector provides formal employment for 10 million people and informal employment for another 30 to 50 million people (Dubois, n.d.; ILO, n.d). In several developing countries, forests provided annual export revenues of over USD 100 million and more than 10% to 20% of export earnings (Lebedys, 2004). A quarter of the world’s poor and over 90% of the people living in extreme poverty depend on forests for some part of their livelihoods.
Fisheries account for between 10% and 30% of government budgets in several West African countries. Between 1993 and 1999 fishery access agreements provided 30% of the government revenue in Guinea Bissau, 15% in Mauritania, and 13% in Sao Tome. At the local level, in some areas fishery taxes provide a significant source of local revenue. Seafood exports from Africa into the European Union are worth over USD 1.75 billion and constitute the largest agricultural export product. For African least developed countries (LDCs), the seafood
Figure 3.1. Composition of total wealth in low-income countries
trade was worth USD 570 million and, again, was the largest agricultural export product (FAO, 2007b; OECD, 2005).
Wildlife and nature-based tourism contributes significantly to the life of many poor people. An estimated 150 million people (one-eighth of the world’s poorest) perceive wildlife to be an important livelihood asset. Nature-based tourism has high potential for pro-poor growth, being one of the fastest growing segments of the global tourist industry. Trophy-hunting generates significant incomes and public revenues in countries of eastern and southern Africa.
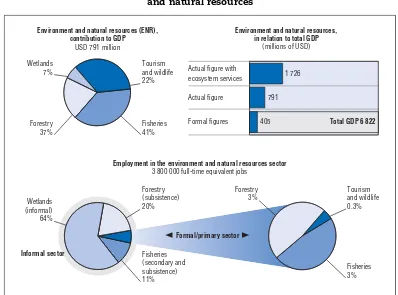
Figure 3.2 outlines the importance of natural resources in Uganda.
3.3. Natural resources underpin the livelihoods of many among the poorest
The poor are often highly dependent for their livelihoods on “common property” natural resources, which include fallow fields, forests, fishing grounds, pastureland and wetlands. These are a source of a variety of goods including food, fodder, building materials, fuel and medicinal plants among others, which are important sources of sustenance or income for many landless poor. In India, it has been estimated that common property resources provide poor households with about 12% of their income. In general the poorer the household, the more important is the income contribution through commonFigure 3.2. Uganda: Quantifying the importance of environment and natural resources
Note: It is estimated that the environment and natural resources sector should contribute USD 791 million to Uganda’s GDP, excluding benefits such as ecosystem services. In the formal figures, where subsistence use and informal markets are not captured, only USD 405 million are recorded. Over 90% of the employment in the sector is secondary processing and subsistence use. Sustainable natural resource use implies that this sector will continue to provide vital non-agricultural rural employment for the poor. Conversely, unsustainable use will eliminate jobs from this sector.
Employment in the environment and natural resources sector
3 800 000 full-time equivalent jobs
property resources. As a result, common property natural resources contribute to rural equity (Beck and Nesmith, 2001).
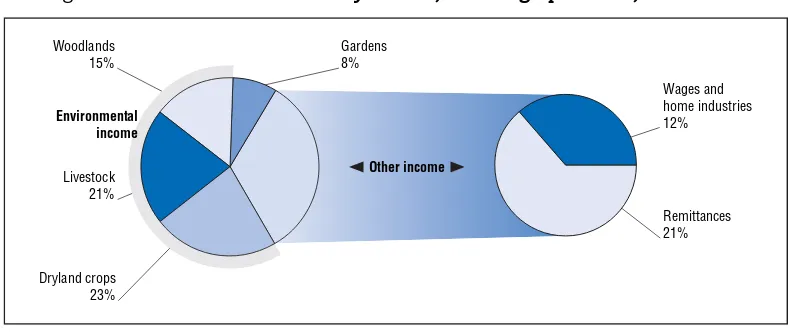
Some of the goods provided by natural resources are traded in formal markets and accounted for in national economic statistics. They include, for example, timber and fish harvested by formal-sector operators. But many are consumed directly by local inhabitants or are traded informally and/or illegally to avoid taxes and other regulations. As a result, they do not figure in official statistics. Figure 3.3 shows this in the case of Zimbabwe.
The forestry sector provides an example of the large share of informal activities and values which are not recorded in national accounts (Box 3.2).
Figure 3.3. Household income by source, Masvingo province, Zimbabwe
Source: WRI (2005).
Box 3.2. Some examples of accounting for informal forestry activities in national income accounts
In recent years, a number of countries have attempted to measure informal or non-monetary activities in their national income accounts. The following text presents some information from official reports, followed by comments on these figures (shown in italics) by Lebedys (2004). As the text shows, there is considerable variation in the way that informal forestry sector activities are handled in national income accounts.
Uganda: According to the government of Uganda, official statistics indicate that the forestry sector accounts for about 1.5% of GDP. For example, in 1999, the Ugandan Bureau of Statistics estimated that value added in forestry amounted to UGX 126 billion (Ugandan shillings), with UGX 64 billion generated in the formal sector and the remaining UGX 62 billion in the informal sector. In total, the sector accounted for about 1.5% of GDP.
A more recent review of the economic importance of the forestry sector in Uganda was produced as an unofficial report by the forestry administration. This estimated that more than 70% of wood consumption in Uganda is in the informal sector, which alone is valued at about 2.75% of GDP. Including the informal sector and a modest estimate of the value of environmental services provided by forests, the forestry sector accounts for about 6% of GDP. Major contributors to this are: domestic fuel wood – UGX 120 billion; charcoal production – UGX 70 billion; non-wood forest products – UGX 66 billion; commercial fuel wood – UGX 43 billion; and sawn timber – UGX 40 billion.
3.4. Natural resources provide a safety net in times of crisis
Natural resources provide vital supplementary income or food in times of crisis such as drought, in periods when employment opportunities are scarce, or when food stocks are low before the harvest. A study of the Mt. Elgon National Park in Uganda shows that environmental resources have played a safety net function during periods of natural and social disaster. Environmental income constitutes 19% of total revenue for peasants living near the park and poor households depend more on environmental incomes than wealthier households (OECD, 2006c).
Box 3.2. Some examples of accounting for informal forestry activities in national income accounts (cont.)
Current estimates of fuel wood production in Uganda are 33 million cubic metres (m3) of fuel wood plus 0.7 million MT (metric tonnes) of charcoal (FAO, 2003). The exchange rate (in 2000) was UGX 1 512 to USD 1.00. Based on this information, the unofficial figures above would suggest that value added in fuel wood production is about USD 3.30 per m3 (i.e.UGX 163 billion/33 million CUM = UGX 4 939 per m3, or USD 3.30 per m3). The value added per MT of charcoal production would amount to USD 66 per MT (i.e.UGX 70 billion/0.7 million MT = UGX 100 000 per MT or USD 66 per MT). These figures appear quite plausible, suggesting that the unofficial report may give a better indication of the importance of the sector than the official statistics in the national income accounts.
Tanzania: In 2000, the official statistics for value added in forestry and hunting show a total of TZS 209 billion (Tanzanian shillings), with TZS 76 billion in the formal (monetary) sector and TZS 133 billion in the informal (non-monetary) sector. Together, these two sectors accounted for 3.1% of GDP (Bank of Tanzania).
The current estimate of fuel wood production in Tanzania is 21 million m3 (FAO, 2003), the exchange rate in 2000 was TZS 800 per USD 1.00 and average fuel wood prices are about TZS 3 000 per m3. These figures would suggest that the gross value of fuel wood production in 2000 was TZS 63 billion (i.e.21 million m3 x TZS 3 000 per m3). Alternatively, taking the value-added figure for Uganda (USD 3.30 per m3), value added in fuel wood production in Tanzania might amount to about TZS 55 billion (i.e.USD 3.30 per m3 x TZS 800 per USD x 21 million m3). Considering that fuel wood production might only account for about half of informal forestry activities and that hunting is also included in the official figures presented above, it appears that the official figures may be quite reasonable estimates.
Philippines: The official estimate of gross value added in forestry and logging activities in 2000 is PHP 3.4 billion (Philippine pesos), amounting to 0.1% of GDP.
Based on an exchange rate of PHP 44 per USD 1.00 in 2000, the figure above is equal to USD 77 million or USD 25 per m3 of industrial roundwood production or USD 2 00 per m3 of total roundwood production (FAO, 2003). However, according to REAP (2002), average fuel wood prices in the Philippines in 2000 were PHP 1.5 to PHP 2.2 per kg (equal to about USD 24 to USD 36 per m3). Assuming that gross value added in fuel wood production is fairly close to the gross value of output (i.e.USD 24 to USD 36 per m3) the gross value added from fuel wood production in the Philippines would be close to USD 1.2 billion (i.e.USD 30 per m3 x 40 million m3) or an additional 1.5% of the country’s GDP. Even if a significant allowance were made for transport costs, this would suggest that the value added in the informal fuel wood production sector is substantially higher than the official estimate of value added in the sector.
3.5. Natural resources generate a wide range of positive externalities
at the national and global levels
Local or national-level natural services include, for example, the soil stability provided by
upstream vegetation in a watershed, which contributes to the good functioning of downstream water supply, irrigation or hydro-electric facilities. Other examples include the pollination services provided by bees and other insects and recreation services provided by natural parks or reserves which underpin the nature-based tourism industry. Whether or not they are marketed and counted in GDP statistics, these services contribute to production, consumption and welfare. In some cases, they play a critical role in sustaining economic growth. Africa’s dependence on hydro-electricity, which in turns depends on reliable water supplies, illustrates this (Box 3.3).
Global level externalities include, in particular, genetic information for biotechnology from
biodiversity and the sequestration of CO2 by forests, which helps contain climate change. These are two clear examples which benefit all countries but not necessarily the nation hosting the forest. Extensive literature exists on the economic impact and costs of climate change and adaptation and the topic is therefore not covered here (but see Box 1.1 above on the negative impacts of climate change).
Natural resource extraction can also generate negative externalities. The degradation of natural
services undermines human welfare and often necessitates costly remedial actions. Many extractive activities, such as mining or commercial-scale logging, generate a host of negative externalities which must be mitigated. The impact of these external costs, in the form of harmful water and air pollution and of soil erosion, often falls disproportionately on the poorest.
3.6. Sustainable natural resource management raises unique challenges
3.6.1. Minimising the impact of “boom and bust” cycles1As noted in Chapter 2, countries which are heavily reliant on natural resources are vulnerable to “boom and bust” cycles. This problem can be addressed through various policies.
The creation of a stabilisation fund is one important policy response. It typically aims to reduce the impact of volatile revenue on the government and the economy, to save for
Box 3.3. Importance of watersheds for urban electricity in Africa
Urban electricity is crucial for industrial development and growing urbanisation. What is less known is that much of Africa’s urban electricity is heavily dependent on water for hydro-electric power generation. For 26 sub-Saharan countries, hydro-electricity is the main power source, and for a further 13 countries is the second most important power source (Showers, 2002).
future generations, or both. It accumulates windfall government revenues which would ideally be managed by an entity that has no authority to spend the money (that is, an independent special institution or the central bank, but not the government, the ministry of finance, or any other ministry). The rules for when, and which, revenues should be accumulated and when they may be spent should be very strict and transparent. The accumulated revenues should primarily be invested in safe and liquid foreign currency-denominated assets, if domestic financial markets are very thin. But consideration should also be given to investing part of these resources in selected domestic assets, as these resources can support the strengthening and deepening of local financial markets. However, this approach implies that any increase in natural resource price and associated revenues would not contribute to pro-poor growth in the short term, if revenues are saved for the future. Their use is limited to preventing a slowdown or loss of pro-poor growth in later periods when prices are lower.
An alternative policy option is the use of windfall revenues to fund public investments (e.g.in infrastructure) that raise the productivity of private investment, not only in non-traded sectors but also in non-traded sectors. Over time this can reduce the dependency on natural resources and contribute to pro-poor growth often faster than stabilisation funds.
A counter-cyclical fiscal policy with respect to commodity prices is another possible policy response. It requires keeping the budget on a sustainable fiscal path across the commodity price cycle while avoiding fluctuations in pro-poor spending. Moreover, fiscal policy should always be based on conservative price assumptions for the major export commodities. If budgetary commodity price assumptions are above long-term averages, or if revenue assumptions implicitly take above-average prices for granted, then budgets should be drafted to achieve corresponding surpluses. In this respect it must be clear that a budget that balances thanks only to exceptionally high commodity prices is not in balance at all.
Export diversification is another way to minimise the impact of “boom and bust” cycles, but is a rather long-term process. Initiatives such as commodity risk management instruments and specific programmes for fostering the development of new export sectors can help governments to withstand external shocks and sustain their diversification strategies.