31 CHAPTER III
RESEARCH METHOD
In this part, the writer described about research method that use in conducting the research. It was purposed to answer the problem of the study. This chapter consists of research type, research design, population and sample, research instruments (research instrument, research instruments try out, research instruments reliability and research instruments validity), data collection, data analysis, and the result of instrument try out.
A. Time and Place of the study
The study was conducted at SMK N 1 Palangka Raya which is located on Tambun Bungai Street. The writer started the research from May 2015 until the complete data from English teacher and students at SMK N 1 Palangka Raya. B. Research Type
In this study, writer used the quantitative approach. It was because the writer would measure the students’ vocabulary mastery by tests. According to
Alliaga and Gunderson “Quantitative research is explaining phenomena by collecting numerical data that are analyzed using mathematically based methods (in particular statistics).38 In this study, writer has purpose to and measure the different significant on learning style (visual, auditory, and kinesthetic) towards vocabulary mastery of tenth grade students of SMK N 1 Palangka Raya.
38
C. Research Design
The design of this study was non-experimental design because the writer want to measure the different significant on learning style in the teaching learning English vocabulary process. This study, writer used ex post facto research. The designation ex post facto research was conducted after variation in the variable of interest has already been determined in the natural events.39 This design was sometimes called casual comparative because its purpose is to investigate cause-and-effect relationships between independent and dependent variable.
D. Population and Sample
1. Population
The larger group about which the generalization is made called a
population. A population is defined as all members of any well-defined class of people, events, or objects.40
In this research, the writer took the students from the SMK N 1 PALANGKA RAYA for this research. Become population is tenth grade students of SMK N 1 Palangka Raya. The number of population is about 398 students. It is classified into 14 classes.
Table 3.1
The Population Number of Tenth Grade Students at SMK N 1 Palangka Raya
Class Program Number of Students
Male Female Total
X Teknik Survei & Pemetaan 29 4 33
39
Donald Ary, Lucy Cheser J, Chris S, Asgar R, Introduction Research in Edcation Eight Edition, Canada: Aaron Downey, Matrix Production, Inc. 2010. P.332
40
X Teknik Gambar Bangunan 20 8 28
X Teknik Konst. Batu & Beton 24 0 24
X Teknik Furniture 10 0 10
X Teknik Video 29 0 29
X Teknik Inst. Tenaga Listrik 35 0 35
X Teknik Pengalasan 28 0 28
X Teknik Pemesinan 20 0 20
X Teknik Alat Berat 24 0 24
X Teknik Kendaraan Ringan 38 0 38
X Teknik Sepeda Motor 38 0 38
X Teknik Energi Terbarukan 24 2 26
X Teknik Rekayasa Per. Lunak 1 27 7 33
X Teknik Rekayasa Per. Lunak 2 27 4 31
TOTAL 373 25 398
2. Sample
The small group that is observed is called a sample. A sample is a portion of a population.41Sample is a part of population that has the same characteristics as the population itself.
Students’ in the tenth grade at the second semester in SMK N 1 Palangka
Raya as a sample to get the data for this research. In this research, to take the sample, the researcher took two classes to be the sample. It classes were experimental group of use vocabulary through their learning styles. In this way, the researcher took two classes for group A and group B as sample which will be related to this study. To take the sample, the writer used proportionate cluster random sampling.
Due the fixed class, the writer could not use simple random sampling to select the sample. According to Ary, it is very difficult, if not impossible to list all
41
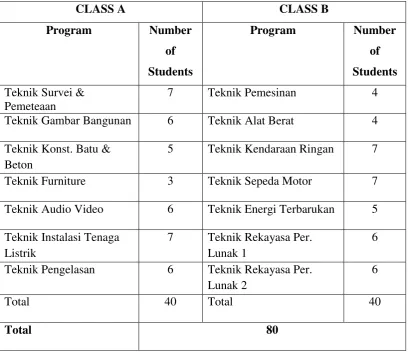
the members of a target population and select the sample from among them.42 Therefore, the writer used proportionate cluster random sampling. Because the population consists of different class and the total of each class was different. The researcher took each subpopulation for this research and representative for the research. This research not only individual but consists two groups as sample. Therefore, the use of proportionate cluster random sampling is because the sample of study represent of the population. The number of sample was 80 students.
Table 3.2
The Sample Number of Population The Tenth Grade Students of SMK N 1 Palangka Raya
CLASS A CLASS B
Program Number
of Students
Program Number
of Students Teknik Survei &
Pemeteaan
7 Teknik Pemesinan 4
Teknik Gambar Bangunan 6 Teknik Alat Berat 4
Teknik Konst. Batu & Beton
5 Teknik Kendaraan Ringan 7
Teknik Furniture 3 Teknik Sepeda Motor 7
Teknik Audio Video 6 Teknik Energi Terbarukan 5
Teknik Instalasi Tenaga Listrik
7 Teknik Rekayasa Per. Lunak 1
6
Teknik Pengelasan 6 Teknik Rekayasa Per.
Lunak 2
6
Total 40 Total 40
Total 80
42
E. Research Instrument
The data was very important for this study. They helped the writer in order to find aims of the study. Instrument was also as a tool for writer to collecting data. They were to measure the different significant on learning styles (visual, auditory, and kinesthetic) towards vocabulary mastery at the tenth grade of SMK N 1 Palangka Raya. The writer used the test and questionnaire as instrument for this research.
Try out was used to measure to the suitable instrument and the students’ ability in mastery English vocabulary. To acquire data needed, questionnaires were distributed to respondent. The people who were expected to give responses is called respondent. The aim of try out is used to validity and reliability the instrument order to discard instrument is unneeded, replace with the new item. The writer gave the test instrument at first try out on May 20th 2015 at
07.30-09.00 o’clock, second try out on May 26th
2015 at 07.30-09.00 o’clock, and the last try out on May 30th 2015 at 07.30-09.00. The writer gave the questionnaire and test 1 were hold on 3hd June at 11.30-13.00 o’clock for the Class A which followed by 40 students. The writer gave the questionnaire and test 1 were hold on 2nd June at 08.30-10.00 o’clock for the Class B which followed by 40 students. The writer gave the test 2 for class A is hold on June 8th 2015 at 12.00-13.30
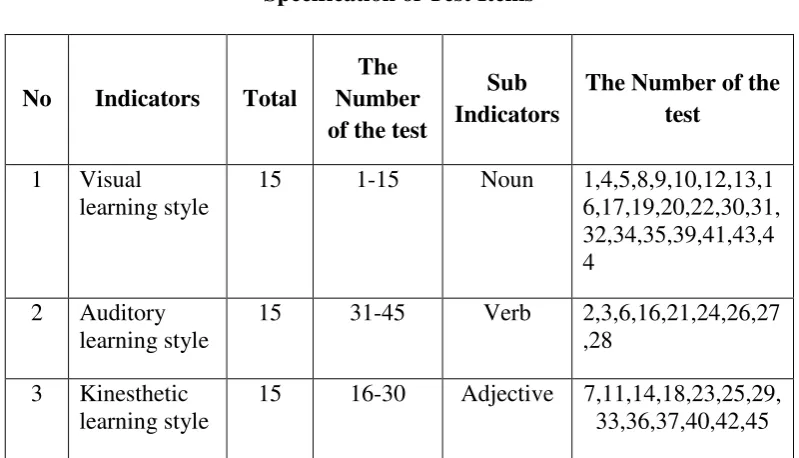
A test was an instrument or procedure design to acquire performance from learners with the purpose of measuring their attainment specified criteria. Tests can be useful devices among other procedures and tasks designed to assess students.43
Table 3.3
Specification of Test Items
No Indicators Total
The Number of the test
Sub Indicators
The Number of the test
1 Visual
learning style
15 1-15 Noun 1,4,5,8,9,10,12,13,1 6,17,19,20,22,30,31, 32,34,35,39,41,43,4 4
2 Auditory learning style
15 31-45 Verb 2,3,6,16,21,24,26,27 ,28
3 Kinesthetic learning style
15 16-30 Adjective 7,11,14,18,23,25,29, 33,36,37,40,42,45
F. Data Collection Procedure
The writer needed data to support this study and to get the data of students’ vocabulary mastery, the respondents of the study get one test. It was vocabulary test in multiple choice orders to know their acquisition level in each skill.
In the study, the writer used some procedures to collect the data. The procedures would describe as follows:
a. Observation
Observation can be defined as viewing and making a note systematically the phenomenon that is investigated. It also can be done indirectly, like giving questionnaire and test. Researcher has observation at SMK N 1 Palangka Raya as an object places this study.
b. Questionnaire
Questionnaire was list of questions or statement about students’ learning style that is given for them at tenth grade to find the learning styles of students. It was used as secondary data, not as a primer data. Researcher has to doing
questionnaire to know which one students’ learning styles. The writer used the Likert Scale to measure the questionnaire. Likert Scale was used to measure the
attitude, opinion and perception’s someone or group about the social occurrence.44 The writer used the quantum learning book to make the questionnaire item. There were 30 items for questionnaire in this research. The writer gave the questionnaire for the class A and class B to know their learning style.
c. Try Out
Try out was used to know whether or not the instrument to measure the learning styles (visual, auditory, and kinesthetic) towards vocabulary mastery of tenth grade students of SMK N 1 Palangka Raya. The subject of try out was the sample of the class C at SMK N 1 Palangka Raya. The writer has done try out for three times in the class C. The writer gave the instrument try out test item and questionnaire test item 1 of the try out 1 on May 20th, 2015 in class C at SMK N 1
44
Palangka Raya. Then, the instrument try out test item and questionnaire test item of the try out 2 on May 26th, 2015 in class C at SMK N 1 Palangka Raya. The last, the instrument try out test item and questionnaire test item of the try out 3 on May 30th, 2015 in class C at SMK N 1 Palangka Raya. For this research, all of the instrument test has to valid order to could be used for the next research. The writer had some steps that prepared for the instruments were given. They were:
1. Prepared the instruments that used for try out. 2. Gave the test to the students.
3. Collected data the students’ answer sheets. 4. Checked the students’ answer sheets. 5. Gave mark based on key answers. d. Test
In this research, the writer gave a test about vocabulary material which should be done by tenth grade students of SMK N 1 Palangka Raya to measure their vocabulary mastery.
According to Heaton, “Test may be constructed primarily as devices to reinforce learning and to motivate student, or primarily as a means of as seeing the
student’s performance the language”.45
In this study, the main data that used the learning styles (visual, auditory, and kinesthetic) towards vocabulary mastery, which is took through multiple choice items. The test constructs of multiple choices the words forms that consisted of 45 items and has multiple choice (a, b, c, and d). Some of the
45
question was adapted from the book that used at SMK N 1 Palangka Raya, Surfing English. The writer gave the questionnaire and test 1 on June 1st 2015 in class A which was followed by 40 students in 90 minutes. The writer gave the questionnaire and test 1 on June 3hd 2015 in class B which was followed by 40 students in 90 minutes. The writer gave the test 2 on June 8th 2015 in class A which was followed by 40 students in 90 minutes. The last, the writer gave the questionnaire and test 2 on June 9th 2015 in class B which was followed by 40 students in 90 minutes. The writer had some steps that prepared for the instruments were given. They were:
e. Documentation
In this study, documentation was the second instrumentation to find out related documents to the study. Documentation was used by the writer as technique to know condition of teacher, officer, students, and location of the school. The source of this data was case book, and text book of the students or other books in SMK N 1 Palangka Raya.
G. Research Instruments Try Out
In order to prove the tests were suitable to the students who are the sample of this study, the writer would be conducting try out test. Then writer has chosen students in the same school but different class to try out test. The try out test was conducted to class C of the sample of tenth grade students of SMK N 1 Palangka Raya.
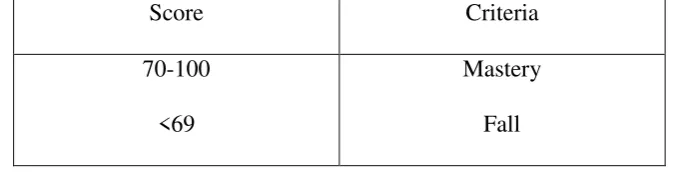
used multiple – choice that consisted of 45 items. If the result was valid, it means that the test items as instrumentation of this study are suitable to be given. In order to find out the description of how well the individual student has mastery the vocabulary, the final scores are related to the following qualification:46
Table 3.4
The Standard of Evaluation
Score Criteria
70-100 <69
Mastery Fall
From the result try out, it was find out the instrument of validity, reliability, and index difficulty.
Try out was used to measure to the suitable instrument and the students’ ability in mastery English vocabulary. To acquire data needed, questionnaires were distributed to respondent. The people who are expected to give responses is called respondent. The data that obtain through this technique was something related with the learning styles towards vocabulary of the tenth grade students of SMK N 1 Palangka Raya. Try out aimed to measure the validity and reliability the instrument order to know the items was unneeded. It was also used as complement
data for knowing the students’ mastery in vocabulary mastery. Before the writer
does the try out, the writer arranges the procedure of the instrument that used to test the students that consisted of:
46
a. The writer would give try out the test item to the students who will be students try out (respondents).
b. The writer would collect the answers and gives score the respondent.
c. The writer would analyze the respondent’s score to find out instrument reliability and index of difficulty.
H. Research Instruments Reliability
A test has to be reliable as a measuring instrument. Reliability is a necessary characteristic of any good test for it to be valid at all. Reliability indicates how consistently a test measure whatever it does measure.47 Reliability is concerned with the effect of such random errors of measurement on the consistency of scores. But some errors involved in measurement are predictable of systematic.48Good instrument in a research is not only the instrument valid, but it also reliable to measure what supposed to be measured. The instrument should be consistent what is measured.
To analyze the reliability of questionnaire and vocabulary test, the writer used the Test-Retest Method. The writer asked a English teacher who teach the class to give the questionnaire order to get the reliable of score.
In analyzing the reliability can be used Test-Retest method. An obvious way to estimate the reliability of a test is to administer it to the same group of individuals on two occasions and correlate the two sets of score. The correlation
47
DonalAry, Lucy Cheser Jacobs, Chris Sorensen, and AsgharRazavieh, Introduction to Research in Education Eight edition, Canada: Aaron Downey, Matrix Production, inc, 2010p. 224.
48
coefficient obtain by this procedure is called a test-retest reliability.49To know the level of test reliability, the writer applied the formula as explain below.
The formula to be use:
Where:
: Reliability of test
X : The First Score of Observation Y : The Second Score of Observation n : The total of students
According to Suharto, the result of the calculation above is connected to the following criteria:
0.800 – 1.000 = very high validity
0.600 - 0.799 = high validity
0.400 – 0.599 = fair validity
0.200 – 0.399 = poor validity
0.0 – 0.199 = very poor validity50
The result of calculation reliability for the questionnaire try out item and try out test
item could be seen in the point of result of instrument try out.
49
Ibid, p. 242. 50
I. Research Instruments Validity
Ary and et State validity is defined as the extent to which scores on a test enable one to make meaningful and appropriate interpretations.51 Validity is the most important consideration in developing and evaluating measuring instruments. Historically, validity was defined as the extent to which an instrument measured what it claimed to measure. The focus of recent views of validity is not on the instruments itself but on the interpretation and meaning of the scores derived from the instrument.52
Every test, whether it is a short, informal classroom test or a public examination, should be a valid a constructor can make it. The test must aim to provide a true measure of a particular skill which it is intended to measure, to the extent that is measure external knowledge and other skills at the same time, and it will not be a valid test. Three types of validation are important in the role as a classroom teacher: content validity, face validity, and construct validity.53
a. Face Validity
Ary et al state face validity is a term sometimes used in connection with a
test’s content. Face validity refers to the extent to which examiners believe the
instrument is measuring what is supposed to measure.54
According to Heaton, a test is called has face validity if the test items look right to order testers, teachers, moderators, and tester.55 The type of the test items
51
Ibid, p. 224
52
Ibid, p. 225
53
H. Douglas Brown, Teaching by Principles an Interactive Approach to Language Pedagogy (Second Edition), p. 388
54
DonalAry, Lucy Cheser Jacobs, Chris Sorensen, and AsgharRazavieh, Introduction to Research in Education Eight edition, p. 228.
55
use in this study can be suitable to the other major same level of vocational school that is of the tenth grade students of SMK students.
The face validity of the test items, they were: 1. The kind of the test was vocabulary test.
2. The kinds of the test items consisted of visual, auditory, and kinesthetic. 3. The form of the test items was multiple choices.
4. Language that was used in English. b. Construct Validity
In this research used the construct validity, Sukardi said that construct validity indicate the test measure the hypothetical construct.56 Before the instrument is tested to real sample, it is necessary to try out the instrument whether it is appropriately constructed or not, the subject of try out is the students of the tenth grade students of SMK N 1 Palangka Raya. This is done to decide whether the items are suitable or not to be applied into the sample of the study would.
The following were the procedures in carrying out the instrument: 1. Prepared the instrument
2. Constructed the subject and telling them that would try out the instrument. 3. Gave the test items to the students.
4. Collected the students work. 5. Scored the students work 6. Analyzed the result of test.
56
c. Content Validity
Content validity demands the appropriateness between the ability to be measured and the test being used to measure.57
Sudjono in Mayasyarah states content validity of a learning result test is the validity that is gained after the analysis, investigation or examination of the content that is contained in the learning result test.58
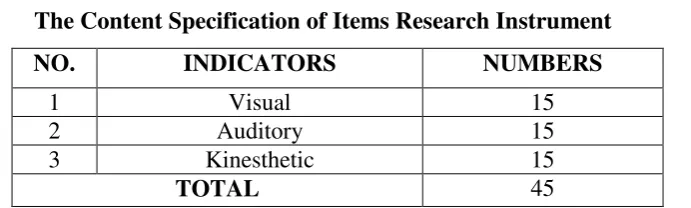
The writer used the content validity to measure the item of instrument that wants to be measured. The item of instrument must be suitable with the variable. The instrument must be valid in its content. It meant that the items in the instrument are equal and proportional in their distribution as the indicators of the test. The test item in this research was to measure the significant different on learning styles towards English vocabulary mastery and based on the English teaching and learning curriculum in SMK N 1 Palangka Raya. In making the test, the writer tried to match of item test with the curriculum that was used by SMK N 1 Palangka Raya.
Tabel 3.5
The Content Specification of Items Research Instrument
NO. INDICATORS NUMBERS
1 Visual 15
2 Auditory 15
3 Kinesthetic 15
TOTAL 45
To measure the validity of the test items, the writer used the formulation of product moment by Pearson as follows:
57
M. Soenardi Djiwandono, Tes Bahasa dalam Pengajaran, p. 92
58
Mayasyarah, The Effectiveness of Video Compact Disc an Audiovisual Medium toward The Student’s Listening Comprehension Score of The Tenth Grade Students at MAN Model of Palangka Raya,
Where:
: Index Correlation Number “r” Product Moment.
: Number of Cases
: Multiplication Result between score X and score Y.
: Total Value of Score X
: Total Value of Score Y
Interpretation:
: Valid
: Invalid
The criteria of interpretation the validity:
0.800 – 1.000 = very high validity
0.600 - 0.799 = high validity
0.400 – 0.599 = fair validity
0.200 – 0.399 = poor validity
0.000 – 0.199 = very poor validity59
J. Data Analysis
Data analysis was the last step in the procedure of this research, in this case, processing the data. Data processing was the first step to know the result of both the significant different of sampling.
To find out the differences significant score on learning style towards
students’ vocabulary mastery. Calculate scores on learning style towards their
59
vocabulary mastery. To analysis the data obtained, the writer used the formula as below:
a. The writer gave test to the tenth grade students of SMK N 1 Palangka Raya. b. The writer collected the data of the students test result.
c. The writer gave the students test result using scoring system. d. The writer gave score for each item using formula.
S =
Where:
S : students’ score
n : number of true answer N : number of test items
e. The writer tabulated the pretest score into distribution of frequency of score table.
f. The writer tabulated the distribution normality and homogeneity pretest the sample by using SPSS program.
g. The writer calculated the hypothesis using t-test with the formula:
Where:
Mx1-MX2 : Differentiation of Two Means
SEmx1-mx2 : The standard Error of the Difference between Two Means. With the criteria:
The writer used the level of significance at 1% and 5%. If the result of ttest is higher than ttable, Ha is accepted but if the result of ttest is lower than ttable, Ho is accepted.
h. The researcher used SPSS 21.0 after using ttest to answer the problem of the study.
i. The writer calculated the degree of freedom with formula: Df = (N1+N2-2)
Where:
Df : Degree of freedom
N1 and N2 : Number of cases
j. The writer determined the level of significant of tobserved by comparing the tobserved with the ttable.
k. The writer made the conclusion of data analysis that will obtain. l. In addition, the writer used SPSS program to compare the data. m. The writer discussed and concluded the result of data analysis
K. Analyze of Instrument Try Out
1. Validity test of the instrument
The writer used the content validity to measure the item of instrument that wants to be measured. A valid instrument must have high validity, it means that instrument which lacks validity is said to be invalid instrument. To measure the validity of the test items, the writer will use the formulation of product moment by Pearson. The value of the test validity has the criteria to use be research instrument. The writer has done three times for try out. The item which is used has to balance. So, all of item has to valid order to use for instrument test. The result of validity test of instrument test in the following table:
a. The Result of Questionnaire Try Out Table 3.6
The Result of Questionnaire Items on the Try Out Test 1
No Criteria
Inter
pretation The Number Item Total
1.
Valid Fair 1 4 7 11 12 13 14 15 16 17
23 18 20 21 22 23 24 25 27 28 29
30
High 8
Poor 2
2 Invalid
Poor 9
7 Very
Poor 3 5 6 10 19 26
Based on the table above, it could be concluded that there were 7 items invalid and 23 items valid of the questionnaire try out 1.
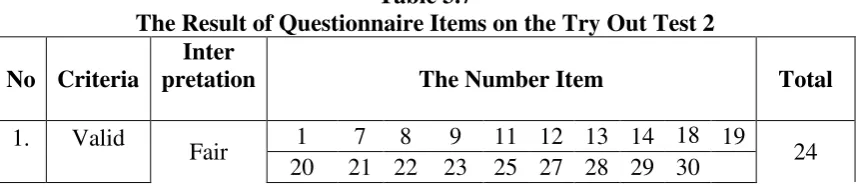
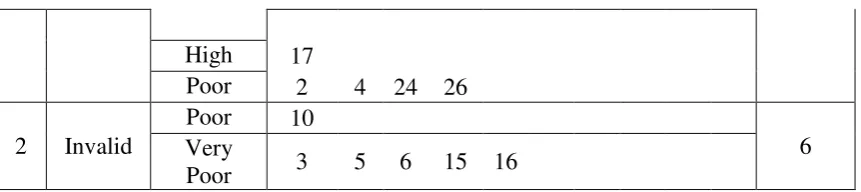
Table 3.7
The Result of Questionnaire Items on the Try Out Test 2
No Criteria
Inter
pretation The Number Item Total
1.
Valid
High 17
Poor 2 4 24 26
2 Invalid
Poor 10
6 Very
Poor 3 5 6 15 16
Based on the table above, it could be concluded that there were 6 items invalid and 24 items valid of the questionnaire try out 2.
Table 3.8
The Result of Questionnaire Items on the Try Out 3
No Criteria
Inter
pretation The Number Item Total
1.
Valid Fair 1 2 3 4 5 6 7 8 9 10
14 11 12 13 14
High Poor 2 Invalid
Poor
0 Very
Poor
Based on the data obtained, the all of item has been valid on the last time. So, all of item could be used for the research. There were 14 items is said valid of the instrument try out 3.
Table 3.9
The Result of Test Items on Try Out Test 1
No Criteria
Inter
pretation The Number Item Total
1. Valid Fair
2 6 7 8 10 11 12 15 16 17
39 18 20 21 22 24 26 27 28 29 30
31 32 33 34 35 36 38 39 40 41
Very
High 5 14 37
Poor 3 13
2 Invalid Poor 1 4 9 19 23 25 6
Based on the table above, it could be concluded that there were 6 items invalid and 39 items valid of the instrument try out 1.
Table 3.10
The Result of Test Items on Try Out Test 2
No Criteria
Inter
pretation The Number Item Total
1.
Valid Fair
2 6 7 8 10 11 15 17 18 21
32 22 23 24 26 27 29 31 33 34 35 36 37 38 39 40 41 42 43 44 45 Very
High
Poor 3 4
2. Invalid
Poor 1 19 20 25 28 30 32
13 Very
Poor 5 9 12 13 14 16
Based on the table above, it could be concluded that there were 13 items invalid and 32 items valid of the instrument try out 2.
Table 3.11
The Result of Test Items on Try Out Test 3
No Criteria
Inter
pretation The Number Item Total
1. Valid Fair
Very
High 2 6 11 14
2.
Invalid
Poor
0 Very
Poor
Based on the data obtained, the all of item has been valid on the last time. So, all of item could be used for the research. There were 16 items is said valid of the instrument try out 3.
2. Reliability test of the instrument
Good instrument in a research is not only the instrument valid, but it also reliable to measure what supposed to be measured. The instrument should be consistent what is measured. The writer used the Test-Retest method to measure the instrument try out.
Based on the data obtained, the coefficient correlation of questionnaire was 0,936 with the very high criteria. Then, the coefficient correlation of instrument test was 0,896 with the very high criteria.
It could be conclude that the data has reliable and it could be used for this research.
3. Index Difficulties Test
The difficulties test is the capability test to catch the respondent test who could answer the test correctly. Index difficulty is said high, if the total respondents test is high for answering the test correctly. Then, Index difficulty is said poor, if the total respondents test is poor for answering the test incorrectly.
FV=
Where:
FV : Index difficulties
R : The number of correct answer
N : The number of students taking the test60 . The Criteria of Index Difficulty are:
P < 0,30 = Difficult
P >= 0,30 - 0,70 = Fair
P > 0,70 = Easy
Table 3.12
The Analyze Index Difficulties of Instrument Try Out 1
No Criteria The Number Test Item Total
1. Easy 1 2 5 11 16 22 29 30 33 43 11 45
2.
Fair
3 4 6 7 8 9 10 12 13 14 34 15 17 18 19 20 21 23 24 25 26
27 28 31 32 34 35 36 37 38 39 40 41 42 44
3 Difficult 0
Based on the data obtained, there were 11 items were easy and 34 items of 45 items were fair in the instrument try out 1.
60
Table 3.13
The Analyze Index Difficulties of Instrument Try Out 2
No Criteria The Number Test Item Total
1. Easy 14 15 16 25 29 32 35 37 39 43 11 45
2.
Fair
1 2 3 4 5 6 7 8 9 10 34
11 12 13 17 18 19 20 21 22 23 24 26 27 28 30 31 33 34 36 38 40 41 42 44
3 Difficult 0
Based on the data obtained, there were 11 items were easy and 34 of 45 items were fair in the instrument try out 2.
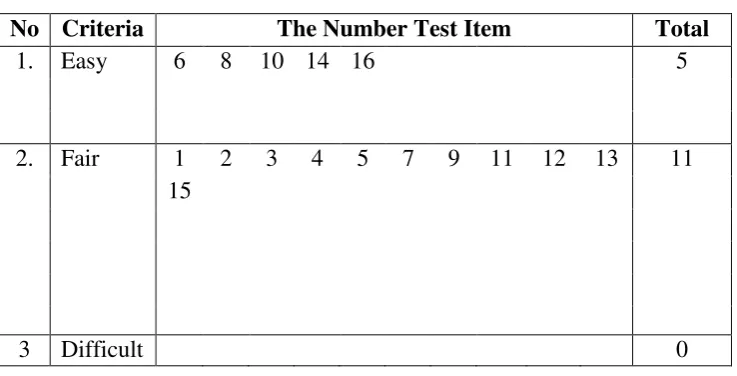
Table 3.14
The Analyze Index Difficulties of Instrument Try Out 3
No Criteria The Number Test Item Total
1. Easy 6 8 10 14 16 5
2.
Fair
1 2 3 4 5 7 9 11 12 13 11
15
3 Difficult 0
4. Index Discrimination
Index discrimination is capability of the score to differ between student high ability and student low ability. The figure shows the large of distinguish of items is called index discrimination.
To measure index discrimination, the writer used the formula in the following:
= Where:
J = Total of Students
= Total of Upper Limit’ Students
= Total of Lower Limit’ Students
= Total Score of Upper Limit = Total Score of Lower Limit
= = Proportion of Upper Limit Score
= = Proportion of Lower Limit Score
The criteria of interpretation the index discrimination:
DP ≤ 0 = Very Poor
0,00 < DP ≤ 0,20 = Poor
0,21 < DP ≤ 0,40 = Fair
0,71 < DP ≤ 1,00 = Very High61
Table 3.15
The Analyze of Index Distraction of Instrument Try Out 1
No. Criteria The Number Test Item Total
1. High 5 13 15 17 18 24 26 34 39 40 12 41 42
2. Fair 2 3 4 6 7 8 9 10 11 12
29 19 20 21 22 23 25 27 28 29 30
31 32 33 35 36 38 43 44 45
3. Poor 1 14 16 37 4
Based on the data obtained, it could be concluded there were 12 items were high discrimination, there were 29 items were fair and 4 items were poor.
Table 3.16
The Analyze of Index Distraction of Instrument Try Out 2
No. Criteria The Number Test Item Total
1. High 6 7 11 23 31 35 38 42 43 44 10 2. Fair 2 3 4 13 15 17 18 19 20 21
29 22 24 25 26 27 28 29 30 32 33
34 36 37 39 40 41 45
3. Poor 1 5 9 12 14 16 6
From the data above, it could be concluded that all of items instrument try out have been valid could be given for the instrument test in this research.
61
Suharsimi Arikunto, Dasar-Dasar Evaluasi Pendidikan Twelve Edition, Jakarta: