R E S E A R C H A R T I C L E
Open Access
Accuracy of syndrome definitions based on
diagnoses in physician claims
Geneviève Cadieux
1*, David L Buckeridge
1,2, André Jacques
3, Michael Libman
4, Nandini Dendukuri
1,
Robyn Tamblyn
1,4Abstract
Background:Community clinics offer potential for timelier outbreak detection and monitoring than emergency departments. However, the accuracy of syndrome definitions used in surveillance has never been evaluated in community settings. This study’s objective was to assess the accuracy of syndrome definitions based on diagnostic codes in physician claims for identifying 5 syndromes (fever, gastrointestinal, neurological, rash, and respiratory including influenza-like illness) in community clinics.
Methods:We selected a random sample of 3,600 community-based primary care physicians who practiced in the fee-for-service system in the province of Quebec, Canada in 2005-2007. We randomly selected 10 visits per physician from their claims, stratifying on syndrome type and presence, diagnosis, and month. Double-blinded chart reviews were conducted by telephone with consenting physicians to obtain information on patient
diagnoses for each sampled visit. The sensitivity, specificity, and positive predictive value (PPV) of physician claims were estimated by comparison to chart review.
Results:1,098 (30.5%) physicians completed the chart review. A chart entry on the date of the corresponding claim was found for 10,529 (95.9%) visits. The sensitivity of syndrome definitions based on diagnostic codes in physician claims was low, ranging from 0.11 (fever) to 0.44 (respiratory), the specificity was high, and the PPV was moderate to high, ranging from 0.59 (fever) to 0.85 (respiratory). We found that rarely used diagnostic codes had a higher probability of being false-positives, and that more commonly used diagnostic codes had a higher PPV. Conclusions:Future research should identify physician, patient, and encounter characteristics associated with the accuracy of diagnostic codes in physician claims. This would enable public health to improve syndromic
surveillance, either by focusing on physician claims whose diagnostic code is more likely to be accurate, or by using all physician claims and weighing each according to the likelihood that its diagnostic code is accurate.
Background
Syndromic surveillance is used widely by public health departments to detect and monitor unusual disease activity in the population by extracting nonspecific clini-cal data from information systems in cliniclini-cal settings [1-4]. Whereas much syndromic surveillance practice [3] and research [5] has focused on visits to emergency departments (ED), visits to community clinics offer another promising source of data. Syndromes followed in practice, such as influenza-like-illness (ILI), typically involve earlier, milder stages of disease, and most
affected persons are likely to self-treat [6-8], at least initially, or present to walk-in clinics [6]. In fact, researchers have demonstrated that excess ILI activity can be detected earlier using data from clinics as com-pared to data from EDs [9-11]. The accuracy of diagnos-tic data from community clinics has not, however, been established.
Many syndromic surveillance systems use Interna-tional Classification of Disease, 9th revision (ICD-9) diagnostic codes in administrative databases to monitor syndrome occurrence [12]. For this purpose, expert panels have generated groupings of ICD-9 codes corre-sponding to conceptual syndrome definitions [13]. Administrative databases offer great promise for popula-tion-based surveillance by providing access to diagnostic * Correspondence: [email protected]
1
Department of Epidemiology, Biostatistics and Occupational Health, McGill University, Montreal, Canada
Full list of author information is available at the end of the article
information from many sites, including community healthcare settings. However, unlike medical procedure codes, ICD-9 diagnostic codes are not usually linked to healthcare provider payment, and therefore are not audited by health administrative authorities. Because of this, variation in diagnostic coding between physicians and between institutions is expected.
In a pilot study [14], we evaluated the accuracy of diagnostic codes in physician claims for identifying acute respiratory infections in nine Montreal-area com-munity-based physicians. We abstracted the diagnosis from the medical chart for the 3,526 visits made by 729 sampled patients in 2002-2005, and compared the medi-cal chart diagnosis to the ICD-9 code on the corre-sponding physician claim. For all acute respiratory infections combined, we found a sensitivity of 0.49, 95% CI (0.45, 0.53), and a positive predictive value (PPV) of 0.93, 95% CI (0.91, 0.94). These pilot study results are promising, but there is a need for a large-scale, popula-tion-based investigation of the accuracy of diagnostic codes used in syndromic surveillance.
The objective of the present study was to assess the accuracy of syndrome definitions based on diagnostic codes from a representative sample of physician claims for identifying 5 syndromes (fever, gastrointestinal, neu-rological, rash, and respiratory, including influenza-like illness (ILI)) in community healthcare settings. These syndromes were selected for their relevance to public health and the likelihood of being first detected among patients presenting to community healthcare settings.
Methods
Context
This study was conducted in the province of Quebec, Canada, where universal health coverage is provided through the provincial health insurance plan. Each Canadian province maintains a population-based registry of insured persons and claims for all physician visits remunerated on a fee-for-service basis. Physician claims include information on the diagnosis (recorded as an ICD-9 code), medical procedure, visit date, location, and cost of service. All claims also record unique physician and patient identifiers that can be used to create longi-tudinal histories of healthcare use. In the province of Quebec, 99% of residents have provincial health insur-ance and 85-95% of medical visits are remunerated on a fee-for-service basis [15]. In 2006, there were more than 7.6 million inhabitants in Quebec [16], and 18,908 active registered physicians [17]. The availability of diagnostic information for nearly all medical visits to Quebec phy-sicians represents an invaluable opportunity for asses-sing the validity of uasses-sing diagnostic codes in physician claims for population-based surveillance, including syn-dromic surveillance.
Study design and sampling
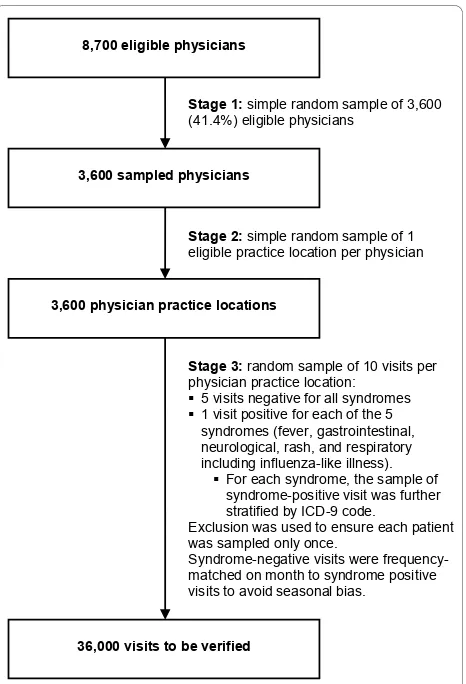
The accuracy of diagnostic codes in physician claims for identifying syndromes was assessed by comparison to clinical information in the corresponding medical chart. To ensure representativeness, we used a population-based, 3-stage stratified random sample of 36,000 visits (Figure 1). In the first stage (Figure 1 Stage 1), the pro-vincial health insurance agency identified all physicians who were eligible to be included in our study. To be eli-gible, physicians had to be a general practitioner, pedia-trician, internist, geriatrician or general surgeon who practiced in the fee-for-service system in a private clinic, community health center, or hospital-based ambulatory care clinic during the 2-year study period (October 1, 2005 to September 30, 2007). Internists and general sur-geons were included in our sample because, especially in rural-remote and underserved areas, these physicians may provide first-contact care and act as patients’family physician. From the 8,700 eligible physicians identified, the provincial health insurance agency selected a ran-dom sample of 3,600 (41.4%) physicians.
8,700 eligible physicians
Stage 1: simple random sample of 3,600 (41.4%) eligible physicians
3,600 sampled physicians
Stage 2: simple random sample of 1 eligible practice location per physician
3,600 physician practice locations
Stage 3: random sample of 10 visits per physician practice location:
5 visits negative for all syndromes 1 visit positive for each of the 5
syndromes (fever, gastrointestinal, neurological, rash, and respiratory including influenza-like illness).
For each syndrome, the sample of syndrome-positive visit was further stratified by ICD-9 code.
Exclusion was used to ensure each patient was sampled only once.
Syndrome-negative visits were frequency-matched on month to syndrome positive visits to avoid seasonal bias.
36,000 visits to be verified
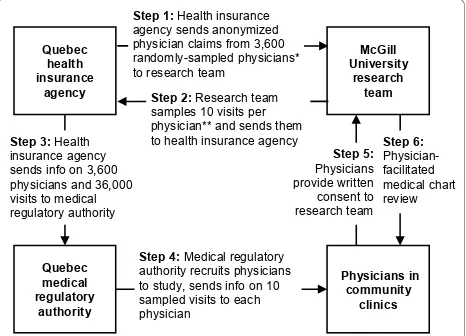
In the second stage (Figure 1 Stage 2), to facilitate chart retrieval for review, the health insurance agency randomly selected one eligible community practice loca-tion for each physician. The health insurance agency then sent the research team an anonymized file contain-ing all physician claims billed by the 3,600 physicians from their respective selected community practice loca-tion during the 2-year study period (Figure 2 Step 1).
In the third stage (Figure 1 Stage 3), the research team randomly selected 5 syndrome-positive visits, i.e., 1 visit for each of fever, gastrointestinal, neurological, rash, and respiratory syndrome (including ILI), and 5 visits nega-tive for all syndromes. Visits were classified as posinega-tive for a syndrome if a physician claim for the visit had an ICD-9 code that was part of the syndrome definition. Because syndromes have low population prevalence, to maximize data collection efficiency [18], positive visits were over-sampled relative to syndrome-negative ones, so as to yield 1 syndrome-positive visit per syndrome per physician and 5 syndrome-negative visits per physician. When sampling syndrome-positive claims, to maximize the number of syndrome-positive ICD-9 codes verified, we further stratified on ICD-9 code. Because two or more syndromes can occur concurrently in the same patient [19], syndrome-negative visits were negative forall syndromes. Syndrome-negative visits
were also matched to syndrome-positive visits on calen-dar month to avoid bias due to syndrome seasonality. To avoid bias due to visits being clustered within patients, restriction was used to ensure that each patient was only sampled once. The list of 10 sampled visits was enumer-ated for each of the 3,600 physicians, for a total of 36,000 visits. An anonymized unique identifier, the study num-ber, was assigned to each sampled visit by the research
team. The list of 36,000 sampled visits was then sent to the health insurance agency (Figure 2 Step 2).
Syndrome definitions
We verified two sets of definitions for the 5 syndromes under study: the definitions developed and published by the US Centers for Disease Control and Prevention (CDC) in 2003 [13], and used by the US Department of Defense’s (DoD) Electronic Surveillance System for Early Notification of Community-based Epidemics (ESSENCE), as well as the corresponding definitions in the University of Pittsburgh’s Real-time Outbreak and Disease Surveil-lance (RODS) system [19]. For ILI, we used the large-group (sensitive) and small-large-group (specific) definitions developed for the DoD ESSENCE system [20]. These definitions are similar to the consensus syndrome defini-tions being developed by representatives from the 10 syndromic surveillance systems in place in the US [21], which have not yet been mapped to ICD-9 codes.
Physician recruitment
To preserve physician and patient anonymity, the health insurance agency sent the list of 3,600 physicians and 36,000 visits sampled by the research team to the medi-cal regulatory authority (Figure 2 Step 3). The medimedi-cal regulatory authority has the legal right to access confi-dential physician and patient information, therefore the list it received included physician names and mailing addresses, as well as patient names, insurance numbers, and dates of birth. The medical regulatory authority acted as a trusted third party and recruited physicians to the study on behalf of the research team; it also pro-vided physicians with information on the 10 sampled visits (Figure 2 Step 4). Interested physicians mailed their written consent and contact information to the research team (Figure 2 Step 5). Non-responding physi-cians were sent up to four reminders. Physician recruit-ment began in September 2008 and ended in August 2009. To maximize participation, physicians were offered $50 compensation for their participation and a summary of study findings.
Physician-facilitated medical chart review
The medical regulatory authority sent each physician the list of 10 sampled visits (Figure 2 Step 3). Lists sent to physicians included patients’first and last names, date of birth, health insurance number, and date of the visit to be verified, as well as the study number for each visit. Because the lists sent to physicians contained both patient information and study numbers, it enabled phy-sicians to retrieve the relevant medical charts, and researchers to link the information collected through chart review to the anonymized physician claims file. During the chart review, interviewers and physicians
Quebec
Step 1: Health insurance agency sends anonymized physician claims from 3,600 randomly-sampled physicians* to research team
Step 4: Medical regulatory authority recruits physicians to study, sends info on 10 sampled visits to each physician sends info on 3,600 physicians and 36,000 visits to medical regulatory authority
Step 2: Research team samples 10 visits per physician** and sends them to health insurance agency
referred to each visit using only the study number and visit date, thereby preserving patient anonymity.
Physician-facilitated medical chart reviews began in September 2008 and ended in December 2009. Using a previously published methodology [22], trained inter-viewers contacted consenting physicians by telephone to perform the chart review (Figure 2 Step 6). For each of the 10 sampled visits, the interviewer asked the physi-cian to list all diagnoses. For each diagnosis correspond-ing to a syndrome definition, the interviewer asked the physician about the signs, symptoms, and key findings recorded in the medical chart, as well as the most likely etiology for the diagnosis (based solely on information available at the time of the visit).
Physician responses were entered directly into a data-base by the interviewer. Diagnoses were selected from a searchable list of diagnoses (mapped to ICD-9 codes) or, if the physician had recorded the ICD-9 code in the medical chart, the ICD-9 code was entered directly. For each positive diagnosis, a list of syndrome-specific signs and symptoms was elicited, and the inter-viewer recorded whether the sign or symptom had been present, absent, or not recorded in the medical chart. Symptoms or signs not in the list and other key find-ings, such as epidemiologic links to other diagnosed cases or known outbreaks, were recorded as free text in separate fields. The data collection tool was translated to French for use with French-speaking physicians, and back-translated to English to ensure comparability of data collection.
At the time of chart review, the physician and inter-viewer were both blinded to the ICD-9 code in the phy-sician claim and the positive or syndrome-negative status of the claim. To minimize measurement error due to inter-rater differences, interviewers were trained to use the data collection tool. Inter-rater relia-bility was assessed at baseline by having interviewers perform 2 simulated physician interviews of 10 visits each (for a total of 20 visits). To maintain data quality, interviewers underwent quality assurance monitoring every 3 months. Each assessment was comprised of 2 simulated physician interviews of 10 visits each (for a total of 20 visits). Agreement between raters was mea-sured using the intraclass correlation coefficient (ICC).
Linkage of the medical chart review data to the physician claims data
The database containing the medical chart review data was linked to the physician claims file using the study number, physician identifier, and visit date. In our pilot study [14], we found that the visit date in the chart sometimes differed slightly from the visit date on the claim. We considered the chart and the claim to refer to the same visit if the visit date in the chart was within 0
(identical date) to 3 days from the visit date in the claim.
Physician characteristics that may influence participation
Physician gender, preferred language (French or Eng-lish), specialty, practice setting, and geographic location were obtained from the health insurance agency. Physi-cian year of licensure was obtained from the medical regulatory authority. The number of days worked per year was calculated as the number of days when at least one claim was billed by the physician to the health insurance agency. The number of patients seen per day worked was calculated as the number of distinct patients for which one or more claim was billed by the physician per day worked. The number and prevalence of syn-drome-positive visits were calculated for each physician using claims billed from the selected practice location during the 2-year study period.
Statistical methods
For each visit, we assessed if the ICD-9 code in the phy-sician claim and the diagnosis in the corresponding medical chart agreed as to the presence of each syn-dromes and ILI. For example, if the diagnosis in the claim was cough (786.2) and the diagnosis in the corre-sponding medical chart was acute bronchitis (466.0), then both the claim diagnosis and the chart diagnosis were positive for respiratory syndrome, therefore the claim was a true-positive for respiratory syndrome. If the diagnosis in the claim was cough (786.2) and the diagnoses in the chart were hypertension (401.9) and diabetes (250.0), then the claim diagnosis was positive for respiratory syndrome and the chart diagnoses were not, therefore the claim was a false-positive for respira-tory syndrome.
The negative predictive value (NPV) of each syndrome definition was estimated directly from the data. Because we stratified syndrome-positive visits by ICD-9 code, we had to use an adjustment based on Bayes Theorem [23] to estimate the PPV of each syndrome. The PPV was estimated as a weighted average of each ICD-9 code’s PPV, the weight being the number of visits with a given ICD-9 code divided by the total number of visits posi-tive for that syndrome among participating physicians.
estimated from the PPV and NPV [24] using the correc-tion for verificacorrec-tion bias [23], re-weighting for the differ-ent sampling fractions. We estimated the 95% CI for the bias-corrected sensitivity and specificity using the meth-ods described by Begg and Greenes [23].
Ethics review
The research protocol for this study was reviewed and approved by the McGill University Institutional Review Board, the Quebec privacy commission (Commission d’accès à l’information du Québec), the legal department of the Quebec health insurance agency (Régie de l’ assur-ance maladie du Québec), and the Quebec medical reg-ulatory authority (Collège des médecins du Québec).
Results
Between October 1, 2005 and September 30, 2007, the 3,600 study physicians billed for over 20 million visits by 4.8 million patients (61% of the province’s popula-tion) from their randomly selected community practice.
Physician participation
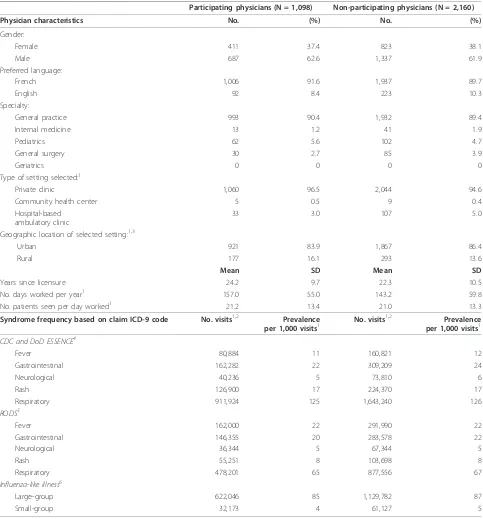
Of 3,600 physicians contacted, 172 (4.8%) had an incor-rect address on file with the health insurance agency, and 170 (4.7%) were discovered to be ineligible (recently deceased, retired, on sick/maternity leave, no longer practicing at the selected practice location). Of the 3,258 remaining physicians, 1,129 (34.7%) physicians consented to participate in the study, 218 (6.7%) refused, and 1,911 (58.7%) did not respond. Of the 1,129 consenting physi-cians, 1,098 (97.3%) completed the physician-facilitated medical chart review, and 31 (2.7%) were unreachable or withdrew consent prior to interview. Participating and non-participating physicians were similar on all measured variables except two (Table 1): as compared to non-parti-cipants, participants had been in practice longer and had worked more days during the study period. Syndrome prevalence was similar among participating and non-participating physicians, and ranged from 5 per 1,000 visits for neurological syndrome and ILI small-group, to 126 per 1,000 visits for respiratory syndrome.
Inter-rater agreement
Agreement between raters was measured using simu-lated physician interviews shortly before the start of data collection and every 3 months thereafter. Agreement was perfect on all assessments (ICC = 1.00).
Date agreement between the claim and the medical chart
Of the 10,980 visits selected for verification (10 visits per participating physician), physicians were able to access the corresponding medical chart for 10,669 (97.2%). The most common reasons for being unable to access the chart were inability to locate the medical
chart (151 charts) and medical chart in storage with retrieval fee (140 charts). For 10,465 (98.1%) of the sampled visits, the visit date in the medical chart was identical to the visit date on the claim. Allowing for potential date transcription errors during billing, an additional 64 (0.6%) visits with a date in the medical chart that was within 1-3 days of the visit date on the claim were identified, for a total of 10,529 visits for which both the medical chart and the claim was avail-able and the visit dates were in agreement (within the 3 day time window).
Syndrome agreement between the claim ICD-9 code and the medical chart diagnosis
Table 2 shows the accuracy of ICD-9 codes in physician claims for identifying syndromes, as compared to the medical chart. The sensivity of ICD-9 codes in physician claims for identifying syndromes was low, ranging from 0.11, 95% CI (0.10, 0.13) for fever syndrome to 0.44, 95% CI (0.41, 0.47) for respiratory syndrome. The PPV of ICD-9 codes in physician claims for identifying syn-dromes was moderate to high, ranging from 0.59, 95% CI (0.55, 0.64) for fever syndrome to 0.85, 95% CI (0.83, 0.88) for respiratory syndrome. Both the specificity and NPV of ICD-9 codes in physician claims were near-per-fect for all syndromes studied.
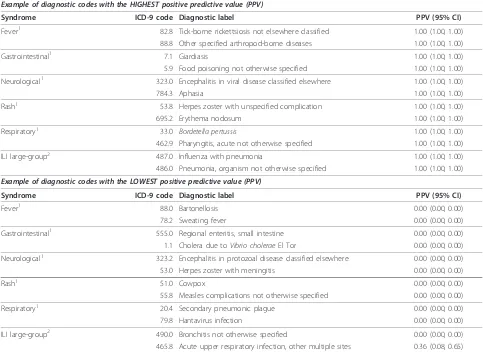
Additional file 1 (excerpted in Table 3) shows the PPV of physician claims for identifying syndromes for each ICD-9 code individually. There was wide variation in PPV between different ICD-9 codes in a given syn-drome. ICD-9 codes that were very rarely used by physi-cians, for example tularemia (ICD-9 code: 21.9), had a high probability of being false-positives, and therefore a very low PPV. ICD-9 codes for common symptoms, for example fever (ICD-9 code: 780.6), had a lower prob-ability of being false-positives, and a higher PPV. ICD-9 codes that represent common diagnoses, for example acute bronchitis (ICD-9 code: 466.0), had the lowest probability of being false-positives, and the highest PPV.
Discussion
Table 1 Characteristics of participating and non-participating physicians
Participating physicians (N = 1,098) Non-participating physicians (N = 2,160) Physician characteristics No. (%) No. (%)
Gender:
Female 411 37.4 823 38.1
Male 687 62.6 1,337 61.9
Preferred language:
French 1,006 91.6 1,937 89.7
English 92 8.4 223 10.3
Specialty:
General practice 993 90.4 1,932 89.4
Internal medicine 13 1.2 41 1.9
Pediatrics 62 5.6 102 4.7
General surgery 30 2.7 85 3.9
Geriatrics 0 0 0 0
Type of setting selected:1
Private clinic 1,060 96.5 2,044 94.6
Community health center 5 0.5 9 0.4
Hospital-based ambulatory clinic
33 3.0 107 5.0
Geographic location of selected setting:1,3
Urban 921 83.9 1,867 86.4
Rural 177 16.1 293 13.6
Mean SD Mean SD
Years since licensure 24.2 9.7 22.3 10.5
No. days worked per year1 157.0 55.0 143.2 59.8
No. patients seen per day worked1 21.2 13.4 21.0 13.3
Syndrome frequency based on claim ICD-9 code No. visits1,2 Prevalence
per 1,000 visits1 No. visits
1,2 Prevalence
per 1,000 visits1 CDC and DoD ESSENCE4
Fever 80,884 11 160,821 12
Gastrointestinal 162,282 22 309,209 24
Neurological 40,236 5 73,810 6
Rash 126,900 17 224,370 17
Respiratory 911,924 125 1,643,240 126
RODS5
Fever 162,000 22 291,990 22
Gastrointestinal 146,355 20 283,578 22
Neurological 36,344 5 67,344 5
Rash 55,251 8 103,698 8
Respiratory 478,201 65 877,556 67
Influenza-like illness6
Large-group 622,046 85 1,129,782 87
Small-group 32,173 4 61,127 5
1As per our study design, for each physician, a single practice location was randomly selected to facilitate the validation process. The information in this table is
based in claims generated from the selected practice location during the 2-year study period.
2There were a total of 7,315,994 visits to the 1,098 participating physicians, and 13,010,410 visits to the 2,160 eligible non-participating physicians at the
selected practice location during the 2-year study period.
3We tested the statistical significance (at the p < 0.05 level) of any differences between participating and non-participating physicians using a multivariate
logistic regression model where the dependent variable was participation and the independent variables were all characteristics in Table 1. Due to overlap between CDC, RODS, and ILI syndrome definitions, to avoid collinearity, we used separate models for each set of syndrome definitions. As compared to
non-participating physicians, non-participating physicians had been in practice longer (odds ratio (OR)per 10 years since licensure, 1.15; 95% CI, 1.05-1.25), had worked more
days (ORper 50 days, 1.18; 95% CI, 1.09-1.28) during the 2-year study period.
4Syndrome case definitions developed and published by the US Centers for Disease Control and Prevention (CDC) in 2003, and used by the US Department of
Defense’s Electronic Surveillance System for Early Notification of Community-based Epidemics (ESSENCE).
5Syndrome case definitions developed in the context of the University of Pittsburgh
’s Real-time Outbreak and Disease Surveillance (RODS) system.
6Syndrome case definitions developed in the context of the US Department of Defense
’s Electronic Surveillance System for Early Notification of
reported in physician claims. Unexpectedly, ILI small-group had the lowest PPV of all syndromes definitions studied, much lower than previously reported by others [20]. The small-group definition of ILI is made up of only four ICD-9 codes: influenza with pneumonia (487.0), influenza with other respiratory manifestations (487.1), influenza with other manifestations (487.8), and acute upper respiratory infection, other multiple sites (465.8). Based on our interviews of over a thousand community physicians, we think that the poor accuracy of the ILI small-group definition reflects the common usage of the word ‘flu’to describe a vague illness or a combination of non-specific symptoms. In addition to observing variation in physician claim accuracy between syndromes, we also found large variation in accuracy and prevalence between diagnostic codes within syn-dromes. Diagnostic codes with a very low prevalence were generally more likely to be false-positives; conver-sely, diagnostic codes with a higher prevalence were generally less likely to be false-positives, especially if they represented a diagnosis, as opposed to a symptom. This suggests that physicians are more likely to know the correct diagnostic code for a frequently diagnosed ailment, as compared to a rare one.
Rigorous attempts to assess the accuracy of ICD-9 codes used in syndromic surveillance as compared to the medical chart have been few, and they have relied
on small convenience samples of emergency depart-ments. In one such study, the accuracy of ICD-9 codes in ED reports for identifying 3 syndromes (fever, gastro-intestinal, and respiratory) was assessed as compared to hospital chart diagnoses in the context of the US DoD ESSENCE surveillance system [25]. For greater data col-lection efficiency, syndrome-positive ED reports were over-sampled relative to syndrome-negative ones; how-ever, analyses were not adjusted for this differential sam-pling strategy, resulting in verification bias [23], and leading to a large overestimation of sensivity and under-estimation of specificity. To illustrate, the proportion of fever-positive visits in the sample was 0.19, whereas the proportion of fever-positive visits in the population is approximately 0.01 (based on our study). The authors reported a sensitivity of 0.69 and a specificity of 0.95. However, adjusting for verification bias, the estimates would be approximately 0.09 for sensivity and 1.00 for specificity, which is similar to our results. In another study, the accuracy of ICD-9 codes in ED reports for identifying 7 syndrome definitions (botulinic, constitu-tional, gastrointestinal, hemorrhagic, neurological, rash, and respiratory) was assessed against hospital chart diag-noses in the context of the RODS surveillance system [19]. To maximize the quantity of syndrome-positive ICD-9 codes verified, the investigators selected a random sample of syndrome-positive visits from ED reports, stratified on
Table 2 Accuracy of ICD-9 coded diagnoses in physician claims, as compared to ICD-9 coded diagnoses from physician-facilitated medical chart review, for identifying constitutional, gastrointestinal, neurological, rash, and respiratory syndrome, as well as influenza-like illness (ILI) (N = 10,529 visits with matched claim-record pair)
Syndrome definition No. visits in verified claims
No. visits in verified charts
Sensivity (95% CI)
Specificity (95% CI)
PPV (95% CI) NPV (95% CI)
CDC and DoD
ESSENCE1
Fever 601 656 0.11 (0.10, 0.13) 0.99 (0.99, 0.99) 0.59 (0.55, 0.64) 0.94 (0.93, 0.95) Gastrointestinal 855 888 0.23 (0.20, 0.26) 0.99 (0.99, 0.99) 0.71 (0.66, 0.75) 0.94 (0.94, 0.95) Neurological 971 693 0.17 (0.14, 0.21) 1.00 (1.00, 1.00) 0.67 (0.64, 0.70) 0.98 (0.98, 0.98) Rash 897 905 0.20 (0.18, 0.23) 0.99 (0.99, 0.99) 0.66 (0.62, 0.70) 0.95 (0.95, 0.96) Respiratory 1,049 1,779 0.44 (0.41, 0.47) 0.97 (0.96, 0.98) 0.85 (0.83, 0.88) 0.84 (0.83, 0.85)
RODS2
Fever 873 961 0.14 (0.12, 0.16) 0.99 (0.99, 0.99) 0.60 (0.56, 0.64) 0.91 (0.90, 0.92) Gastrointestinal 703 834 0.20 (0.18, 0.23) 0.99 (0.99, 0.99) 0.68 (0.63, 0.73) 0.94 (0.94, 0.95) Neurological 874 523 0.16 (0.13, 0.20) 1.00 (1.00, 1.00) 0.52 (0.48, 0.55) 0.99 (0.98, 0.99) Rash 814 718 0.12 (0.10, 0.14) 1.00 (1.00, 1.00) 0.63 (0.59, 0.66) 0.96 (0.96, 0.97) Respiratory 665 1,209 0.29 (0.26, 0.32) 0.98 (0.98, 0.98) 0.74 (0.70, 0.79) 0.87 (0.86, 0.88)
Influenza-like illness3
Large-group 653 1,232 0.38 (0.35, 0.41) 0.98 (0.98, 0.98) 0.77 (0.73, 0.81) 0.88 (0.87, 0.89) Small-group 53 49 0.18 (0.12, 0.26) 1.00 (1.00, 1.00) 0.29 (0.16, 0.41) 0.99 (0.99, 0.99)
1Syndrome case definitions developed and published by the US Centers for Disease Control and Prevention (CDC) in 2003, and used by the US Department of
Defense’s Electronic Surveillance System for Early Notification of Community-based Epidemics (ESSENCE).
2Syndrome case definitions developed in the context of the University of Pittsburgh
’s Real-time Outbreak and Disease Surveillance (RODS) system.
3Syndrome case definitions developed in the context of the US Department of Defense
’s Electronic Surveillance System for Early Notification of
syndrome-positive ICD-9 code, such that an equal number of syndrome-positive visits was sampled for each ICD-9 code in a syndrome. For example, fever (780.6) and bubo-nic plague (020.0), both corresponding to constitutional syndrome, contributed the same number of cases. How-ever, the prevalence and accuracy of each ICD-9 code in a syndrome is different, and because the analyses were not adjusted for the uniform sampling strategy used, the reported estimates of sensitivity, specificity, PPV and NPV are biased. In a third study [26], the accuracy of ICD-9 coded physician diagnoses from 9 hospital EDs for identi-fying‘acute respiratory illness’was assessed by comparison to medical chart review. A simple random sample was used; therefore the results were not subject to verification bias. The authors reported a sensitivity of 0.43, 95% CI (0.28-0.58) for acute respiratory illness, which is almost identical to our sensitivity estimate for respiratory syn-drome; their estimates of NPV and specificity were also
similar to ours, but their PPV estimate of 0.45, 95% CI (0.29-0.61) is much lower than ours.
Our study had several strengths and limitations. We used a large population-based random sample of all phy-sicians working in the fee-for-service system in commu-nity healthcare settings in the province of Quebec in 2005-2007, thereby capturing potential ICD-9 coding dif-ferences between physicians, institutions, and regions. Not only did we estimate the accuracy of syndrome defi-nitions, as others have done, but our study design enabled us to estimate the PPV of individual diagnostic codes within each syndrome definition. Matching syn-drome-negative visits to syndrome-positive visit on calen-dar month ensured that our results were not affected by seasonal bias. Because two or more syndromes can occur concurrently in the same person [19], our requirement that syndrome-negative visits be negative for all syn-dromes ensured that we did not overestimate
false-Table 3 Example of diagnostic codes with the highest and lowest positive predictive value (excerpted from additional file 1)
Example of diagnostic codes with the HIGHEST positive predictive value (PPV)
Syndrome ICD-9 code Diagnostic label PPV (95% CI)
Fever1 82.8 Tick-borne rickettsiosis not elsewhere classified 1.00 (1.00, 1.00)
88.8 Other specified arthropod-borne diseases 1.00 (1.00, 1.00)
Gastrointestinal1 7.1 Giardiasis 1.00 (1.00, 1.00)
5.9 Food poisoning not otherwise specified 1.00 (1.00, 1.00)
Neurological1 323.0 Encephalitis in viral disease classified elsewhere 1.00 (1.00, 1.00)
784.3 Aphasia 1.00 (1.00, 1.00)
Rash1 53.8 Herpes zoster with unspecified complication 1.00 (1.00, 1.00)
695.2 Erythema nodosum 1.00 (1.00, 1.00)
Respiratory1 33.0 Bordetella pertussis 1.00 (1.00, 1.00)
462.9 Pharyngitis, acute not otherwise specified 1.00 (1.00, 1.00)
ILI large-group2 487.0 Influenza with pneumonia 1.00 (1.00, 1.00)
486.0 Pneumonia, organism not otherwise specified 1.00 (1.00, 1.00)
Example of diagnostic codes with the LOWEST positive predictive value (PPV)
Syndrome ICD-9 code Diagnostic label PPV (95% CI)
Fever1 88.0 Bartonellosis 0.00 (0.00, 0.00)
78.2 Sweating fever 0.00 (0.00, 0.00)
Gastrointestinal1 555.0 Regional enteritis, small intestine 0.00 (0.00, 0.00)
1.1 Cholera due toVibrio choleraeEl Tor 0.00 (0.00, 0.00)
Neurological1 323.2 Encephalitis in protozoal disease classified elsewhere 0.00 (0.00, 0.00) 53.0 Herpes zoster with meningitis 0.00 (0.00, 0.00)
Rash1 51.0 Cowpox 0.00 (0.00, 0.00)
55.8 Measles complications not otherwise specified 0.00 (0.00, 0.00)
Respiratory1 20.4 Secondary pneumonic plague 0.00 (0.00, 0.00)
79.8 Hantavirus infection 0.00 (0.00, 0.00)
ILI large-group2 490.0 Bronchitis not otherwise specified 0.00 (0.00, 0.00)
465.8 Acute upper respiratory infection, other multiple sites 0.36 (0.08, 0.65)
1Syndrome case definitions developed and published by the US Centers for Disease Control and Prevention (CDC) in 2003, and used by the US Department of
Defense’s Electronic Surveillance System for Early Notification of Community-based Epidemics (ESSENCE).
2Syndrome case definition developed in the context of the US Department of Defense
’s Electronic Surveillance System for Early Notification of Community-based
negatives and underestimate sensitivity and NPV. Our participation rate, though low, was consistent with that of other large population-based studies of Canadian physicians [27,28]. Participating and non-participating physicians were similar on nearly all measured variables. The participation rate was significantly lower among recently licensed physicians; recently licensed physicians may have been less likely to participate in our study because they tend to experience greater practice mobility [29] and report more impediments to practice [30] than their more experienced counterparts. Unfortunately, the accuracy of very rare syndrome-positive ICD-9 codes, such as cutaneous and pulmonary anthrax (22.0 and 22.1), could not be estimated because, as expected, they were not present in any of the 1,098 participating physi-cians’claims during the 2-year study period.
Conclusions
We found that diagnostic codes in physician claims from community healthcare settings have low sensitivity, mod-erate to high PPV, and near-perfect specificity and NPV for identifying 5 syndromes (fever, gastrointestinal, neuro-logical, rash, and respiratory, including ILI). Future research should evaluate the practical implications of our findings on decision-making in response to alerts from existing syndromic surveillance systems. Future research should also identify physician, patient, and encounter characteristics associated with better accuracy of diagnos-tic codes in physician claims. This would enable public health to improve syndromic surveillance, either by focus-ing on physician claims whose diagnostic code is more likely to be accurate, or by using all physician claims and weighing each according to the likelihood that its diagnos-tic code is accurate. We also estimated the prevalence and PPV of individual diagnostic codes within each syndrome. We found that rarely used diagnostic codes had a higher probability of being false-positives, and that more commonly used diagnostic codes had a higher PPV. These findings may be useful to the ongoing development of sensitive and specific consensus syndrome definitions, as either a sensitive or a specific definition may be more useful depending on the surveillance objective.
Additional material
Additional file 1: Positive predictive value of individual ICD-9 codes within each syndrome case definition. For all 12 syndrome case definitions investigated, the positive predictive value of diagnoses in physician claims is provided for each individual ICD-9 code.
Acknowledgements
The authors would like to thank Jimmy Fragos for providing technical support and database management, as well as Louise Ullyatt, Milva Salera, and Isabelle Vaillancourt for conducting physicians interviews. We also thank
Patricia Plouffe and Sandrine Martineau for providing clerical support, and Rosalba Pupo for overseeing the project’s finances. This work was supported by the Canadian Institutes for Health Research and the Research Institute of the McGill University Health Centre.
Author details
1Department of Epidemiology, Biostatistics and Occupational Health, McGill
University, Montreal, Canada.2Direction de la Santé Publique de Montréal,
Montreal, Canada.3Direction de l
’amélioration de l’exercice, Collège des Médecins du Québec, Montreal, Canada.4Department of Medicine, McGill
University, Montreal, Canada.
Authors’contributions
All authors read and approved the final manuscript. GC collected the data, performed the data analysis, and is the primary author of the manuscript. AJ helped develop the methods and collect the data, and provided useful comments on the manuscript. ML helped develop the methods and provided useful comments on the manuscript. ND helped develop the methods, supervised the analysis, and provided useful comments on the manuscript. RT and DLB provided access to claims data and study subjects, helped develop the methods, oversaw the analysis, and provided useful comments on the manuscript.
Competing interests
The authors declare that they have no competing interests.
Received: 6 September 2010 Accepted: 7 January 2011 Published: 7 January 2011
References
1. Bravata DM, Rahman MM, Luong N, Divan HA, Cody SH:A comparison of syndromic incidence data collected by triage nurses in Santa Clara County with regional infectious disease data.J Urban Health2003,80(2, Suppl 1):i122, Ref Type: Abstract.
2. Mandl KD, Overhage JM, Wagner MM, Lober WB, Sebastiani P, Mostashari F,
et al:Implementing syndromic surveillance: A practical guide informed by the early experience.Journal of the American Medical Informatics Association2004,11:141-150.
3. Buehler JW, Sonricker A, Paladini M, Soper P, Mostashari F:Syndromic surveillance practice in the United States: findings from a survey of state, territorial, and selected local health departments.Advances in Disease Surveillance2008,6:1-8.
4. Chretien JP, Tomich NE, Gaydos JC, Kelley PW:Real-Time Public Health Surveillance for Emergency Preparedness.Am J Public Health2009,
99:1360-1363.
5. Buckeridge DL:Outbreak detection through automated surveillance: A review of the determinants of detection.J Biomed Inform2007,
40:370-379.
6. Beaudeau P, Payment P, Bourderont D, Mansotte F, Boudhabay O, Laubies B,
et al:A time series study of anti-diarrheal drug sales and tap-water quality. International Journal of Environmental Health Research1999,9:293-311. 7. McIsaac WJ, Levine N, Goel V:Visits by adults to family physicians for the
common cold.Journal of Family Practice1998,47:366-369.
8. Labrie J:Self-care in the new millennium: American attitudes towards maintaining personal health.Washington, DC, Consumer Health Care Products Association; 2001, Ref Type: Report.
9. Chan EH, Tamblyn R, Buckeridge D:Timeliness of Ambulatory Data for Age-Specific ILI Surveillance.Advances in Disease Surveillance2008,5(1):10, Ref Type: Abstract.
10. Chan E:Evaluating the use of physician billing data for age and setting specific influenza surveillanceMcGill University; Master of Science; 2009. 11. Greene S, Kulldorff M, Huang J, Brand R, Kleinman K, Hsu J,et al:Timely
Detection of Localized Excess Influenza Activity across Multiple Data Streams.Advances in Disease Surveillance2009, Ref Type: Abstract. 12. Bravata DM, McDonald KM, Smith WM, Rydzak C, Szeto H, Buckeridge DL,
et al:Systematic review: Surveillance systems for early detection of bioterrorism-related diseases.Annals of Internal Medicine2004,
140:910-922.
14. Cadieux G, Tamblyn R:Accuracy of Physician Billing Claims for Identifying Acute Respiratory Infections in Primary Care.Health Services Research
2008,43:2223-2238.
15. Regie de l’assurance-maladie du Quebec:Statistiques Annuelles.Regie de l’assurance-maladie du Quebec; 2000, 46-48, Ref Type: Report.
16. Statistics Canada:Annual Demographic Estimates: Canada, Provinces and Territories - 2005-2006. 91-215-XIE.Ottawa, Ontario, Statistics Canada; 2006, 1-45, Ref Type: Report.
17. Canadian Institute for Health Information:Canada’s Health Care Providers, 1997 to 2006, A Reference Guide.Ottawa, Ontario, CIHI; 2008, 1-188, Ref Type: Report.
18. Irwig L, Glasziou PP, Berry G, Chock C, Mock P, Simpson JM:Efficient Study Designs to Assess the Accuracy of Screening-Tests.Am J Epidemiol1994,
140:759-769.
19. Chapman WW, Dowling JN, Wagner MM:Generating a reliable reference standard set for syndromic case classification.Journal of the American Medical Informatics Association2005,12:618-629.
20. Marsden-Haug N, Foster VB, Gould PL, Elbert E, Wang HL, Pavlin JA: Code-based syndromic surveillance for influenzalike illness by international classification of diseases, ninth revision.Emerg Infect Dis2007,13:207-216. 21. Chapman WW, Dowling JN, Baer A, Buckeridge DL, Cochrane D,
Conway MA,et al:Developing syndrome definitions based on consensus and current use.Journal of the American Medical Informatics Association
2010,17:595-601.
22. Eguale T, Tamblyn R, Winslade N, Buckeridge D:Detection of Adverse Drug Events and Other Treatment Outcomes Using an Electronic Prescribing System.Drug Saf2008,31:1005-1016.
23. Begg CB, Greenes RA:Assessment of Diagnostic-Tests When Disease Verification Is Subject to Selection Bias.Biometrics1983,39:207-215. 24. Kelly H, Bull A, Russo P, McBryde ES:Estimating sensitivity and specificity
from positive predictive value, negative predictive value and prevalence: application to surveillance systems for hospital-acquired infections. J Hosp Infect2008,69:164-168.
25. Betancourt JA, Hakre S, Polyak CS, Pavlin JA:Evaluation of ICD-9 codes for syndromic surveillance in the electronic surveillance system for the early notification of community-based epidemics.Mil Med2007,172:346-352. 26. Espino JU, Wagner MM:Accuracy of ICD-9-coded chief complaints and
diagnoses for the detection of acute respiratory illness.Proceedings of the AMIA Symposium2001, 164-168.
27. Grava-Gubins I, Scott S:Effects of various methodologic strategies Survey response rates among Canadian physicians and physicians-in-training. Canadian Family Physician2008,54:1424-1430.
28. Sullivan P, Buske L:Results from CMA’s huge 1998 physician survey point to a dispirited profession.Can Med Assoc J1998,159:525-528.
29. Willke RJ:Practice Mobility Among Young Physicians.Medical Care1991,
29:977-988.
30. Royal College of Physicians and Surgeons of Canada:National Physician Survey Primer, October 2009: Generational Differences.2009, 1-3, Ref Type: Report.
Pre-publication history
The pre-publication history for this paper can be accessed here: http://www.biomedcentral.com/1471-2458/11/17/prepub
doi:10.1186/1471-2458-11-17
Cite this article as:Cadieuxet al.:Accuracy of syndrome definitions
based on diagnoses in physician claims.BMC Public Health201111:17.
Submit your next manuscript to BioMed Central and take full advantage of:
• Convenient online submission
• Thorough peer review
• No space constraints or color figure charges
• Immediate publication on acceptance
• Inclusion in PubMed, CAS, Scopus and Google Scholar
• Research which is freely available for redistribution
![Comparative Analysis of Techincal Efficiency of Semi Organic and Conventional Rice Farming in Bogor [Case in Situ Gede and Sindang Barang Villages].](data:image/gif;base64,R0lGODlhAQABAIAAAP///wAAACH5BAEAAAAALAAAAAABAAEAAAICRAEAOw==)