MULTI FACTOR EXPLANATION TO IPO LONG RUN UNDERPERFORMANCE ANOMALY: SRI LANKAN EVIDENCE
T.C Ediriwickrama A.A Azeez
University of Colombo, Sri Lanka
Abstract:
This paper focuses on IPO long run underperformance anomaly and the application of calendar time techniques to dissect anomalous behavior of IPO stocks. More specifically this paper will provide fresh evidence on how multi factor models work on a specific type of security (IPO stocks in this scenario) in an emerging market like Sri Lanka. It is analyzed IPOs over a period from 2000 to 2012 on Colombo Stock Exchange (CSE). Main finding of the study is that traditional market beta still remains strong despite the employment of latest multi factor models.
1. INTRODUCTION
Capital market plays an important role in the modern economy of any country, hence the economic development of the country. Colombo Stock Exchange (CSE) which was founded in 1896 as Colombo Share Brokers Association under the British rule significantly contributes to the
development of Sri Lanka’s capital market. Given the context that country’s bond market was not much active, equity market through CSE
acted as the principal platform for public and private firms to participate in capital market activities over past few decades. However performance of the equity market became highly volatile due to number of macroeconomic factors and most noteworthy one out of them was three decade long ethnic conflict. Even though Government of Sri Lanka (GOSL) defeated Liberation Tigers of Tamil Ealam (LTTE) in 2009, more sustainable peace is yet to be achieved in the island. Initial Public Offerings (IPOs) emerged as fastest and easiest mechanism for both foreign and local investors to participate in the growing Sri Lankan capital market. However IPO related anomalies, mainly initial under-pricing and long run underperformance appeared in big time to frustrate ordinary investors in such scenarios as anywhere in the world. Even though watch dogs of the Sri Lankan capital market, Securities and Exchange Commission of Sri Lanka (SECSL) and Colombo Stock Exchange (CSE) issued timely directives, it is difficult to control these anomalies 100% to pass the benefit to ordinary investors. This study focuses on long run underperformance anomaly. Peter (2007) analysed this situation in Sri Lankan context with event study approach and identified the requirement of better measures to control this long run anomaly. So this paper intends to search the application of calendar time techniques to sample of Sri Lankan IPOs from year 2000 to 2012. This study will cover only calendar time techniques and intends to find out what is the best factor model for IPO stocks in an emerging market like Sri Lanka. Study findings indicate that market beta is still powerful for IPO stocks in CSE. Section 2 of the paper describes the prior literature related to the study and sections 3 and 4 discuss data and methodology used in the paper respectively. Finally section 5 discusses the results before the conclusion.
2. LITERATURE REVIEW 2.1 Past studies on IPO anomalies
IPO long run underperformance is known as subsequent step of under-pricing anomaly. Ritter (1991) documented this first time using US data. Then many supporting studies emerged from various markets including developed and emerging economies. Brown (1999) for UK and Bossin and Sentis (2012) for France are few examples for IPO underperformance in developed markets. Peter (2007) found similar evidence on CSE where negative performance in IPO share price is
reported in third year from the listing. However first two years’ IPO share
price performance is positive in Sri Lankan context according to Peter (2007).
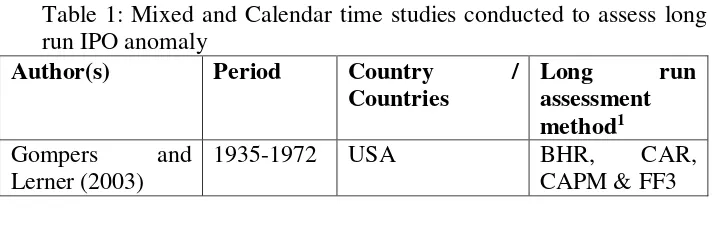
There are two broad approaches in measuring long run IPO returns which are event study approach and calendar time approach. Main methods under event study approach are Cumulative Abnormal Return (CAR) method and Buy and Hold Abnormal Return (BHAR) method. Most of the studies have followed event study approach and few can be mentioned here as evidence. Leleux (1993) and Levis (1993) are good examples for CAR approach and Stehle, Ehrhardt and Przyborowsky (1999); Brau, Couch and Sutton (2012) have followed BHAR method. Calendar time approach uses mainly single factor and multi factor models to assess the IPO long run performance. However there is less number of studies reported under this paradigm compared to event study approach. Further there is a third approach called mixed approach which uses both event study and calendar time techniques. In this approach widely used technique was Fama and French three factor model (FF3) which will be discussed in detail later. However now there are more advanced multifactor models augmented other factors such as momentum, liquidity, profitability and investment capability. Some of the calendar time and mixed approach IPO studies are mentioned in table 1.
Table 1: Mixed and Calendar time studies conducted to assess long run IPO anomaly
Author(s) Period Country /
Countries
Long run
assessment method1
Gompers and Lerner (2003)
1935-1972 USA BHR, CAR,
CAPM & FF3
De silva Rosa, Velayuthen & Walter (2003)
1991-1999 Australia BHR, WR & FF3
Boabang (2005) 1990-2000 Canada CAR & FF3 Ahmad-Zaluki,
Liu, Uchida & Gao (2012)
Source: Perera and Kulendran (2013)
2.2 MULTIFACTOR MODELS AND IPO ANOMALY
and it got the crown from CAPM in the world of calendar time techniques. Later many scholars added different factors and tested it with different securities in different markets. This paper focus on how multi factor models work with IPO stocks in an emerging market like Sri Lanka. However still there is no universally accepted model in empirical asset pricing.
First it should be asked whether Sri Lankan market is an emerging capital market or not. Li and Toll (2011) generally defines emerging market is an economy that in the process of growth and industrialization. They further elaborate that emerging economies are not countries troubled by non-functioning capital markets but at the same time they are not fully efficient developed markets. So Sri Lanka roughly can be defined as an emerging market according to the GDP growth rate (7.3% in 2013) published by Central Bank of Sri Lanka (CBSL). Then why is it IPO stocks? IPO stocks are generally new businesses to the market with higher growth as well as higher risk as per Ritter (1991). So it is interesting to see how IPO stocks in emerging Sri Lankan market respond to the multi factor models. As per the best of knowledge of authors, it provides fresh insights to the Sri Lankan capital market where no one have explored earlier. This study is different from Randeniya and Wijerathna (2012), since this study tests IPO stocks specifically unlike the earlier.
As summarized above, multifactor models have evolved from
1960’s to the present and it is difficult to test each and every model. So purpose of this study it is selected below versions of single factor and multifactor models in the context of Sri Lankan IPOs.
Table2: Six models used for the assessment
Model Original Authors and Year
Sharpe-Lintner CAPM (Basic
CAPM)
Sharpe (1964), Lintner (1965)
Zero Beta CAPM (ZCAPM) Black, Jensen and Scholes (1972)
Fama & French 3 factor model
(FF3 model)
Fama & French (1992, 1993,
1996)
Carhart’s 4 Factor model (C4F
model)
Jagadeesh & Titman (1993),
Carhart (1997)
3 Factor model augmented by
liquidity (3FL model)
Acharya & Pederson (2005)
Fama & French 5 factor model
(FF5 model)
Fama & French (2014)
Source: Authors’ construction
3. DATA
The data used in this study consist of 51 initial public offerings issued in CSE between 2000 and 2012. The data are collected from variety of sources. The issue dates and offering prices of IPOs are taken from CSE web site and listing prospectuses. Monthly stock prices are taken from CSE and adjusted by authors to dividends and other corporate actions. All Share Price Index (ASPI) data are taken as market index and obtained from CSE.
It is employed six models described in table 2 to adjust long run IPO returns for the level of systematic risk as well as the factors such as size, book to market, momentum, liquidity, profitability and investments. Factor data mainly obtained from individual company annual reports and CSE web site. Annual average gold prices are required to estimate uncorrelated portfolio to the market portfolio in zero beta CAPM and it is obtained from www.kitco.com. Risk free rate is taken as 3 month Treasury bill rate published by Central Bank of Sri Lanka (CBSL).
4. METHODOLOGY
4.1 Sharpe-Lintner CAPM (Basic CAPM)
A CAPM describes the relationship between risk and expected return and that is used in the pricing of risky securities. Gompers and Lerner (2003) used CAPM to evaluate IPO long run performance. This is calculated by taking a risk measure (beta) that compares the returns of the asset to the market over a period of time and to the market premium (Rm-Rf). CAPM is calculated as follows.
pt
R -Rft = α + β (Rmt-Rft) + ἐ (1)
Where Rpt denotes the monthly return of IPO portfolio at time t, Rftis the
risk free return at time t and Rmt is the monthly return of ASPI at time t. ἐ denotes random error term.
4.2 Zero Beta CAPM (ZCAPM)
debentures rates etc… Authors preferred to use gold prices as the
uncorrelated portfolio for this study.
pt
R - Rzt = α + β (Rmt-Rzt) + ἐ (2)
Where Rzt denotes the rate of change of gold prices for period t and others are same as equation (1).
4.3 Fama and French three factor model (FF3 model)
The Fama and French three factor model (FF3) is an extension of the original CAPM style approach. Gompers and Lerner (2003) is one of the early studies which used FF3 to assess IPO long run performance. FF3 model can be written as:
pt
R -Rft = α + β (Rmt-Rft) + s SMBt + h HMLt + ἐ (3)
Where SMBt denotes the return difference between small and big stocks for period t, HMLtdenotes the return difference between high book to market firms and low book to market firms for period t. Others remain the same as in equation 1.
SMBt (small minus big) is the average return on the three small portfolios minus the average return on three big portfolios for period t.
SMBt = 1/3 (small value + small neutral + small growth) – 1/3 (big
value + big neutral + Big growth) (4)
HMLt (high minus low) is the average return on two value portfolios minus the average return on the two growth portfolios for period t.
HMLt = 1/2 (small value + big value) – 1/2 (small growth + big growth) (5)
4.4 Carhart Four factor model (C4F model)
Carhart (1997) developed a further extension to FF3 model by adding the momentum factor (winners minus losers – WML) and it is known as four factor model. Eckbo and Norli (2005) added momentum to their study of IPO long run price performance. Four factor model is stated below.
pt
R -Rft = α + β (Rmt-Rft) + s SMBt + h HMLt + w WMLt + ἐ (6)
Where WMLt is the return difference between winner and loser stock portfolios for period t. WMLt is estimated as follows.
4.5. Three factor model augmented by liquidity factor (3FL model)
Another factor to be added to FF3 is liquidity. But here it becomes more complex since stock market liquidity has many facets. Some of them are monthly trading volume, turnover rate, average ratio of daily absolute return and monthly proportion of zero returns. Authors of this study selected only turnover rate as liquidity measure and it is calculated as follows.
Turnover rate = Monthly trading volume / number of shares outstanding (8)
Acharya and Pederson (2005) as well as Chan and Faff (2005) pioneered this model as a multi factor model with a liquidity premium and it is shown below. In simply liquidity premium, LMH (low liquidity minus high liquidity) substituted as the fourth factor. Ramlee and Ali (2012) used three factor model augmented by liquidity to analyze long run returns of IPO stocks in Malaysian context. LMHtis calculated as follows.
pt
R -Rft = α + β (Rmt-Rft) + s SMBt + h HMLt + l LMHt + ἐ (9)
Where, LMHt is the return difference between low liquid portfolios and high liquid portfolios for period t.
LMHt = 1/2 (Small high liquid stocks + big high liquid stocks) – 1/2 (Small low liquid stocks + big low liquid stocks) (10)
4.6 Fama and French five factor model (FF5 model)
Fama and French (2014) added two more factors to their FF3 model and expect it provides better explanation to average long run returns. Two new factors represent profitability and investment capability. The new five factor model can be explained by below equation.
pt
R -Rft = α + β (Rmt-Rft) + s SMBt+ h HMLt + r RMWt + c CMAt +
ἐ (11)
The method of calculating SMB in FF5 is different than method of calculating SMB in FF3. It is as follows.
SMBt = 1/3 (SMB B/M + SMB OP + SMB INV) (12)
RMWt (Robust minus Weak) is the factor to represent profitability and it is calculated as follows. It is the return difference between robust profitability stock portfolios and weak profitability stock portfolios for period t.
CMAt (Conservative minus Aggressive) is the factor to represent investment capability and method of calculating is given below. It is the return difference between low investment and high investment portfolios for period t.
CMAt = 1/2 (Small Conservative + Big Conservative) – 1/2 (Small
Aggressive + Big Aggressive) (14)
However it should be noted that five factor model has not tested for IPO stocks in any market yet up to the best of knowledge by authors. Ordinary least square (OLS) regressions will be conducted for all six models on both value weighted and equal weighted basis.
5. RESULTS AND ANALYSIS 5.1 Descriptive statistics
Descriptive statistics of the variables of discussed models are given below.
Table 3: Descriptive statistics
Variable Mean Median Maximum Minimum Standard
Deviation
p
R (Value weighted)
-0.000
0.006 0.037 -0.049 0.026
p
R (Equal
weighted)
0.003 0.001 0.066 -0.057 0.036
m
R (Value weighted)
0.018 0.019 0.055 -0.025 0.023
m
R (Equal weighted)
0.042 0.028 0.259 -0.027 0.074
f
R 0.116 0.100 0.213 0.072 0.046
z
R 0.157 0.143 0.357 0.001 0.106
SMB (FF3) 0.001 -0.001 0.045 -0.067 0.030 SMB (FF5) 0.025 0.007 0.287 -0.025 0.081
HML 0.001 0.006 0.048 -0.066 0.031
WML 0.085 0.057 0.414 -0.004 0.104
LMH 0.020 0.017 0.106 -0.024 0.033
RMW 0.014 0.007 0.129 -0.043 0.039
CMA 0.003 0.006 0.046 -0.055 0.026
5.1 Results on value weighted basis
OLS regression results of all six models are given in below table 4. It is computed on value weighted basis.
Table 4: Value weighted calendar time portfolio regressions
CAPM ZCAPM FF3
Source: Authors’ construction using E-views 6.0 software
Note 1: Comments marked with *, ** and *** indicate significance at 10%, 5% and 1% level. Note 2: t statistics are reported in parentheses.
significant at 1% level in all 6 value weighted models. None of the additional factors are statistically significant. However F statistic remains significant at 1% level in all cases indicating all factors are jointly explaining the variation of IPO stock returns. Adjusted R2is above 87% for all six value weighted models indicating that it is an adequate estimation of IPO stock return variation in studied period.
5.2 Results on equal weighted basis
OLS regression results on equal weighted basis are given in table 5.
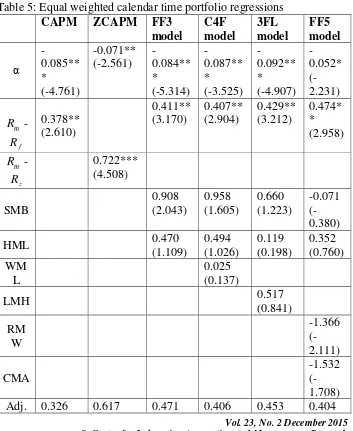
Table 5: Equal weighted calendar time portfolio regressions
R2 F-stat.
6.81** 20.326** *
4.56** 3.05* 3.49* 2.63
Source: Authors’ construction using E-views 6.0 software
Note 1: Comments marked with *, ** and *** indicate significance at 10%, 5% and 1% level. Note 2: t statistics are reported in parentheses.
Equal weighted IPO portfolios in all 6 models are underperforming in the period of 2000 to 2012. However unlike value weighted scenario, there is a varying degree of statistical significance among 6 models. 4 models are statistically significant at 1% level (CAPM, FF3, C4F and 3FL) and ZCAPM and FF5 are statistically significant at 5% and 10% respectively. Similar to value weighted scenario, traditional market beta remain statistically significant in all equal weighted cases. However it is different from value weighted scenario, factor loadings are below 0.5 in 5 equal weighted models out of 6. Further other factors are not statistically significant. F statistic is also significant at varying degrees. For an example ZCAPM is significant at 1% level, CAPM and FF3 are at 5% level and C4F and 3FL are at 10% level. F statistic of FF5 is insignificant. Adjusted R2is below 50% except ZCAPM and it indicates that equal weighted models are poor approximations of IPO return variation unlike value weighted models.
6. CONCLUSION
This paper analyses long run IPO underperformance anomaly with calendar time techniques from year 2000 to 2012. More specific purpose of this study is to find out which factor models explain the return variation of IPO stocks in an emerging market like Sri Lanka. As a summary, market beta remains significant in all 6 models and IPO stock portfolio underperforms in all value weighted scenarios. Even though additional factors remain insignificant, F statistic is significant in all value weighted models. So it can be said that these factors are jointly explaining the variation of IPO stock returns in value weighted models. However equal weighted scenarios were proved to be poor approximations while value weighted scenarios are more suitable for performance evaluation purposes in consistent with the Fama (1998).
REFERENCES
1. Acharya, V.V and Pederson, L.H. (2005). Asset pricing with liquidity risk. Journal of Financial Economics. 77 (2), pp375-410.
2. Black, F., Jensen, M.C. and Scholes, M (1972). The capital asset pricing model: Some empirical tests. Newyork: Praeger Publishers. pp 79-121.
3. Boissin, R and Sentis, P. (2012). Long run performance of IPOs and the role of financial analysts: Some French evidence. The European Journal of Finance. pp 1-25.
4. Brau, J.C., Couch,R.B and Sutton, N.K. (2012). The desire to acquire and IPO long run underperformance. Journal of Financial and Quantitative Analysis. 47, pp 493-510.
5. Brown, E. (1999). Long run performance analysis of new
sample of UK IPOs . Available:
http://www.econ.ed.ac.uk/papers/ipo.pdf. Last accessed 26th April 2015
6. Carhart, M.M. (1997). On persistence in mutual fund performance. The Journal of Finance. 52, pp 57-82.
7. Chan,H.W and Faff, R.W. (2005). Asset pricing and illiquidity premium. The Financial Review. 40 (4), pp 429-458.
8. Daniel, K., Titman,S. and Wei, K,C,J. (2001). Explaining the cross section of stock returns in Japan? Factors or characteristics. The Journal of Finance. LVI (2), pp 743-766. 9. Eckbo, B.E and Norli, O. (2005). Liquidity risk, leverage and
long run IPO returns . Journal of Corporate Finance. 11 (1 and 2), pp 1-35.
10. Fama, E.F and French, K.R. (1992). The cross section of expected stock returns. The Journal of Finance. XLVII (2), pp 427-465.
11. Fama, E.F and French, K.R. (1993). Common risk factors in stock and bond returns. Journal of Finance. 33, pp 3-56. 12. Fama, E.F and French, K.R. (1996). Multifactor explanations
of asset pricing anomalies. The Journal of Finance. 51 (1), pp 55-84.
13. Fama, E.F and French, K.R. (2014). A five factor asset pricing model.Available:
14. Fama, E.F,. (1998). Market efficiency, long term returns and behavioral finance. Journal of Financial Economics. 49, pp 283-306.
15. Gompers, P.A and Lerner, J. (2003). The really long run performance of initial public offerings: The pre NASDAQ evidence. The Journal of Finance. 58 (4), pp 1355-1392. 16. Griffin, J.M.. (2002). Are the Fama and French factors global
or country specific?. The Review of Financial Studies. 15 (0), pp 783-803.
17. Jegadeesh, N and Titman, S. (1993). Returns to buying winners and selling losers: Implications for stock market efficiency. The Journal of Finance. 48 (1), pp 65-91.
18. Leleux, B. (1993). Post IPO performance: A French appraisal. Finance. 14, pp 79-106.
19. Levis, M. (1993). The long run performance of initial public offerings: The UK experience 1980-1988. Financial Management. 22 (1), pp 28-41.
20. Li, J. and Toll, G. (2011). Price and earnings momentum in emerging markets. Masters Thesis, Stockholm School of Economics.
21. Lintner, J. (1965). Security prices, risk and maximal gains from diversification. The Journal of Finance. 20, pp 587-615 22. Marcelo,J.L.M., Quiros, M.D.M.M. and Oliveira,C..
(2011). Asset pricing and liquidity. Available: http://repositorio.ipl.pt/bitstream/10400.21/1427/1/31.pdf. Last accessed 26th April 2015.
23. Markowitz, H. (1952). Portfolio selection, The Journal of Finance, 7, pp77-91
24. Perera, W and Kulendran, N. (2013). Evaluation of short run market performance and its determinants using binary models: Evidence from Australian IPOs. in University of Sri Jayewardenepura: Proceedings of the 10th International Conference on Business Management (ICBM), ed., Colombo, Sri Lanka, pp 302-329.
25. Peter, S. (2007). Performance of initial public offerings and privatized offers: Evidence from a developing country. Managerial Finance. 33 (10), pp 798-809.
27. Randeniya, R. and Wijerathna, J.K (2012). The application of Fama and French factor model for the Sri Lankan stock market. In University of Colombo. Proceedings of Annual research symposium 2012, Colombo, Sri Lanka.
28. Ritter, J.R. (1991). The long run performance of initial public offerings. The Journal of Finance. 46 (1), pp 3-27.
29. Sharpe, W.F,. (1964). Capital asset prices: A theory of market equilibrium under conditions of risk. The Journal of Finance. 19, pp 425-442.
30. Stehle, R., Ehrhardt, O. and Przyborowsky, R. (1999). Long run stock performance of German initial public offerings and
seasoned equity