STUDIES PART 1
March 2004
– Ein Initiativprojekt der Kulturstiftung des Bundes in Kooperation mit dem Projektbüro Philipp Oswalt, der Galerie für Zeitgenössische Kunst Leipzig, der Stiftung Bauhaus Dessau und der Zeitschrift archplus.
Philipp Misselwitz
6 STATISTICAL DATA: MANCHESTER / LIVERPOOL
Ed Ferrari, Anke Hagemann, Peter Lee, Nora Müller and Jonathan Roberts
M62 REGION
12 ABANDONMENT AS OPPORTUNITY
Katherine Mumford and Anne Power
17 CHANGING HOUSING MARKETS AND URBAN REGENERATION:
THE CASE OF THE M62 CORRIDOR
Brendan Nevin, Peter Lee, Lisa Goodson, Alan Murie, Jenny Phillimore and Jonathan Roberts
22 CHANGING EMPLOYMENT GEOGRAPHY IN ENGLAND’S NORTH WEST
Cecilia Wong, Mark Baker and Nick Gallent
MANCHESTER
32 MANCHESTER CITY PROFILE
Phil Misselwitz
35 TIMELINE: MANCHESTER 1750—2002
Alan Kidd
40 REGROWTH OF A SHRINKING CITY
Ed Ferrari and Jonathan Roberts
52 MANCHESTER: A BRIEF ECONOMIC HISTORY
Alan Kidd
65 MANCHESTER IN PROSPECT
Alan Kidd
75 HYPOCRITICAL CITY: CYCLES OF URBAN EXCLUSION
Rosemary Mellor
90 MANCHESTER ENGLAND
Dave Haslam
94 LOCAL MUSIC POLICIES WITHIN A GLOBAL MUSIC INDUSTRY: CULTURAL
Phil Misselwitz
118 TIMELINE: LIVERPOOL 1699—2004
Jon Murden
130 LIVERPOOL — CHANGING URBAN FORM
Ed Ferrari and Jonathan Roberts
137 HISTORY BROKE LIVERPOOL, AND IT BROKE MY HEART
Linda Grant
140 URBAN REGENERATION, POLITICS AND SOCIAL COHESION:
THE LIVERPOOL CASE Richard Meegan
163 PORT STATISTICS
Patrick Keiller
168 ADDRESSES AND CONTACTS
170 BIBLIOGRAPHY
173 AUTHORS
175 COLOPHON
APPENDIX: MAP OF THE M62 REGION AND PHOTOGRAPHS MANCHESTER / LIVERPOOL
---Manchester and Liverpool lie in the North-West of England, barely 35 miles apart. Both cities have been pioneering cities, epitomising the beginning of the industrial age. In the 1930s, the population of both cities peaked at just under 900,000 inhabitants, and each lost around half of its population when deindustrialisation led to a process of relentless decline. Manchester and Liverpool, earlier than other cities in the world, had to struggle and, to some extent, succeeded in shaking off the image of decay. After a period of urban renewal in the 1990s, today both cities share a sense of new optimism.
Despite these similarities, the relationship between the two cities is complex. Manchester and Liverpool’s bitter rivalry extends to their football teams, music, cultural institutions and obtaining funds from the European Union, the Central Government or the Lottery. To a large extent, this antagonism is rooted in century-long differences in economy, social constitution and urban culture, despite the fact that they were famously linked by the first passenger railway in the world: Manchester being a logistical centre for cotton and textile industries while Liverpool’s growth was mostly generated by the power of its docks and global trade connections.The inherent difference between the two cities can be seen in the way issues of decline and regeneration have been approached. The following selec-tion of articles will explore the various manifestaselec-tions of growth or shrinkage in both cities. Far from providing a comprehensive or complete picture, they focus on particular aspects and provide individual insights into the reality of the post-industrial city and there-fore reflect the overall research approach of the Shrinking Citiesproject.
For Liverpool, the acclaimed Liverpool-born writer and journalist Linda Grant will give a personal account of a life intimately intertwined with the changing fortunes of the city, while Jon Murden provides a more general chronology of key events in the city’s more recent history.The sociologist Richard Meegan analyses the complex role of the Liverpool municipality during the period of decline and renewal — focusing in particular on the period in the 1980s when the local Council went into almost militant opposition to the Thatcherite neo-liberal experiment, which left the city in a state of abandonment and free fall. Meegan also shows how, in recent years, Liverpool has begun to catch up and opti-mism has been greatly boosted by its recent successful bid to become Europe’s Cultural Capital in 2008. In a series of provocative statistics, the writer and film-maker Patrick Keiller will explore the current position of the docks without dockers: handling more tonnage than ever before, today, the docks employ a mere 800 people and embody the successes and failures of new ‘jobless growth’ in post-industrial cities.
urban conditions of shrinkage helped to generate a period of unique and unprecedented cultural production in the field of popular music, visual arts and architecture, which are widely admired and even copied. But the contributions of this working paper look beyond these important — yet at times romanticised models — towards the polarised urban reality of the beginning post-renewal period, characterised by the simultaneity of growth and ongoing deprivation, illustrated well by a detailed analysis of most recent trends and statistical data compiled by Ed Ferrari and Jonathan Roberts, that continues to provide challenges for both cities. A specific section of this publication is devoted to research beyond both cities.The acclaimed scholars Anne Power and Katherine Mumford (London School of Economics) question in their contribution the traditional planning methods such as tabula rasademolition of deprived wards, arguing that neighbourhoods of acute decline may become the urban centres of tomorrow. Cecilia Wong, Mark Baker and Nick Gallent of the University of Liverpoolspeculates on the future of employment in the region and CURS (Centre for Urban and Regional Studies of the University of Birmingham) contributed an edited version of its recent M62 (authors: Brendan Nevin, Peter Lee, Lisa Goodson, Alan Murie, Jenny Phillimore and Jonathan Roberts), report, which argues for greater co-operation between the two rivalling cities, whose future depends on their co-operation as two centres within one urban region.
Philipp Misselwitz
---STATISTICAL DATA: MANCHESTER / LIVERPOOL
Statistics: Anke Hagemann, Nora Müller (Shrinking Cities, Office Philipp Oswalt)
Data Research: Ed Ferrari, Jonathan Roberts, Peter Lee (Center for Urban and Regional Studies,Birmingham University)
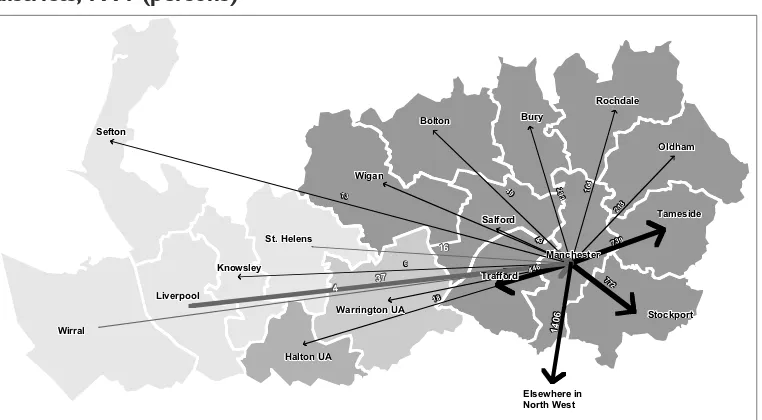
---REGION AND CITIES
The Region
4,184,700* inh. (2002), -3.7% (1981–2001)
The Manchester-Liverpool region that we define as our research area is a part of the North West region. It contains the metropolitan counties of Merseyside (including five districts) and Greater Manchester (including ten districts) plus two districts of the county of Cheshire (Halton and Warrington). This Area covers the urban agglomeration of the two cities and the densely populated zone in between (also refered to as the M62 corridor).
City and Suburbs
Liverpool and suburbs: Liverpool + Knowsley + Sefton, 872,900* inh. (2001), -9.2% (1981–2001)
Manchester and suburbs: Manchester, Bury, Oldham, Rochdale, Tameside, Stockport, Trafford, Salford, 1,919,900* inh. (2001), -3.3% (1981–2001)
The Cities of Liverpool and Manchester, especially Manchester, remained in very tight administrative borders, while the urban sprawl was expanding and small peripheral towns were becoming part of the suburban city. To cover the entire city, including suburbs, one should refer to the cities plus surrounding districts. We refer to the administrative city boundaries (districts of Manchester and Liverpool) in most cases, as this gives the most impressive image of shrinkage for the cities — and the highest contrast to other (growing) districts.
City of Liverpool, 441,500* inh. (2002), -11.6% (1981–2001)
City of Manchester, 422,300* inh. (2002), -9.1% (1981–2001)
* Population figures for 2001 and 2002 are revised on the basis of outcomes from the 'Manchester matching exercise' which aimed to improve population estimates in the light of Manchester City Council's challenge to the Censusauthorities.
Wigan
Bolton
Salford Man-chester
Trafford
Stockport Tameside
Oldham Rochdale Bury
Sefton
Wirral
Liverpool Knowsley
St Helens
Warrington
Halton
Greater Manchester Merseyside
The North West
INTERNATIONAL COMPARISON
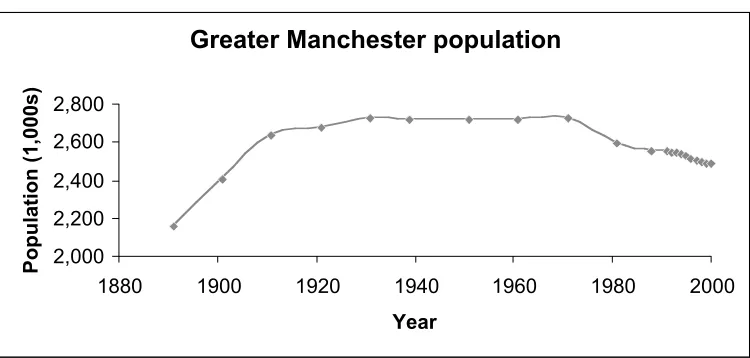
01 population development in 4 investigated cities
03 monthly average income per capita in the 4 locations
[NB: average incomes are defined differently, cf. notes]
05 unemployment rates, international comparison (2000/2001)
[NB: unemployment is defined differently, cf. notes]
07 estimated vacancy rates in housing, international comparison
UNEMPLOYMENT
---02 population development in the cities and agglomerations of Manchester and Liverpool
04 annual average income per capita in the cities and region, compared to national average, 2001
06 development of unemployment rates in Liverpool and Great Britain
09 employment by industries; Liverpool 1996, 2001
11 total numbers of unemployed in Manchester and Liverpool 1960—2000
13 population development in Liverpool and the surrounding districts*, 1931—1991
*Wirral, Sefton, Knowsley, St Helens, Halton
15 development of total properties in housing and the share of vacancy, 1981, 1991, 2002
10 foreign and domestic port traffic 1965—2002
12 share of benefit recipients in the cities and region, 2000
14 Manchester and its surrounding disticts*, 1931—1991
*Salford, Trafford, Bury, Rochdale, Oldham, Tameside, Stockport
---ABBREVIATIONS:
Det – Detroit, US – United States, Liv – Liverpool, Man – Manchester, GB – Great Britain, Hal – Halle, Lei - Leipzig, D– Germany, Iva – Ivanovo, RU – Russia, Reg – region
---NOTES:
03 Definitions of average income:US:Total income for a defined geographic unit divided by the total population. Income is defined as: total money income of persons 15 years and over. Potential sources: wage or salary; selfemployment income; interest, dividend, net rental or royalty income; Social Security or rail road retirement income; public assistance or welfare; retirement or disability income.GB:Income data are only available for households--the data have been modeled to per capita values by applying a persons: house hold ratio for each district.D:The average monthly net income includes salaries and wages, self-employment income, pensions, public assistance, rents/tenures; not included are farmers and persons without any income (such as children).RU:Total income of the total population (pensions, salaries/wages, grants, child benefits, interest incomes, rents); income from informal or illegal work is not included; children and pensioners are included
05 Detroit/U.S.: 2000; Ivanovo/RU: 2000; Halle/D: 2001; Liverpool/GB: 2001
Definitions of unemployment:US: Civilians 16 years and over are classified as unemployed if they 1) were neither “at work“ nor “with a job but not at work“ during the reference week, and 2) were look-ing for work durlook-ing the last four weeks, and 3) were available to accept a job. Also included as unem-ployed are civilians who did not work at all during the reference week and were waiting to be called back to a job from which they had been laid off.D:Unemployed is someone, who 1) has no employ-ment or less than 15h per week, 2) is looking for employemploy-ment, liable for insurance deductions and over 15h per week, that means who is making an effort to find a job and who is available for the services of the employment office. Not included are persons, who a) are employed for more than 15h per week, b) are not allowed orn are unable to work, c) are restricting their availability for no reason, d) are older than 65, e) are presently beneficiaries in employment measures.GB:Nomis-defintion: monthly adminis-trative count of unemployed claimants--this is different from the ILO (International Labour Organization) definition, which estimates all jobless people who want to work, are available to work, and are actively seeking employment.The claimant count measures only those people who are claiming unemployment-related benefits (Jobseeker’s Allowance).This is always a lower measure because some unemployed people are not entitled to or choose not claim benefits.RU:There are two differing figures: 1) collected by a method based on monitoring/estimations, similar to the ILO method. 2) registered: people who claim unemployment benefit, which is not worth the effort.
13, 14 Adjustments made as far as possible to account for local government reorganisation in 1974
---SOURCES:
01 U.S. Census Bureau, Census Reports for GB and Greater Manchester, Statistisches Jahrbuch Leipzig, Institut für Länderkunde (IfL) Leipzig / Datenbank „Städte Russlands”
02 Liverpool Trade Directory, 1801-1951 & U.K. Census, 1801-2001; Census Reports for Great Britain and Greater Manchester Part 1 Volume 1 and Annual Abstract of Statistics 1997
03 U.S. Census Bureau; CACI Ltd, Center for Urban and Regional Studies (CURS), Birmingham University; Statistisches Landesamt Sachsen; Goskomstat (Staatliches Komitee für Statistik), Moskau; Goskomstat, Ivanovo
04 CACI Ltd
05 Fischer Weltalmanach 2003; U.S. Census Bureau; NOMIS (GB, Employment Department Group’s on-line information system); Amt für Statistik und Wahlen Leipzig; Goskomstat, Moskau; Goskomstat, Ivanovo
06 Department of Employment Gazette
07 Stadt Halle, Wohnungsmarktbericht 2003; Center for Urban and Regional Studies (CURS), Birmingham University; Center for Urban Studies, Wayne State University
08 CURS, Birmingham University
09 annual labour force survey – ONS Crown Copyright Reserved [from Nomis on 4 February 2004] 10 CURS, Birmingham University
---ABANDONMENT AS OPPORTUNITY
Katherine Mumford and Anne Power
---Around 3,000 neighbourhoods in urban areas all over the country are difficult to live in and difficult to rescue. The overwhelming majority of the most difficult neighbourhoods are in towns and cities, so that neighbourhood-based social exclusion, seen as the con-centration of multiple problems in particularly disadvantaged areas, is primarily an urban phenomenon (SEU, 1998). Many of the most severely problematic pockets are in large council estates, which are also disproportionately concentrated in cities. But even the most prosperous and successful places have their small problematic neighbourhoods. People with choice, money, jobs, know-how and energy try to move out of such difficult areas. Even in London, many families in low-income neighbourhoods want to leave their current homes for somewhere better (Mumford and Power, 2003)1.There are many
long-run drivers of this wider collapse in confidence. But two historical factors underlie aban-donment: outward sprawl and deindustrialisation.
---WHY ARE INNER NEIGHBOURHOODS BEING ABANDONED?
As the first country in the world to become overwhelmingly urban — 90% by 1900 — and industrial — only 2% of the workforce in agriculture by 1900 — our cities paid a very heavy price for the huge wealth and international status that Britain acquired.The political consensus was to lead people out of them. Major efforts to tackle housing problems and slum conditions were driven over the following 100 years by the idea that crowded and impoverished masses should be moved out of the city to new green field, suburban hous-ing — council-owned as well as private.The famous World War One slogan ”Homes Fit for Heroes” led eventually to a blunt and vast slum clearance programme targeting all inner cities across the country in an attempt to create space for better housing within as well as beyond city boundaries. The promotional poster for the ‘Homes’ campaign showed a soldier pointing to the suburban semi as the dream home and spurning the monotonous, soot-blackened terraces of byelaw housing, many of which survive to this day, but which were built in their millions before World War One as an orderly, low-cost remedy for the unsanitary and chaotic slums.Very few challenged the idea of large-scale demolition and exodus until the 1970s, by which time the damage to cities and the communities they housed was immeasurable (Young and Wilmot, 1957)2.
As the earliest industrial economy in the world, our dependence on old-style, heavy man-ufacturing was paramount. With the incremental decline in our factory-based economy from the turn of the 20th century and the virtual collapse of our mainstay heavy indus-tries in the 1970s and 1980s, older urban areas were left high and dry, almost devoid of jobs, incrementally denuded of the more skilled and more ambitious who seized plenti-ful opportunities to carry on moving out (Turok & Edge, 1999). Slum clearance made this economic transformation harder and harsher.The large-scale blight and eradication of old inner areas left cities like Liverpool and Glasgow struggling to recover long after the pop-ulation and jobs had been wiped out (MacLennan, 1997).
of the North and Midlands because here urban conditions were more dominated by dirty industry and the high population density of the industrial workforce.The slum clear-ance and estate building process, on a vast scale in these industrial regions, left some inner neighbourhoods with a third of their former population (Power, 1987).
Thus Manchester and Newcastle, alongside Liverpool, Birmingham and almost all metro-politan areas, possessed by the late 1980s but shadows of their former wealth, popula-tion density and significance.The geographic spread of the conurbapopula-tions was now wider, less concentrated and carved up by major roads. Old docks, monuments to our world pre-eminence in shipping, lay idle in London, Liverpool, Glasgow and Newcastle (Harvey-Jones, 1994). The great rivers of Clyde, Mersey and Tyne were deeply damaged by two centuries of grime and obsolete industrial relics. The first industrial workhouses of the world, along the banks of the Manchester and Birmingham canal networks, were literally falling down or burnt down for insurance gains — a desecrated heritage of irreplaceable value.
It is against this backdrop of economic, social and geographical change that our work is set. The poorest neighbourhoods in our study, experiencing the most acute abandon-ment, are at the most extreme end of this long run and extensive process, which embraced most of the country and certainly affected most cities. The Thames Gateway area, to the East of the City of London, shows signs remarkably similar to the Eastern and Northern areas of Manchester or the East and West Ends of Newcastle, albeit that new opportunities are closer to hand. Industrial closure, high unemployment, low-value hous-ing and even, in places, signs of abandonment are clear (LSE Cities Programme, 2002).This pattern pervades Western European and North American former industrial cities as well as the United Kingdom (Core Cities Conference, 2002).
There is clearly a drastic need for change in direction. As inner neighbourhoods have become too depleted, with too little work, too much poverty, and eventually too few people, social conditions have unravelled. Schools close, buses run less often, shops and banks disappear and criminal networks thrive in the vacuum of left-behind spaces (Home Office, 1999b). The one thing that does not decline is traffic. People who have forsaken the city still use the centre for its amenities and for work. As commuters, they now only drive through the areas they would probably have lived in, in earlier epochs. Congestion and the time involved in commuting are high prices to pay for allowing urban neigh-bourhoods to fall into such decay.
Housing built on the edge of cities, usually on greenfields, provides a popular alternative to city living for those that can afford to buy, but in itself destroys both countryside and inner cities simultaneously. At the most extreme, crude over-building outside cities fuels plummeting demand for lower-value inner neighbourhoods within. This is exactly the process this report documents in the North, where more homes are being built, almost all outside city boundaries, than there are projected households who might form to fill them. The over-supply of homes is a major driver of urban decline and abandonment (UTF, 1999; ODPM, 2002; GONW, 1999; DETR, 1999).
---CITY CENTRES AND SUCCESSFUL INNER NEIGHBOURHOODS
dinner deliveries and all kinds of specialist shops and repair, all help shape the revival of cities as our ”creative nerve centres” (Rogers and Power, 2000).
British central and local governments in the 1980s adopted an innovative partnership approach to transforming the centres of our major cities from industrial relics into high-tech global connectors. Obsolete historical infrastructures were readily, if expensively, converted to new enterprises and housing. Neglected, often disused or underused land-marks, such as canals, theatres, libraries and old transport infrastructures, have become exciting and appealing elements of the new as well as the old eras. As new businesses and new people have been attracted in, so have new values followed. Marketing city centre living has gathered its own steam.
On the back of this rebirth, travelling, foot-loose shoppers from outlying Cumbria and Northumbria chose city centre shopping in Manchester and Newcastle ahead of the giant Trafford or Gateshead Metro shopping malls where the names, styles and atmos-phere are predictable, because people are also looking for ‘street experience’, for unex-pected corners to explore, for recently restored side streets and bars where the ‘city atmosphere’ is a special, if almost forgotten, asset.The interaction of new ‘urban tourists’ and new urban dwellers is restoring the centres of every major city in the country. So can inner city neighbourhoods catch this fever? The new, exciting urban walkway con-necting Manchester’s city centre with the heart of East Manchester 1.5 miles away rein-forces the link between the two.The truth is that the less decayed, more attractive neigh-bourhoods are already improving. Old Victorian or Georgian neighneigh-bourhoods, built for artisans and respectable working families, have often recovered from industrial decay, where the poorest slum areas, housing a mass of casual workers, though upgraded many times over, have generally stayed poor and proved harder to regenerate.
Reputations are very long-lasting (Lupton, 2001). Our cities were long ago sectioned into poorer and richer areas and although people were physically closer together, because cities were denser and less spread out, socially the distance between the poorest areas and the rest of the city was vast. The Booth poverty maps of London at the turn of the century show how concentrated poverty was and how strongly linked to specific areas. These patterns have survived almost intact to this day (Davey Smith et al, 2000; Economist, 2001).
Secondly, new urban residents attracted by such recovering inner neighbourhoods often have civic connections and responsibilities and can lever in better services. Conditions improve, pubs and shops survive and go up-market.The historic, community-forming role of these neighbourhoods survives around the traditional street patterns while the mod-erately high density encourages street activity. These successful inner neighbourhoods have about 50 to 100 homes per hectare, one quarter to one half the density of the typ-ical Victorian slums of East Manchester or Newcastle, but at least double to quadruple the density of modern suburban estates.This gives them a critical mass of people which supports services, making them highly sought after in every city, including the inner areas of Newcastle, Manchester or Glasgow. Fast-reviving inner neighbourhoods are intrinsical-ly attractive urban locations, often near to major parks, close to old universities, on well-established public transport routes, created before the advent of the car.They are urban in the best sense of the word.
All these elements make inner neighbourhoods of ageing but solid structure highly attrac-tive today. They offer all the advantages of city life and though they share many of the problems of other inner city neighbourhoods, particularly crime and poor schools, they have ‘kerb appeal’. They have the major asset of a growing social mixture, which many people seem to prefer to more sterile, single-class suburbs. Notting Hill in London, or Victoria Park in Manchester, or Gosforth in Newcastle epitomise such areas.
Can the historically poorer neighbourhoods that are struggling to survive develop similar assets from a very different base? We would argue that they can.The building of the new Victoria line for the London Undergroundin the 1960s and the lifting of the large demoli-tion plans hanging over much of Islington transformed it from a depopulating, decaying slum into a lively, mixed-tenure, multi-ethnic area. It still has by far the least open space of any London borough, the worst schools and very high crime — serious blights on its community — but it is very popular because of its density, its closeness to the centre, its mixed communities and its terraces! Many argue that Islington is a far cry from North Manchester or inner Newcastle, and this is indisputable. But a quick look back to the 1970s might suggest a more comparable history. Then it was fast depopulating, had extremely low property values, a high level of rapid-turnover private renting, a serious loss of jobs, numerous school closures and racial disorders provoked by rapid in-migra-tion of ethnic minorities from abroad and provocative policing (Power, 1970). It had the worst council record on many fronts, particularly housing, and the majority of its wards ranked among the poorest in London on overcrowding, poor housing conditions, illegal landlords, as well as some of the most extreme social problems in the city (Shelter, 1974; Hamilton, 1978).
The turnaround came slowly, piecemeal, on the back of generous improvement grants to do up old, decayed property, environmental improvements street by street, tree planting involving residents throughout the borough, support for tenant co-operatives and a multitude of other community-based solutions to local problems. Local services have mushroomed on the back of its revival and many local jobs have flowed from its prom-ising service sector. None of this made Islington into the gimmicky area of its newspaper fame. It is still one of the poorest urban areas in London with many difficult-to-manage council estates and it is beset with special needs and management problems. But it is so popular as a place to live that its housing is now out of reach for most ordinary families. Integrating the very different communities that live alongside each other in Islington and urban neighbourhoods like it is certainly a challenge, but a far more positive one than dealing with the decline and near collapse of its earlier history.
the East End are now recovering rapidly. This is a recent phenomenon of the last five years. Neighbourhood success depends on housing that is potentially attractive to some, not necessarily the most affluent sections of the community; that is well located; and that offers transport links. Most old housing has the potential to be modernised and almost any urban area can be made greener and more attractive if there is sufficient demand and confidence.
Stratford, deep in the East End, and until very recently a severely declining, low-value area with many economic, social, ethnic and environmental problems, is now recovering rap-idly following new ultra-modern transport links and major environmental improvements. Changes in London’s inner areas offer some clues to a brighter future for our cities.There is a new taste for city living, demonstrated by the high value of city centre apartments in Manchester and Newcastle, that we believe can be galvanised into housing demand in the urban core around the centre.The Northern cities can build on their success.
This paper is an extract from Boom or Abandonment: resolving housing conflicts in cities by Katherine Mumford and Anne Power, published by the Chartered Institute of Housing, 2003.
---1
K. Mumford and A. Power,East Enders: Family and community in East London, Policy Press, 2003
2
For more detailed accounts of the process, the reader could refer to Burnett, J.,A Social History of Housing, 1991; A. Briggs,A Social History of England, 1983; Thomson, F. M. L.,Cambridge Social History, 1990; R. Rogers and A. Power,Cities for a Small Country, 2002.
---CHANGING HOUSING MARKETS AND URBAN
RE-GENERATION:THE CASE OF THE M62 CORRIDOR
Brendan Nevin, Peter Lee, Lisa Goodson, Alan Murie and Jenny Phillimore (abridged version by Jonathan Roberts and Ed Ferrari)
---This section of the study is broadly based on two reports compiled by CURS. The first of these was published in February 2001 and was welcomed by the then Housing Minister, Nick Raynsford MP and the DETR. Entitled Changing Housing Markets and Urban Regeneration in the M62 Corridor1, it illustrates the changing aspirations of residents in the
North West of England in respect to housing type and tenure. For the first time, neigh-bourhoods which are at risk from changing demand for housing are highlighted, and a series of policy recommendations are developed, aimed at local and central government, regeneration agencies and social landlords. Secondly, CURS produced another document focused on the changing demand for housing in the social rented and private sectors. Changing Housing Markets:The Case of the M62 Corridor2considered the notion of
chang-ing demand and low demand for social houschang-ing at a sub-regional level. Both of these papers present a concise, yet thorough study of housing in the North West and are of relevance to Shrinking Citiesat a number of levels. Not least in examining the failing hous-ing markets in the conurbation and the transformation in the perception and formation of space as a consequence. This has had a large impact on the urban renaissance and regeneration throughout the region.
---ABSTRACT
There is a hiatus of interest in the UK in changing demand for housing. A considerable volume of research now addresses changing patterns of demand apparent in different parts of the UK and particularly associated with increased voids and turnover rates in the public sector and low house prices and abandonment in the private sector. However, research contributions to this debate remain limited and there are no examples of robust sub-regional studies currently available. The paper presents evidence from a substantial sub-regional study concerned with the M62 corridor running between Merseyside and central Manchester and beyond.The discussion focuses on changing demand in the social rented and private sectors and refers to the macro-economic factors affecting demand. It also focuses upon original survey research which suggests the emergence of a dual housing market within the region. In conclusion, the paper suggests that the framework for discussion of changing demand needs to pay much more attention to sub-regional di-mensions and the strength or weakness of linkages within these markets related to fac-tors other than housing tenure.
---BACKGROUND
This study was commissioned by the Housing Corporation, 18 local authorities, the National Housing Federation, the National House Builders Federation, the Chartered Institute of Housing and 24 RSLs.These agencies were responding to changes in local housing markets in the North West which were experiencing strong demand for newly built accommodation for sale and increases in vacancies and turnover in the social rented and owner-occupied terraced sectors.
period of economic growth since the war, and there is almost perfect statistical relation-ship between the fall in male unemployment and the fall in waiting lists for social hous-ing over the period 1992–1999.This suggests that without measures to improve houshous-ing choice and quality in areas which have a historically high level of low-income housing, eco-nomic regeneration will lead to the deterioration in the popularity of the most marginal neighbourhoods as economically active people choose to leave.
The worst-affected local authorities have experienced large-scale and persistent popula-tion loss over the last 30 years. Conversely, they are also the local authority districts that are experiencing the largest inward commuting, highlighting the fact that people have pre-ferred to live separately from their place of work. This points to a downward spiral in localities where declining neighbourhood quality, increasing social polarisation, decentral-isation and the growth of travel to work areas all interact to produce a surplus of low-quality housing.
---AREAS AT RISK OF CHANGING DEMAND FOR HOUSING
There are 280,000 households contained within the overall clusters of areas at risk of changing demand (16.3% of the households in the study area).These areas contain a pop-ulation of 690,000 people (15.9% of the poppop-ulation of the M62 Corridor). Neighbour-hoods at risk are predominately social housing areas; however there is clear evidence of multi-tenure problems with nearly 100,000 properties being privately owned. These multi-tenure issues are most pronounced in the Merseyside Inner Core, where 46% of households either rent privately or own their homes.
---THE IMPACT OF NEW BUILDING ON OLDER NEIGHBOURHOODS
The market for newly-built accommodation for home ownership in the North of England has remained robust throughout the last decade.This research contained a vacancy chain survey which examined the impact of suburban new build on older inner city neighbour-hoods.The results of this survey show that new-build sites are largely sustained by move-ment within the population that had moved out of the inner city many years previously. This survey highlights a suburban market which is largely disconnected from the inner-city market, which is increasingly insular and prone to decline for demographic reasons.
---RESEARCH
There are a number of important local studies which have begun to document different elements within this process. The major study carried out by Bramley and Pawson and others has also provided some statistical material related to patterns of demand. This material has largely been generated through questionnaires sent to local authorities, but involved some social survey work and local case studies. While it is an important contri-bution to the debate, the methodology employed limits the insights that it can provide. Other contributions have focused upon regional data and regional patterns. Holmans and Simpson, for example, emphasise inter-regional demographic flows and patterns of migra-tion. Again, these provide an important input into the debate. Nevertheless, it is appar-ent that it is intra-regional movemappar-ents rather than inter-regional movemappar-ents which are most important in relation to changing demand. There is low demand and unpopular housing in every region in the UK, and the work of Champion and others highlights the importance of the hollowing out of the city and the process of outward movement from cities.
One of the implications of this research is that we should pay more attention to the emergence of partitioned housing markets at the sub-regional level and that an under-standing of the dynamics of housing markets is fundamental to the discussion of changing demand. The concluding section of the paper further discusses the policy and other implications of this.
---CHARACTERISTICS OF THE NORTH WEST HOUSING MARKET
The DETR report North West Regional Need and Demand Researchcomprehensively out-lines the structure and characteristics of the North West housing market.3Issues relevant
to this study include:
¬ home ownership at 68% was higher than the national average,
¬ home ownership is the preferred tenure amongst potential movers ranging from 56% to 79% across the region,
¬ the level of home ownership drops from nearly 96% of high-income managerial households to just over half of those who are unskilled and
¬ the average terraced house in the region could be purchased with an annual house hold income of approximately £14,500 per annum.
The structure of local housing markets in the study area is set out in more detail later in this paper. While factors which influence changing markets in different local authorities have important common elements, these common influences do not present the same outcomes in different localities because of differences in:
¬ the structure of housing and labour markets, ¬ historic patterns of planning and development,
¬ socio-economic and demographic profiles of the local population, ¬ the nature and quality of the built form and its wider environment and ¬ patterns of economic growth and decentralisation.
---REGIONAL ISSUES
There are twokey regional issues within the M62 corridor and these are set out below: ¬ Decentralisation of Population: the two major conurbations have experienced three
North West study in the 1960s predicted the overspill needs of the conurbation up to 1981. It predicted a regional population of 7.1 million by 1981, a figure which was an overestimation by one million.This overestimation resulted from falling birth rates, a decline in economic growth, and an increased outward migration from the region (Marshall, 19864). The second phase of decentralisation was heralded by the
devel-opment-led planning regimes of the 1980s which favoured peripheral development, facilitating more affluent groups to commute to employment centres. A third and more mature phase is now underway in which inter-regional migration is still impor-tant, although the rate of population decline has slowed. The Greater Manchester conurbations lost 105,000 people between 1991 and 1998, of which 58% consisted of migration to other regions (Bates et al., 20005). Account should be taken here of
the fact that Liverpool’s Travel to Work Area includes parts of North Wales and Manchester’s includes Yorkshire and Derbyshire.The significant intra-regional migration which occurs now is concentrated in flows between the suburbs and the rural hinter-land (see Champion, 20006).
¬ Decentralisation of Employment:the urban-rural shift began in the 1950s when employ-ment growth in the cities slowed in relation to more rural areas. In the 1960s and 1970s, many of the local economies suffered absolute falls in employment, a position which then worsened dramatically in the 1980s.The worst-performing economy in the North West has been located in Merseyside, where, during the period 1981—1996, 83,000 jobs (one in three) were lost. There were, however, significant intra-regional shifts, with more self-contained areas like Warrington and Wigan experiencing signifi-cant increases in employment, whilst areas such as the inner core of Manchester experienced a 19% fall (Turok and Edge, 19997).
---LOCAL FACTORS
In addition to the national and regional factors that are affecting localities, there are a series of local factors which determine the precise nature of low demand in different places.These factors can be listed briefly:
¬ tenure structure— changing demand for council housing and private renting tenures has a proportionately greater impact in the core areas,
¬ dwelling type— flats and maisonettes are much more common in the social rented sector,
¬ age and obsolescence of dwelling — the relative importance of pre-1919 terraced accommodation and especially properties fronting onto the pavement is greater in the core areas and
¬ infrastructure/service — the infrastructure of the core of the two major conurbations contrasts starkly with that on the periphery.
---CONCLUSIONS
The M62 study concludes that a number of processes have led to the housing market in the sub-region becoming fragmented, consistent with processes of polarisation and migra-tion between the metropolitan core and its periphery. As a result, polarisation of the housing marketcan be seen in the fact that the market is now dominated by two distinct parts:
¬ an affluent, peripheral suburban market, predominantly owner-occupied, largely self-sustaining, and supported by growth in the number of households in this market, ¬ a predominantly private-sector market operating in the inner-city neighbourhoods.
There is little connection between these two markets. Each of these has a significant impact on land use patterns, with the first, more successful market in particular requiring a stream of new-build properties, often on green-field sites.The shrinking second market, on the other hand, exposes problems of obsolescence of property types; a declining tar-get market; vacancy of properties and land; and a general hollowing-out of the inner-city, eroding the viability and sustainability of neighbourhoods and the services that support them.
---1
Brendan Nevin, Peter Lee, Lisa Goodson, Alan Murie and Jenny Phillimore,Changing Housing Markets and Urban Regeneration in the M62 Corridor, CURS report for ODPM, University of Birmingham 2001
2
Peter Lee, Changing Housing Markets: The Case of the M62 Corridor, CURS report, University of Birmingham 2002
3
Celia Wong and Moss Madden,The North West Regional Housing Need and Demand Research, DETR, London 2000
4
Neil Marshall,British Cities and Their Regions, Routledge, London 1986
5
Richard Bate, Richard Best and Alan Holmams (eds.),On The Move:The Housing Consequences of Migration, Joseph Rowntree Foundation,York 2000
6
Tony Champion, Flights from Cities?, in: Bates et al. (eds.),On The Move: The Housing Consequences of Migration, Joseph Rowntree Foundation,York 2000, pp. 10–20
7
---CHANGING EMPLOYMENT GEOGRAPHY IN
ENGLAND’S NORTH WEST
Cecilia Wong, Mark Baker and Nick Gallent
---INTRODUCTION
The socio-economic restructuring that has taken place in British cities over the last century has led to a more complex mosaic of production processes, consumption patterns and regulatory practices. The national labour market, for instance, has been characterised by a reduced demand for traditional (often male) skilled manual labour (Green, 1997).This decline parallels a growth in flexible working — with women taking an increasing number of part-time jobs — as well as an urban-rural shift in employment opportunities.Travel-to-work patterns have also been subject to considerable change, with the tendency for less-skilled workers to take jobs closer to home (Coombes et al., 1988; Green, 1995), partially offsetting the long-term trend towards lengthier journeys — to work.The huge loss of manufacturing jobs in inner urban areas has been the root cause of long-term unemployment in the urban workforce. The rise in service sector job opportunities in some of the worst-affected locations has certainly failed to compensate for the overall loss of manufacturing jobs, largely as a result of a skills mismatch and the failure of numer-ous re-training initiatives. In broader terms, research has labelled many cities centres of social exclusion where the rift between the included and the excluded widens daily, par-ticularly where there is an obvious failure to successfully integrate the provision of decent homes with good job opportunities.
It is against this backdrop that this paper examines the changing spatial and sectoral dis-tribution of employment in the North West, seeking to identify the essential links between jobs and homes. The two major conurbations of the North West, Greater Manchester and Merseyside, have suffered disproportionately over recent decades from the national problems of industrial decline and unemployment (Wong, 1994). It is a region of tremendous internal variation, where affluent middle-class suburbs and deprived inner-city areas exist almost shoulder-to-shoulder. Moreover, it comprises both densely populated metropolitan areas and small, sometimes fragile, rural economies. The North West certainly represents a mixed bag of residential and employment concerns and no singular statement can capture the full range of issues at stake.This paper seeks to unrav-el the various socio-economic trends that have shaped the region during the post-war period — as a precursor to considering more recent employment trends and offering a preliminary answer to the most basic of questions: where will the people work?
---EMPLOYMENT TRENDS: FROM DAWN TO DUSK
catch-ing up whilst some of the North West’s traditional industries had already begun their long trajectories of decline. Nevertheless, immediately prior to World War One, the dominant position of the region was still apparent. For example, two-thirds of the world exports in cotton goods still originated in Lancashire (Baker and Hebbert, 1995); and Lever Brothers, based at Port Sunlight, retained control over 61% of Britain’s output of soap products. It was also a time of continued technological development, with new industries emerging across the region.The ‘chemical revolution’ had begun on Merseyside and in north-west Cheshire; new engineering industries — initially linked to textile manufacturing but later diversifying into new areas — were springing up across the North West; and a flourishing food-processing industry, linked to imports through the port of Liverpool, was gathering pace.Thus, by World War Two, the industrial structure of the region was diversifying into new areas of industrial machinery, engineering, civilian and military aircraft manufacturing, armaments and other products such as glass (led by Pilkingtons).
After the war, government intervention became more pronounced as industries such as coal mining and textile production went into free fall. A rising number of mergers, con-solidations and closures led increasingly to an industrial structure dominated by national and multinational companies with an associated exodus of R&D and HQ functions.Thus, from the 1950s to the 1970s, much of the region was targeted for various forms of assis-tance. Initially these policies appeared to meet with some success, attracting new manu-facturing industries to Merseyside (notably vehicle manumanu-facturing) and resulting in increases in service sector employment, leading to the so-called ‘Merseyside economic miracle’ of the 1960s. It was, however, to prove short-lived. Although by the time of the North West Study in 1965 (Department of Economic Affairs, 1965) Merseyside still had the highest absolute population and employment increases within the region, closer examination revealed increasing rates of both unemployment and out-migration. But rather than attempting to stem outward migration from the two principal cities of Liverpool and Manchester, the strategic planning policies of the time promoted this process, with planned de-concentration (overspill) to the new towns of Runcorn, Skelmersdale, Warrington and Central Lancashire. New town policy was coupled with extensive motorway construction, encapsulated within a broad development strategy (North West Joint Planning Team, 1974), which focused growth in the east-west axis of the Mersey belt. Meanwhile, a 4% decrease in manufacturing jobs between 1953–1963 and service-sector increases at a slower rate than the national average provided worrying signs of the economic problems to come (Department of Economic Affairs, 1965). By this time, although total employment was still growing, the North West’s performance was markedly inferior to most other regions.
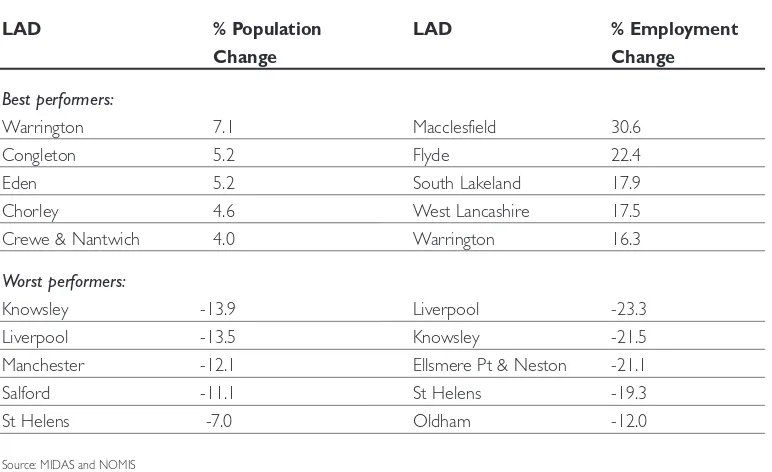
Censusfigures for 1981 and 1991 show 4.1% a population decline in the North West and a parallel 2.8% employment loss compared with an almost stable population across England and Wales (-0.1%) as a whole and 1.2% overall employment growth in England. These figures, however, mask significant variations in demographic and employment change in different parts of the region which, in general, can be seen to follow a fairly similar spatial pattern.The patterns revealed in Table 1suggest some linkage between job loss/growth and population movements, with the well-documented urban exodus to sub-urban and rural areas, mirrored — at least to some extent — by similar transfers of job opportunities. Consequently, the regional distribution of employment change by OPCS urban types [Tab. 2] roughly parallels the national picture, though the North West has suffered greater losses from its ‘principal’ cities (mainly due to a decline in Liverpool of over 23%).
In addition to these geographical variations in employment change, the fortunes of indi-vidual employment sectors also varied markedly during the 1981 to 1991 period. Employment in the North West’s primary industries declined by 28.6% (although nation-al losses of 32.5% were even greater) and the region lost over 245,000 manufacturing jobs (down 24.9% against a national decline of 23.3%). During the same period, although service sector jobs increased by over 200,000 (13%), this remained well below the 17.2% rise in England as a whole. A more detailed breakdown of employment change by indus-trial sector is given in Table 3.This shows both percentage change and percentage share of the region’s total employment base, highlighting again the severe declines in the region’s traditional energy, manufacturing and engineering industries as well as the spec-tacular percentage increases in banking, finance and insurance employment (although still slightly lower than the national growth rates). By 1991, although there was still a higher proportion of regional employment in manufacturing, the region’s industrial structure was tending to converge, to a far greater extent, with the national pattern.
---Table 1: Population and Employment Change 1981–1991
LAD % Population LAD % Employment
Change Change
Best performers:
Warrington 7.1 Macclesfield 30.6
Congleton 5.2 Flyde 22.4
Eden 5.2 South Lakeland 17.9
Chorley 4.6 West Lancashire 17.5
Crewe & Nantwich 4.0 Warrington 16.3
Worst performers:
Knowsley -13.9 Liverpool -23.3
Liverpool -13.5 Knowsley -21.5
Manchester -12.1 Ellsmere Pt & Neston -21.1
Salford -11.1 St Helens -19.3
St Helens -7.0 Oldham -12.0
Source: MIDAS and NOMIS
---Table 2: North West Employment Change by OPCS Urban Areas, 1981–1991
Urban Type 1981 Jobs 1991 Jobs Change % change % change
1981–1991 1981–1991 1981–1991
England & Wales
Principal Cities 550,424 460,386 -90,038 -16.4 -9.0
Metropolitan Districts 1,043,580 1,011,447 -32,133 -3.1 -3.9
Non-Metro. Cities 71,744 65,759 -5,985 -8.3 1.3
Industrial Districts 404,105 403,029 -1,076 -0.3 0.0
New Towns 180,182 200,136 19,954 11.1 11.3
Resort & Retirement 154,116 164,148 10,032 6.5 9.7
Mixed Urban / Rural 181,410 199,369 17,959 9.9 11.8
Remote Rural 46,024 53,553 7,529 16.4 13.3
North West 2,631,585 2,557,900 -73,685 2.8 1.3
Source: NOMIS
---Table 3: North West Employment Change and Structure, 1981–1991
1981 1991 1981–91 1981–91 1981–91 1981 1991 1991
change change change NW NW Engl.
in % in % struc. struc. struc.
England in % in % in %
Agriculture
forestry 24,396 22,190 -2,206 -9.0 -20.0 0.9 0.9 1.3
Energy/
water supply 75,547 49,152 -26,395- 34.9 -39.2 2.9 1.9 1.8
Extraction/
manufact. 139,133 99,068 -40,065 -28.8 -28.4 5.3 3.9 3.0
Metal goods/
vehicle ind. 360,075 259,728- 100,347 -27.9 -29.4 13.7 10.2 9.7
Other manufact. 357,441 267,187 90,254 -25.3 -18.8 13.6 10.4 8.7
Construction 131,810 116,066 -15,744 -11.9 -11.5 5.0 4.5 4.3
Distribution,
hotels/cater. 494,771 559,639 64,868 13.1 13.3 18.8 21.9 21.6
Transport/
commun. 164,006 148,711 15,295 -9.3 - 4.8 6.2 5.8 6.2
Banking, finance,
insurance 176,863 254,045 77,182 43.6 51.1 6.7 9.9 12.6
Other services 708,738 782,089 73,351 10.3 14.9 26.9 30.6 30.8
Total 2,632,780 2,557,875 -74,905 -2.8 1.2 100.0 100.0 100.0
Source: NOMIS
In spite of this cautionary note, the 1996 Employment Surveydata reveal that the Greater Manchester conurbation has the largest share (40.2%) of regional employment whilst Manchester alone provides 9.5% of the regional total. However, the best performers (in terms of job growth) within Greater Manchester are Bolton, Bury, Stockport and Trafford. Bolton,Trafford and Stockport each provide over 100,000 jobs in the region and together account for 13% of the regional total. It is the stable performance of these boroughs (in retaining large volumes of jobs) which has helped to maintain the importance of the Greater Manchester conurbation as a major employment centre.
Lancashire provides one-fifth of the region’s employment, and Merseyside falls into third place (17.1%), with Liverpool accounting for 6.8% of the regional sum. It is clear that the Merseyside conurbation is consistently underperforming, with all five districts having experi-enced additional employment decline between 1991 and 1996. Both the city of Liverpool and its hinterland have suffered from severe employment decline. According to the 1998 Index of Location Deprivation, Liverpool is the most deprived area in the country, and its problems are shared by neighbouring districts (using the same index, Knowsley is ranked ninth whilst Wirral and St. Helens are ranked 44th and 45th respectively). Merseyside also stands out as the one county in the region with an economic activity rate below the regional mean (56.5% compared to 59.6%).
In the shire counties, there have been sharp variations in local economic performance. In Cheshire, for instance, the success enjoyed by Macclesfield and Warrington can be set against the laggard performances of industrials towns and boroughs such as Ellesmere Port and Neston, and Halton. Similarly, in Lancashire, places like Chorley, Fylde, Rossendale and West Lancashire are performing exceptionally well, leaving the districts of East Lancashire wallowing in their wake. In Cumbria, there has been a clear divide between those growth areas with easy access to the M6 corridor (e.g., South Lakeland and Eden) and those areas of general decline, reflected in significant job losses, in West Cumbria (e.g. Allerdale and Barrow-in-Furness).
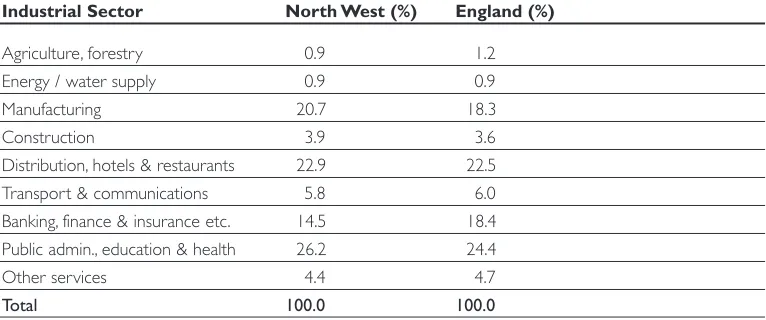
Returning to the broader structural concerns, it is largely the case that the lengthy process of socio-economic change in the region has brought the North West to within a stone’s throw of the national structure [see Tab. 4]. However, the manufacturing sector in the region remains marginally larger than the national average (20.7% regionally compared with 18.3% nationally). In contrast, the region does not seem able to attract producer service sector (banking, finance and insurance) employment to the same extent as other English regions (14.5% in the North West compared with 18.4% across England). Overall, though the region may have a ‘traditional’ image, the manufacturing sec-tor provides just over one-fifth of overall regional employment. The most important employer in the region is now the public service sector (26.2% — encompassing admin-istration, education and health), with second place held by the ‘distribution, hotels and restaurants’ sector (22.9%).
---Table 4: Employment by Industrial Sector, 1996
Industrial Sector North West (%) England (%)
Agriculture, forestry 0.9 1.2
Energy / water supply 0.9 0.9
Manufacturing 20.7 18.3
Construction 3.9 3.6
Distribution, hotels & restaurants 22.9 22.5
Transport & communications 5.8 6.0
Banking, finance & insurance etc. 14.5 18.4 Public admin., education & health 26.2 24.4
Other services 4.4 4.7
Total 100.0 100.0
Source: NOMIS
Economic globalisation has, according to some commentators (Amin and Thrift, 1994), been matched by a parallel process of sectoral rather than functional specialisation at the regional level. The decline in heavy manufacturing affecting many regions has left a void that more ‘advanced’ and high technology industries (Castells and Hall, 1994; Hudson, 1997) as well as some service — and particularly business — sector employers (Keeble et al, 1991; Green, 1997) may be expected to fill. Unfortunately, the North West has underperformed in terms of growth in business services employment (location quotient (LQ)=0.65) when benchmarked against England as a whole[see Tab. 5]. On a more pos-itive note, the development of the high-technology sector (LQ = 0.97) in the region has been on a par with the national picture[Tab. 6].
The North West provides 8.6% of all business services employment in England [Tab. 5]. However, nearly half of this employment is located in the Greater Manchester conurba-tion (4.4%) and a further fifth in Cheshire (1.8%).The City of Manchester alone provides 1.4% of all business services jobs in England — the fourth highest concentration behind London (with a 21% share), Birmingham and Solihull (3.7%) and Leeds (1.7%). In contrast, the Merseyside conurbation is not performing quite as well in this sector and only provides 1.1% of the English total. In terms of the ONS classification, the mining and industrial areas still provide a focus for the largest concentration of business services jobs (3.4%) — though the more prosperous areas appear to be rapidly increasing their share of employ-ment in this sector (currently running at 2.5%). However, the region as a whole performs relatively poorly in this sector.The inferiority of the region’s performance is highlighted by the fact that none of the counties are able to match the English average. Only four local areas have outperformed the English average.These are Trafford (LQ= 1.7), Crewe and Nantwich (LQ=1.2), Macclesfield (LQ=1.2) and Manchester (LQ=1.1).
---Table 5: Business Services Employment, 1996
business % of total Location % share of
employment employment Quotient English total
By counties:
Cheshire 11,104 2.9 0.87 1.8
Cumbria 1,427 0.8 0.25 0.2
Greater Manchester 27,469 2.7 0.82 4.4
Lancashire 7,453 1.4 0.44 1.2
Merseyside 6,779 1.6 0.48 1.1
North West 54,232 2.1 0.65 8.6
England 627,578 3.3 1.00 100.0
Note: The Location Quotient [LQ] is used to compare an area’s share of employment in a particular sector with the benchmark area (in this case, England) Source: NOMIS
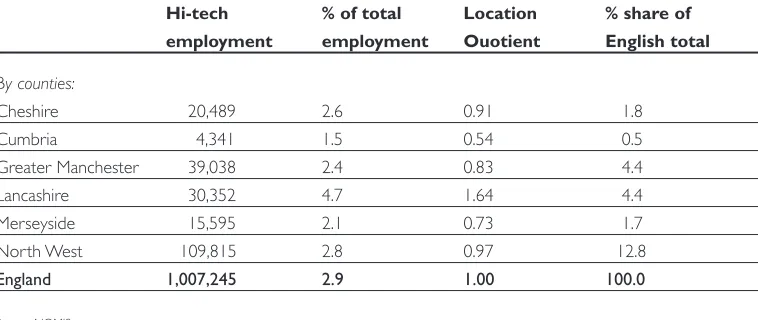
The outlook for high-technology industries in the North West is rather more encourag-ing. The region accounts for 12.8% of all high-technology employment in England, of which one-third is located in Lancashire and another third in the Greater Manchester conurbation.The defence and aerospace industries have certainly played a pivotal role in shaping the hi-tech profile of Lancashire (LQ=1.6), especially in Ribble Valley (LQ=7.2), Fylde (LQ=6.4), Burnley (LQ=2.8) and Blackburn (LQ=1.7). On the other hand, in spite of the volume of hi-tech jobs available in Greater Manchester, it appears to be under-performing (LQ=0.8) in relation to the regional and national levels. Cheshire and Merseyside also seem to perform relatively badly and provide just 1.8% and 1.7% of England’s hi-tech jobs respectively. However, individual towns such as Macclesfield (LQ=2.81) and Oldham (LQ=2.4) are outstripping the regional and national averages.
---Table 6: High Technology Employment, 1996
Hi-tech % of total Location % share of
employment employment Ouotient English total
By counties:
Cheshire 20,489 2.6 0.91 1.8
Cumbria 4,341 1.5 0.54 0.5
Greater Manchester 39,038 2.4 0.83 4.4
Lancashire 30,352 4.7 1.64 4.4
Merseyside 15,595 2.1 0.73 1.7
North West 109,815 2.8 0.97 12.8
England 1,007,245 2.9 1.00 100.0
Source: NOMIS
---THE NORTH WEST PEOPLE:WHERE WILL ---THEY WORK?
¬ Firstly, the economic structure of the region has become increasingly similar to the national structure. That said, the North West retains a greater representation of manufacturing jobs, but a less impressive share of jobs in the business service sector. ¬ Secondly, the regional economy has moved from being industrially-based to being
service-driven. Branch plant closures and manufacturing rationalisation at the begin-ning of the 1980s resulted in an acute decline in the proportion of manual jobs across the region.This decline was partially, but not wholly, offset by some gains in the service sector.The net result, therefore, was an overall decline in employment opportunities. ¬ The third significant regional trend has been the switch from a traditional male-centred employment culture to a more flexible — and gender-neutral — situation. This change is evidenced in the decline in full-time male employment and the parallel increase in the number of part-time jobs being taken by female workers.
¬ Fourthly, there has been a sea change in the regional geography of employment opportunities, with a gravitational shift away from traditional manufacturing and inner urban areas towards the more prosperous suburbs, towns and rural locations.This shift has been particularly dramatic in the high-technology and business service sectors. ¬ The fifth trend takes us into the complex spatial patterns of employment change in
the North West, which go beyond a simple binary metro/non-metro area divide. Although the two principal cities, Liverpool and Manchester, and other traditional industrial locations are the general losers in generating employment, successful examples can also be found in the more prosperous suburbs of the Greater Manchester conur-bation.This complex spatial differentiation is also evident in the shire counties. ¬ Finally, and despite a generally bleak picture (relative perhaps to the region’s more
prosperous past), analysis points to the fact that Manchester will continue to be ranked as one of Britain’s principal business service centres. This is despite the city’s overall underperformance in job creation and the persistence of social and economic deprivation in many of its wards. That said, the success of the City of Manchester is increasingly linked to the overall performance of its wider metropolitan areas and sub-urbs. Unfortunately, the Merseyside conurbation has been unable to escape its current spiral of economic decline and the City of Liverpool — along with its neigh-bouring districts — has continued to cast a shadow over the region’s wider fortunes. In bringing this discussion to a close, it is clear that the North West may never return to its position as the foremost industrial centre in the western world.The region’s heyday is long past and, quite rightly, those with a stake in the North West’s future must develop regeneration and land use strategies that play to new strengths rather than harking back to former glories. This reality, of course, is universally accepted. It only remains to work through the precise details of how such a regional renaissance could be achieved, although such strategies should seek to promote social equity and ensure that the region’s future population is not disadvantaged — either locationally or economically — by the development of short-sighted regional policy.
---References
A.Amin and N.Thrift, Living in the Global, in: A. Amin and N.Thrift (eds.),Globalisation, Institutions and Regional Development in Europe, Oxford University Press, Oxford 1994, pp. 1–22
M. Baker and M. Hebbert,The Regional Economy of the Trans-Pennine Corridor, Department of Planning and Landscape Occasional Paper No. 40, University of Manchester, Manchester 1995
M. Castells and P. Hall,Technopoles of the World, Routledge, London, 1994
Department of Economic Affairs,The North West: a Regional Study, HMSO London 1965
A. Green, Using Census and Survey Statistics in Local Labour Market Analysis, in:Local Economy, 1995/10, pp. 259–273
A. Green, Exclusion, Unemployment and Non-employment, in:Regional Studies, 31, 1997/5, pp. 505–520
R. Hudson, Regional Futures: Industrial Restructuring, New High Volume Production Concepts and Spatial Development Strategies in the New Europe, in:Regional Studies, 31, 1997/5, pp. 467–478
North West Joint Planning Team,Strategic Plan for the North West, HMSO, London 1974
D. Keeble, J. Bryson and P.Wood, Small Firms, Business Services Growth and Regional Development in the UK: Some Empirical Findings, in:Regional Studies, 25, 1991/5, pp. 439–457
C. Wong, Quality of Urban Living: an Infrastructural Dimension, in: S. Neary, M. Symes and F. Brown (eds.),
The Urban Experience: a People-Environment Perspective, E& FN Spon, London 1994, pp. 257–269
---MANCHESTER — CITY PROFILE
Phil Misselwitz
---INDUSTRIALISATION AND DECLINE
Manchester is the third-largest city in England and is considered the ‘capital’ of the North. The city has 433,000 inhabitants (1996), surrounded by the Greater Manchester area with a population of approximately 2.5 million. Manchester is arguably the oldest indus-trial city in the world. Its most significant expansion took place in the first half of the 19th century, when the population of the provincial centre multiplied by four from 76,788 to 316,213 (A. Kidd), transforming Manchester into the cotton centre of the world, also known as the ‘workshop of the world’ or ‘capital of the industrial revolution’.The famous cotton manufacturing using steam-powered spinning and weaving factories took place mainly in a ring of mill towns (such as Blackburn, Burnley, Preston, Bolton, Oldham, Rochdale, etc.) connected by a complex canal system and later railway lines, beginning with the 1830 Manchester-Liverpool railway — the first in the world. Manchester itself remained predominantly a trading town. Its commercial warehouses controlled the majority of world cotton trade as the British Empire opened vast markets overseas.The construction of the Manchester Ship Canal in 1894 reduced the city’s dependency on the Liverpool port.The boost to the local economy led to the construction of Trafford Park (adjacent to the canal), the first industrial estate in the world. Manchester’s economy quickly diversified through spin-offs from the textile industry, such as textile engineering and machine tool making. Indeed, by 1911, twice as many Manchunians were employed in metals and engineering as in textiles, while others worked in transport and communi-cation (port and railway stations), food or vehicle manufacturing. Most of the city’s workers lived in dense urban quarters with back-to-back terraces huddled around factories and warehouses, which inspired Friedrich Engel’s The Condition of the Working-Class in England as early as 1844.
The city’s industrial decline set in as early as 1914, the beginning of World War One, when the city was cut off from its overseas markets, especially India, which received almost half of the textile exports. Overseas industrial production soared and Manchester felt accelerating foreign competition taking advantage of cheaper labour and newer machinery. In the late 1930s, exacerbated by world economic crisis, the decline soon became catastrophic, with only one-fifth of the 1913 textile exports remaining (A. Kidd). The related industries were badly affected and, while the British home market remained intact until the 1950s, British cotton cloth disappeared de facto in the 1960s.This decline in cotton affected all sectors of the economy. Although the city’s diversified economy and the port had protected the city at first, containerisation in the 1960s triggered its even-tual closure and that of the adjacent estates, completed in the 1980s, when Manchester’s industrial base had practically vanished. The city was plagued by unemployment and deprivation. Between 1961 and 1983, the city had lost 150,000 jobs in manufacturing.The emerging service sector could not absorb these numbers, despite comparatively early and above-average growth, suffering from the trend towards office decentralisation and leaving only 23% of the city’s workforce employed in 1985 (A. Kidd).
site (e.g. Hulme Crescents), to new housing estates in the outer conurbation (e.g. Wythenshaw) or to the sprawling New Towns (while Manchester itself lost more than half of its population, the suburban conurbation of Greater Manchester remained almost stable). At first, this tabula rasademolition was fuelled by modernist ideology, but soon it became part of almost desperate measures to adjust neighbourhood densities to declin-ing population numbers (negative migration) and re-organise estates in accordance with security concerns in the face of rioting and exploding crime.
---REGENERATION
Today, a mere 20 years after the city’s most series moment of decline, Manchester’s pre-dominant image is that of the booming centre of the North. In an exceptional process of regeneration and branding beginning in the late 1980s, the city has desperately and increasingly successfully shaken off the image of decline.The last decade has seen unem-ployment figures drop from 18.9% in 1995 to 9.5% in 2001 and, despite controversial census figures, demographic development has almost stabilised. Amongst the many aspects that aided Manchester’s recovery, the simultaneity of the following trends was particularly significant:
1) Grass-Roots Initiative,Youth Culture and the Rediscovery of the Warehouse
In the late 1970s and early 80s, urban decline was most keenly felt in the centre of the city, which was left with less than 1,000 inhabitants. But this very availability of affordable spaces began to attract a new generation who seized the opportunity to realise sub-cultural programmes. Empty warehouses and closed shop fronts or factory buildings became an important factor fuelling the growing local music scene. By the beginning of the 1990s, Manchester had become nationally and internationally famous as ‘Madchester’, referring to the countless independent record companies and recording studios (e.g. Factory Records) scattered around the city centre.The development of a ‘continental’ cafe bar and club scene (e.g.The Hacienda) eventually affected the entire city, attracting for example soaring student numbers (today approximately 80,000), who contribute signifi-cantly to the economic and cultural life of the city.The liberal atmosphere in the city also led to the growth of the ‘village’, the first gay cafes and clubs in the UK, concentrated along Canal Street.The ‘unplanned’ rise of a vibrant urban culture not only created new bars or offices for the creative industries, but also generated new demand for single-person or childless-couple households in the form of city apartments. Architects and developers such as Urban Splashwere soon to discover the potential of warehouses to invent a particular Manchunian brand of loft living.The entrepreneurial spirit of architect-developers led to the regeneration of large parts of the inner city, beginning with Castle Field and the Northern Quarter and extending into Ancoats to the present day.
2) From Municipal Socialism to Municipal Entrepreneurialism