PAPER • OPEN ACCESS
CONFERENCE INFORMATION
To cite this article: 2018 IOP Conf. Ser.: Mater. Sci. Eng.308 011002
View the article online for updates and enhancements.
Related content
Numerical analysis of initial stage of thermal shock
V N Demidov
-Studies in Numerical Analysis: Papers Presented to Cornelius Lanczos
J G Andrews
-Numerical analysis of the non-equilibrium plasma flow in the gaseous electronics conference reference reactor
Yang Bijie, Zhou Ning and Sun Quanhua
1
Content from this work may be used under the terms of theCreative Commons Attribution 3.0 licence. Any further distribution of this work must maintain attribution to the author(s) and the title of the work, journal citation and DOI.
Published under licence by IOP Publishing Ltd
1234567890‘’“”
10th International Conference Numerical Analysis in Engineering IOP Publishing IOP Conf. Series: Materials Science and Engineering 308 (2018) 011002 doi:10.1088/1757-899X/308/1/011002
CONFERENCE INFORMATION
Numerical analysis utilizing the advantage of the development of computer hardware and software
has had an immerse impact in many fields of engineering in recent years as it can provide not only
fast but also comprehensive solutions in engineering problems.
The 10
thInternational Conference on Numerical Analysis in Engineering (NAE) 2017 offers a
place and opportunities for researchers and engineers from academic, industries and other sectors
to exchange their scientific and technological information. NAE 2017 is also provided for students
to present their research papers.
The conferece is organized by University of Sumatera Utara, in cooperation with Toyohashi
University of Technology (TUT), Toyohashi
–
Japan; JSME
–
ICTS (International Chapter for
Indonesian Section); Universiti Kebangsaan Malaysia (UKM), Bangi, Kuala Lumpur
–
Malaysia;
Badan Kejuruan Mesin - Persatuan Insinyur Indonesia (BKM-PII); Universitas Syiah Kuala
(UNSYIAH); IKATM USU (Mechanical Engineering Alumni Association of USU), and other
academic institutions in Japan.
Background:
Materials, Science, and Engineering
The conference covers the following topics approached by the numerical or the experimental
method (but not limited to):
x
Stress, strain and deformation analysis (linear, nonlinear, viscoelastic, viscoplastic,
foams, seismic,etc)
x
Fracture analysis (fracture mechanics, fatigue, creep, etc)
xDamage analysis
x
Engineering dynamics ( vibration, rotation of shaft, noise, multibody dynamics, etc)
xMechanical elements (gear, screw, welding, joint, bearing, etc)
x
Heat and mass transfer (heat transfer, combustion, refrigeration, chemical reaction,
diffusion, etc)
x
Fluid dynamics ( laminar flow, turbulent flow, fluid machines, drain, dam, irrigation,
etc)
x
Material forming (metal, plastics, composite, etc)
xTribology (friction, lubrication, etc)
x
New algorithms for numerical analysis (Neural network, Genetic algorithm, Evolutionary
algorithm, etc)
x
Computational method in engineering and science
x
FEM Application in Geotechnical and Structural Engineering
x
Artificial Intelligence Application in Engineering, such as Expert System, Pattern
Recognition, Neural Network Genetic Algorithm, etc
2
Keynote Speakers:
1.
Prof. Yoshitake WADA (Kindai University)
2.
Prof. Ahmad Kamal Ariffin (Universiti Kebangsaan Malaysia)
Honorary Board:
1.
Prof. H. Mohamad Nasir, Ph.D., Ak (Ministry of Research, Technology, and Higher
Education Republic of Indonesia
)
2.
Dr. Muhammad Dimyati (Directorate General Empowerment on Research and
Development, of Ministry of Reseach, Technology, and Higher Education Republic of
Indonesia)
3.
Prof. Dr. Runtung, SH, M.Hum (Rector, University of Sumatera Utara (USU
)
4.
Prof. Dr. Eng Samsul Rizal (Rector, UNSYIAH)
5.
Prof. Dr. Satrio Soemantri Brojonegoro (Visiting Professor of Toyohashi University of
Technology
6.
Prof. Emeritus Masanori Kikuchi (Tokyo University of Science)
International Board:
1.
Prof. Emeritus Hiromi Homma (Toyohashi University of Technology)
2.
Prof. Emeritus Masanori Kikuchi (Tokyo University of Science)
3.
Prof. Masashi Daimaruya (Muroran Institute of Technology)
4.
Prof. Kikuo Kishimoto (Tokyo Institute of Technology)
5.
Prof. Yasuhiro Kanto (Ibaraki University)
Scientific Committee:
1.
Prof. Michihisa Koyama (Kyushu University)
2.
Prof. Emeritus Masanori Kikuchi (Tokyo University of Technology)
3.
Prof. Hideki Kawai (Muroran Institute of Technology)
4.
Prof. Bustami Syam (University of Sumatera Utara)
5.
Prof. Ahmad Kamal Ariffin (Universiti Kebangsaan Malaysia)
6.
Prof. Yasunori Kikuchi (The University of Tokyo)
7.
Prof Dr. T.M Indra Mahlia (Universiti Tenaga Nasional, Malaysia)
8.
Assoc. Prof. Ing. Petr Valášek, Ph.D (Czech University of Life Sciences Prague)
9.
Assoc. Prof. Dr. Gürkan A. K. GÜRDİL (Ondokuz Mayis University, Turk
ey)
10.
Hasan Ozcan, Ph.D (Karabuk University, Turkey)
11.
Dr. Edward Halawa (Charles Darwin University, Australia)
3
1234567890‘’“”
10th International Conference Numerical Analysis in Engineering IOP Publishing IOP Conf. Series: Materials Science and Engineering 308 (2018) 011002 doi:10.1088/1757-899X/308/1/011002
Organizing Committee:
International Chair : Prof. Bustami Syam
Prof. Masanori Kikuchi
Prof. Ahmad Kamal Ariffin
Local Organizing Committee
Chairman
: Dr. Eng. Himsar Ambarita
Co-chair
: Dr. M. Sabri (Regular Session)
Dr. Bode (Student Session)
Dr. Ir. Mirza Irwansyah, MBA, MLA
Secretary
: Dr. Eng. Taufik Bin Nur
Member
: Dr. Adi Setiawan
Dr. Emerson P. Sinulingga
Dr. Perwira M. Tarigan
Dr. -Ing. Ikhwansyah Isranuri
Dani Gunawan, ST., MT.
Treasury
: Melani
Secretariat
: Yetti Utami
Supporting Staff
: Firdus
Wahyu Hardiansyah
Anggia Murni
Vera
Jumiati
Contact Info:
PAPER • OPEN ACCESS
Modeling reliability measurement of interface on
information system: Towards the forensic of rules
To cite this article: M. K. M. Nasution et al 2018 IOP Conf. Ser.: Mater. Sci. Eng.308 012042
View the article online for updates and enhancements.
Related content
Information systems as a tool to improve legal metrology activities
B A Rodrigues Filho, A N R Soratto and R F Gonçalves
-Modeling Business Processes of the Social Insurance Fund in Information System Runa WFE
M Yu Kataev, L A Bulysheva, Li D Xu et al.
-Information systems for material flow management in construction processes
P Mesároš and T Mandiák
1
Content from this work may be used under the terms of theCreative Commons Attribution 3.0 licence. Any further distribution of this work must maintain attribution to the author(s) and the title of the work, journal citation and DOI.
Published under licence by IOP Publishing Ltd
1234567890‘’“”
10th International Conference Numerical Analysis in Engineering IOP Publishing IOP Conf. Series: Materials Science and Engineering 308 (2018) 012042 doi:10.1088/1757-899X/308/1/012042
Modeling reliability measurement of interface on
information system: Towards the forensic of rules
M. K. M. Nasution1, Darwin Sitompul2 and Marwan Harahap3 1
Teknologi Informasi, Fasilkom-TI, Universitas Sumatera Utara, Padang Bulan 20155 USU, Medan, Indonesia
2
Teknik Mesin, Fakultas Teknik, Universitas Sumatera Utara, Padang Bulan 20155 USU, Medan, Indonesia
3
Matematika, Fakultas Matematika dan Ilmu Pengetahuan Alam, Universitas Sumatera Utara, Padang Bulan 20155 USU, Medan, Indonesia
E-mail: [email protected]
Abstract. Today almost all machines depend on the software. As a software and hardware system depends also on the rules that are the procedures for its use. If the procedure or program can be reliably characterized by involving the concept of graph, logic, and probability, then regulatory strength can also be measured accordingly. Therefore, this paper initiates an enumeration model to measure the reliability of interfaces based on the case of information systems supported by the rules of use by the relevant agencies. An enumeration model is obtained based on software reliability calculation.
1. Introduction
Talking about the current machine, it cannot be separated from the software or the system that controls it [1]. Thus, an information system as the implementation of rules that apply in the management become an integral part of the rule [2]. If the information system is built on the principles of software engineering, then the information system can be measured its reliability in carrying out its duties, and this is also used as a measure of the strength of the rule. This is as a basis for its possible forensic form of applicable regulations [3].
The measurement of reliability of a program that represents the information system can be summarized by involving the principle of software reliability [4], by involving a probability calculation of the ongoing process flow by involving a flowchart or not [5]. The approach to the reliability model is based on the ease of enumeration [6]. This paper aims to reveal an enumeration model based on a single case, i.e. Kabupaten Road Management (KRM) system [7], in order to obtain a model to reveal the force of the applicable rules of something related.
2. Review and Motivation
2
number of errors left and each error contributes equally to the size for the i-failure occurs isλi, and is declared with
λi=π0(N0−(i−1)) (1)
with whereπiis the correct failure size per error andNiis the number of correct errors introduced early in the software [11].
On the different side of the software engineering, the program is composed of modules that are created procedurally and will take a specific place dynamically in memory if the program is executed. Each program or module can be describe as an execution with a flowchart, which is indirectly a process with a starting point and ending at a single point of destination [12]. Thus, the xi event occurs on the edge ei ∈ E from a graph G = (V, E) and xi components circumstance that ei fails, with which V is the set of vertices and E is the set of edges. The probability of operationpifrom edgeeiis probabilityxi, and failure is represented byqi = 1−pi, so for operational circumstance with the limited edges e1, e2, . . ., e5 [13]. Likewise, the process that takes place in the use of a system as a description of procedures that apply to reality.
3. An Adaptive Approach
The interface model can be represented by a node, and the data stream process is expressed as an edge, whereby the whole process can be represented by a flowchart [14]. The interface operation in the system is viewed as a flowchart as well, but in this section it can be judged based on the need for a large number of data inputs [13, 9].
By recognizing interface operations that flow data, by it also recognize of necessity in the data processing system. This operation is expressed by the flow from the source node s to the destination node t[15]. Operation is to record data or information from a human source to the destination database with the opportunity of false or true is balanced. Therefore, the probability graph Gand the nodes s, t which are expressed as the reliability of two terminals, or so-called connections, are writtenHub2(G), orAn2(G) [13].
The second operation in the data flow is the dissemination of appropriate information. The reliability of all terminals,Hub2(G), against the probability that there is a path fromsto every other node, or is the probability that the directed graph contains at least one spanning-tree that is rooted in s. Thus a path operation will simultaneously involve the pairwise connection of the k nodes as the stated terminal, 2 ≤k ≤ n [16]. The k-terminal reliability,Hubk(G), is the probability that for the destination node, the graph contains a path between each pair of k nodes, or expressed as the connect-s, T for the directed graph G, with which s is the source node and T is the set k−1 destination nodes. In addition, other measurements may still be possible. However, the general mechanism is to state that reliability issues exist in the existing order. For any probabilistic graph T = (V, E), it expresses a state fromGto a subset, defined as all arcs in S operate and all arcE−S fails. A path operation is defined by defining the set of operations, by which OP(G) is the set of circumstances deemed to operate, or expressed in the F A(G) = −OP(G) as failure set. OP(G) is sometimes referred to as a stochastic binary system, with which its members in a set of paths [17].
If the provision has established a system, and the system can be measured its reliability, then the provision can be measured ability.
4. Enumeration Model
3
1234567890‘’“”
10th International Conference Numerical Analysis in Engineering IOP Publishing IOP Conf. Series: Materials Science and Engineering 308 (2018) 012042 doi:10.1088/1757-899X/308/1/012042
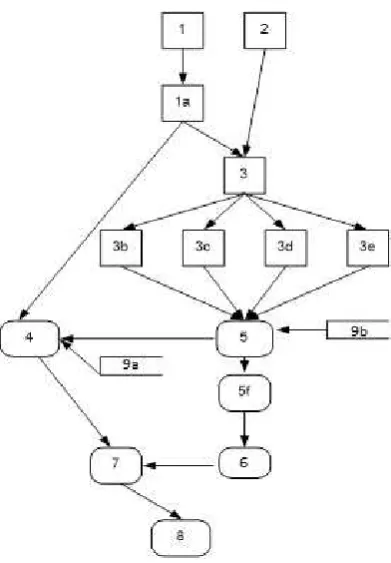
Figure 1. Data flow of the planning interface in KRM
keep the applicable rules of course the procedures in it can be transferred to another system. KRM has the following cycles: project approval, project preparation, project implementation, and project completion. This measurement model focuses on the planning module, which has the following interfaces: (a) Road Network Mastering Instructions (K1), (b) Bridge Inventory Log (K10), (c) Roads Analysis Form (A1), (d) Proposed Maintenance Form (P), (e) Large Work Study Form (P2), (f) Proposed Selected Weighing Work Form (P3), (g) Proposed Plan Form, (h) Definitive Plan Form, and (i) Maintenance Cost Table [7].
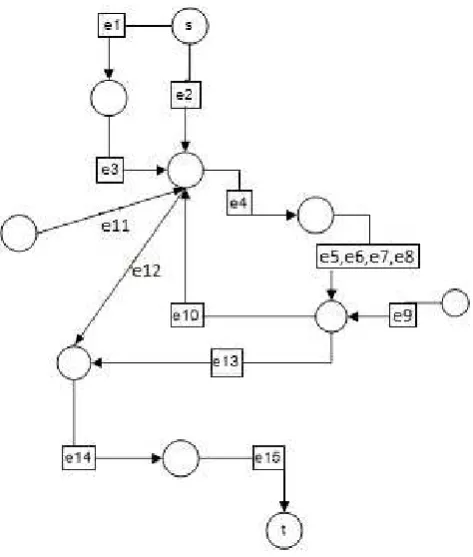
The sequence of data entries (numbers: 1,2, . . . ,9) and the data analysis activities are carried out on/through whole interface of the planning part (a,b,...,f) see Fig. 1. According to the model, circumstance enumeration requires the production of all operating circumstances and determines a probability for each. The reliability of the terminal Hubs,t is obtained by summing all the 2m probabilities of circumstance of G, which is sufficiently efficient in solving the problems inherent in measuring the reliability of the role of a provision directly [17]. Enumerate the perfect circumstance with G from the connect-s, t as Fig. 2, each edge corresponding to the number of activities: e1 = 1,e2 = 2,e3 = 1a and so on, which can be tabulated as Table 1.
Furthermore, the minimum of the set of paths is called min-path, and it becomes a tree with root s with all arcs pointed from the root, X = {s} is the set of nodes in the spanning-tree T ⊆E, whileC ⊆E is the set of edges which is left as a candidate for inclusion in the spanning-tree, up to C =E [13]. Next, suppose min-path fromGis registered. Suppose that the event that all edges are within min-path operates, and suppose P r[] denotes the probability of an event. Then reliability is none other than the probability that one or more events {Ei} occur, with which {Ei}is a jointed event, and therefore cannot simply summarize its probability. So in particular
4
Figure 2. Connect-s, t graph of the planning interface in KRM
Table 1. Enumerate perfect circumstance Code Number Sequence of Edges
1 e1e3e2
2,3,4,5 e1e3e4(e5, e6, e7, e8)e9 6,7,8,9 e1e3e4(e5, e6, e7, e8)e10e2 10,11,12,13 e1e3e4(e5, e6, e7, e8)e11 14,15,16,17 e1e3e4(e5, e6, e7, e8)e10e12e14e15
. . . and so on
whereas
An(G) =P r[E1∨E2∨. . .∨En], (3)
and then based on the concept of Eq. (1) we have
An(G) = k
j=1
(−1)j+1 I⊆{1,...,k},|I|=j
P r[Ei] (4)
with Ei being the event for all paths Pi with i ∈ I operating. Therefore, interfaces with each other can be disclosed are not interdependent based on how the system works. Suppose Ei indicating the complement of events, the declared events, and generally written Di = E1∩E2∩. . .∩En [17], and therefore we have
An(G) = h
i=1
5
1234567890‘’“”
10th International Conference Numerical Analysis in Engineering IOP Publishing IOP Conf. Series: Materials Science and Engineering 308 (2018) 012042 doi:10.1088/1757-899X/308/1/012042
The calculation of values for interface performance can be performed using Eq. (5) by substituting each interface probability value for error in data entry or process or by using edge based on Table 1. For example for interface 1 there is the data entry consists of 9 items, the probability of failure is 1/9 and the probability of success is 8/9, for interface number 1a there is a data entry is 20 items, the probability of failure is 1/20, and so on. So system reliability indicating regulatory toughness, the both can be measured at once.
5. Conclusion
The enumeration model of interface reliability of an information system using graph, logic, and probability concepts showed a good or not application interface. Using the case of the planning section interface of KRM system can be considered good because the failure factor is considered small according to the perfect enumeration that has been performed on each interface units in accordance with the data flow requirements in this system. It also illustrates that regulations set up to enforce KRM system are also considered good.
References
[1] L Harnefors, and H-P Nee 1998 Model-based current control of AC machines using the internal model control methodIEEE Transactions on Industry Applications14(1).
[2] M K M Nasution, and M S Lydia 2005 Metodologi pengelolaan proyek sistem informasi al-Khawarizmi: Journal of Computer Science1(4).
[3] J Preece, and H D Rombach 1994 A taxonomy for combining software engineering and human-computer interaction measurement approaches: Towards a common framework International Journal of Human-Computer Studies41(4).
[4] I Sommerville 1992Software Engineering, Addison-Wesley Publishing Company, Wokingham.
[5] A A Abdel-Ghaly, P. Y Chan, and B Littlewood 1986 Evaluation of competing software reliability predictions IEEE Transactions on Software EngineeringSE-12(9).
[6] S N Weiss, and E J Weyuker 1988 An extended domain-based model of software reliabilityIEEE Transactions on Software Engineering14(10).
[7] M Harahap, and M K M Nasution 2005 Model dan enumerasi pengukuran kinerja antarmuka aplikasi Kabupaten Road Management Systemal-Khawarizmi: Journal of Computer Science1(2).
[8] P. G. W. Keen 1981 Information systems and organizational changeCommunication of the ACM24(1). [9] M Elfida, and M K M Nasution 2005 Perancangan antarmuka sistem informasi al-Khawarizmi: Journal of
Computer Science1(1).
[10] A R Dennis, J F George, L M Jessup, J F Nunamaker, and D R Vogel 1988 Information technology to support electronic meetingsMinneapolis12(4).
[11] J D Musa, A Iannino, and K Okumoto 1987 Software Reliability: Measurement, prediction, application, McGraw-Hill Book Company, New York.
[12] O Wing, and P Demetriou 1964 Analysis of probabilistic networksIEEE Trans. Commun. Tech.COM-12. [13] L Fratta, U G Montanari 1973 A Boolean algebra method for computing the terminal reliability in a
communication networkIEEE Trans. Circuit TheoryCT-20.
[14] D B Brown 1971 A computerized algorithm for determining the reliability of redundant configurationsIEEE Trans. Commun. Tech.R-20.
[15] F Harary 1972Graph TheoryAddison-Wesley Publishing Company, Reading, Massachusetts.
[16] E Canale, H Cancela, F Robledo, G Rubino, and P Sartor 2012 On computing the 2-diameter-constrained K-reliability of networks International Transactions in Operation Research20(1).