222
THE EFFECT OF MOTIVATION AND LEARNING EFFECTIVENESS ON QUALITY OF GRADUATE STUDY PROGRAM PRIMARY
TEACHER EDUCATION FKIP UNIVERSITY OF JAMBI
Yusdi Anra19
Abstract: This research was conducted to find out information and learning learning to the quality of study program S1 PGSD FKIP University of Jambi. This research uses survey method with correlational approach. The in place of this research is the study program S1 PGSD FKIP University of Jambi with the number of affordable population as much as 325 graduates. Data collection using questionnaire instrument. The sampling technique is done randomly with the following steps: First, calculate the target population of all PGSD S1 FKIP courses in Jambi University; second, the number of people reachable by lottery gives the order number; third, selecting 20 random people in statistics to try; Fourth, select 50 random people in the sample to sample the research. This research produces; (a) There are factors influencing the feasibility of PGSD S1 FKIP Universitas Jambi; (b) There are many things that affect the quality of graduates. The implication of this research is the effort to improve the quality that can be done by improving the motivation and study of the students of PGSD S1 FKIP Universitas Jambi.
Keywords: Quality of graduates, motivation, effectiveness of learning
19
223 PRELIMINARY
Law No. 20 of 2003 on National Education System article 3 states that national education can develop capacity a and also the character and civilization of a dignified nation in order to educate the life of the nation, the goal for the development of the potential of learners to become human beings who believe and piety to God Almighty, have noble character, healthy, knowledgeable, capable, creative, independent, and become citizens a democratic and responsible state.
Education is a very important aspect to build the civilization of the nation, especially Indonesia. With a population of more than 230 million, extended is not supported by a strong educational base, then the large population will only be a burden to be the foundation of development. Information tools used by many people, learners, learning process programs (curriculum), management and especially quality. Because the core of education in PBM, then has a very decisive role. Moreover, decentralization policy gave birth to a new paradigm in the education system, the success or failure of decentralization is determined by management. The ability factors as managers in producers, at universities and universities are decisive, lecturers are demanded and also improve their abilities by expanding their horizons of thought, work ethic and responsibility. Therefore education coaching is not only used in all civitas academica, also directed to the development of teaching and learning process, especially the improvement of science, educational technology and
responsibility of the leadership as the responsible lecturers concerned in the study program.
According to Rusdi (2004: 2) the fast-paced changes in people's lives, due to the development of science and technology, as well as the various demands of the needs of various sectors greatly affect the development of the environment. Educational institutions as an open system, as a social system and as agents of change, must not only be sensitive and adaptable, but should also anticipate developments that will occur within a certain period of time.
Furthermore, in saying Rusdi (2004: 3) one of the effective strength in the management of educational institutions that play an important role and responsible in the face of change is leadership, the behavior of leaders and lecturers in the classroom that is able to initiate new thinking in the process of interaction within the university. By making changes or compilation of objectives, goals, configurations, procedures, inputs, processes or outputs of an institution in accordance with the demands of development. Essence is motivation and effectiveness in teaching.
224 the achievement of student achievement.
Edwar Sallis (1993: 22) says that quality is the authenticity of a good, quality is something that can not be negotiable. Kualiats are used through the highest standards that can not be exceeded by customers' desires and customer needs. Furthermore Lindasay and Petrick (1974:74) define quality as a total separated for customer needs. The point is unification of vision in improving quality by having various dimensions that is; (1) dimensions of product quality include, performance, keistemewaan, estitika and excellent quality; (2) service quality dimension taking into account time, consumer, punctuality, completeness of items, consumer honor, consistency and ease of getting service, timeliness of service, quick problem solving. Furthermore, it is said Lindasay and Petrick (1974: 54) that the total in quality contains three meanings namely; includes every process, every position, and every human being involved in it.
Drost in Fandy and Anastasia (2001: 12) defines. That the quality of graduates is a person who thanks to his education and experience capable and able to associate with any group, critical, ethical and moral. In the context of education, universities in demand are able to produce quality graduates with a number of characteristics that are: Critical and academic achievement, kriatif, independent and able to learn to produce graduates who knowledge and knowledgeable.
Furthermore, Joko Purwanto (1999: 51) said. That education is like
a social program, education is inseparable from the environmental conditions of society, government and private. In order for educational programs to work well, it is not enough to create good educational programs. However, community empowerment strategy is needed to give more authority to the community in controlling the formulation, implementation, and evaluation of education programs. Furthermore, in Joko Purwanto (1999: 54) the high quality of graduates can only be generated by the integration between the curriculum, faculty, organizational institutions and the community as constituents.
Based on the above description collected from some writings of experts can be concluded. That the quality of graduates is the level of excellence and privileges of graduates of educational institutions that are very satisfactory institutions of the graduate users.
Furthermore Gibson et al (2006:132) defines achivement motivation as the concept we use when we describe the forces acting on or within an individual to initiate and direct behavior. Motivation is defined as a concept we use when we describe actions within a person to initiate and direct behavior. The above definition describes the differences of an intensity of behavior and also indicates the direction of a behavior.
225 content theories and process theories. Content theory focuses on the factors that exist within a person, in which factors are factors that drive, direct, maintain and stop behavior, or as factors that determine the specific needs that can motivate employees. While process theories describe and analyze how the behavior is driven, directed, guarded and stopped by the main external factors of a person. Furthermore it is said that motivation refers to behavior in improving quality.
Furthermore Edwin B. Flippo in Hasibuan (2001:143) defines the motivation "direction or motivation is essence, it is a skill in aligning employee and simultaneousty with attainment or organizational objectives". Motivation is an expertise in directing employees and organizations to work successfully, so that the desire of employees and organizational goals as well as achieved.
Robbins (1991:192) provides a definition of motivation that is willingness to do a higher level toward the goals of the organization, conditioned by the ability of a business needed to achieve satisfaction. Willingness to act reflects something that can be seen. The results of motivation are generally assessed by the behaviors shown, the amount of effort spent, or the preferred strategy used to complete a job or task. The real effort is the result of motivation related to doing it directly.
Based on the above description can be concluded that the motivation is the desire in the individual to carry out the tasks that arise from within and from
outside in a person, to achieve better quality in achieving goals.
The effectiveness in this study entirely refers to Gibson et al. According to Gibson et al (1996:25-34) effectiveness can be done at the level of individuals, groups and organizations. In relation to the title of this study, this perspective perspective is more emphasized at the individual level. Furthermore, effectiveness in this perspective is defined as a form of assessment made in relation to the work performance of individuals, groups and organizations. The closer they are to their achievements, the more effective they are in assessing their work.
The most basic level of identity effectiveness is individual effectiveness. In this perspective emphasizes the execution of the duties of workers or members of the organization, the tasks that must be carried out are part of the work or individual position within the organization. Managers routinely assess individual effectiveness through the process of achievement evaluation. This evaluation becomes the basis for salary increases, promotions and other types of rewards provided by an organization.
226 a function of individual effectiveness and group effectiveness.
Student effectiveness includes ability, expertise, knowledge, attitude, motivation in learning. So the difference in this case leads to differences in the effectiveness of individuals in learning. Especially in this study the effectiveness of student learning is defined as the ability of students in managing time in learning, doing tasks and lectures.
Winkle (1996:53) suggests the definition of learning is a mental or physical activity that takes place in an active interaction with the environment that results in changes in knowledge, understanding, skills, values and attitudes. The changes are relative, constant and scarred. In line with Winkle. Purwanto (1993:85) says there are four kinds of understanding of learning, that is; (1) learning is a change of behavior. Usually the change can lead to better behavior, (2) learning is a change that occurs through practice or experience, (3) learning is a change in long priodesasi, (4) behavior that changes because of learning aspects personality, physical and physical as well as the skills and habit of solving a problem.
Furthermore, Calhoun and Acocella (1993:200-208) say that learning habits are as follows: Duration of study, the division of study time, place of study, the concentration of study time, learning attitude, way of learning. Based on the above description can be concluded that what is meant by the effectiveness of learning is the learning activities undertaken students both campus and at home that includes the time to learn,
place to learn, attitude and how to learn.
RESEARCH METHODS
This research uses survey method. The approach used is correlational approach. To obtain the primary data in the field used questionnaires are prepared based on the indicators that exist in the research variables. The questionnaire is designed to be directed to the graduates of the FGIP Jogi University's PGSD S1 course, as well as the analytical unit in the study. The target population used as the target of this study is a graduate of S1 PGSD. While the affordable population is alumni S1 PGSD FKIP University Jambi who has passed at least 2 years. Data analysis procedure in the form of questionnaires used to obtain research data; the influence of motivation and effectiveness of learning on the quality of graduate of PGSD S1 FKIP University of Jambi. Analysis of test requirements indicates that the score of each research variable has met the requirements for statistical testing. Hypothesis testing is done by calculating the path coefficient Py1, Py2. Line coefficient calculation is done by using SPSS softwer.
RESEARCH RESULT
Before the first analysis is done descriptive analysis. Descriptive analysis is intended to describe the description of the variables measured in this study which include: 1. Variables of motivation, 2. Variable learning effectiveness, and 3. Variable quality of graduates.
227 centralization of data and dissemination of data. The size of the concentration on the data includes the mean value of the count, mode, median. While the size of the data spread includes the range of data and standard deviation. The presentation of group distribution tables is presented to explain the description of research variables.
The variables measured in this study consist of endogenous variables and exogenous variables. Endogenous variable is the variable whose value is determined in the system under study in accordance with the theory model in the study. Endogenous variables in this study are the quality of graduates (Y), whereas exogenous variables are variables whose value is not specified inside, but outside the system under study. These exogenous variables determine the value of endogenous variables. Exogenous variables in this study include: Motivation (X1), and
Learning Effectiveness (X2). Both of
these exogenous variables can determine the Quality of the Graduate (Y) variable. Statistics descriptions start from the Graduates Quality (Y) variable, then the Motivation Variable (X1), and the Learning Effectiveness
(X2) variable.
1. Description of Data on Graduate Quality
Based on the primary data obtained in the field about the quality of graduate S1 PGSD FKIP Jambi University, the respondent can answer questions with the highest score of 154 and the lowest score is 101 with a score range 53. While the total theoretical score is 31 to 155.
From the calculation results obtained average score (mean) of 136.94 with median value of 137.91.
While the values often appear (mode) is 138.50. This shows that the average scores of respondents, middle values and values most often appear not so much different. In addition, sample variance was obtained for 128.10 and standard deviation (SD) of 11.32.
Based on the calculation results obtained the number of interval classes as much as 6.61 with a class distance of 8.02. Furthermore, the frequency distribution of the data of the quality variable of the graduate of S1 PGSD FKIP University of Jambi can be seen in
table 1.
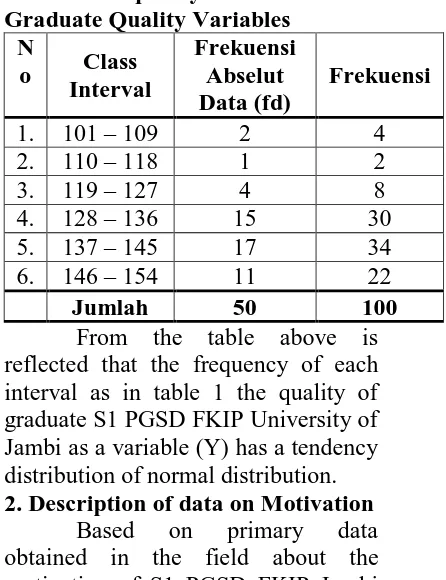
Table 1. Frequency Distribution of Graduate Quality Variables
N
o Class Interval
Frekuensi Abselut Data (fd)
Frekuensi
1. 101 – 109 2 4 2. 110 – 118 1 2 3. 119 – 127 4 8 4. 128 – 136 15 30 5. 137 – 145 17 34 6. 146 – 154 11 22
Jumlah 50 100
From the table above is reflected that the frequency of each interval as in table 1 the quality of graduate S1 PGSD FKIP University of Jambi as a variable (Y) has a tendency distribution of normal distribution. 2. Description of data on Motivation
228 score range 50. While the total theoretical score is 23 to 155.
From the average data score (mean) 89.06 with a mean of 87.04 while the most frequent value appears (mode) is 84.17. In addition, the sample variance score of 159.98 and standard deviation (SD) was 12.65. Furthermore the frequency distribution of data of motivation variable of Prodi S1 PGSD FKIP Universitas Jambi can be seen in table 2.
Table 2. Distribution of Motivational Trends interval as in table 2 motivation of S1 graduate of PGSD FKIP University of Jambi as variable (X1) has tendency of
distribution which is normal distribution.
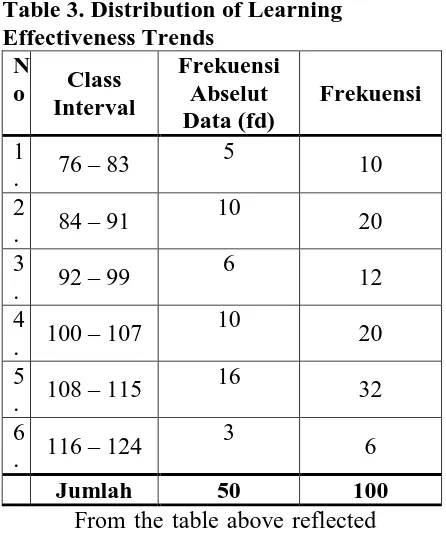
3. Description of Data on the Effectiveness of Learning
Based on the measurements of the effectiveness of learning, obtained data with the highest score of 121 and the lowest score is 76 with a score range of 45. The theoretical (mean) range of scores is 27 to 135.
Mean score of learning effeciency (mean) is 100,82 with median value 104,88, meanwhile score is most common (mode) is 109,74. This indicates that the mean scores (mean), middle values and values most often appear (mode) are not so much different. In addition, the value of sample variance was 149.99 with standard deviation (SD) of 12.25. Furthermore, the frequency distribution of variable data of efiekvitas of study of S1 PGSD FKIP Universitas Jambi can be seen in table 3.
Table 3. Distribution of Learning Effectiveness Trends in table 3 eftiekvitas learn S1 graduate PGSD FKIP University of Jambi, as variable (X2) has tendency of
distribution which is normal distribution.
RESEARCH RESULT
229 data analysis by using path analysis, firstly done some statistical test which is requirement in path analysis.
1. Test of Estimated Error Normality a. Test of Normality of Estimates of Graduates' Quality of Motivation Result of calculation of error normality of Y - Ŷ estimation got L0 max = 0,10, meanwhile Lt = 0,11. The
normal requirement is L0 max Lt
thus the Y - tak estimated error is from a normally distributed population. b. Test of Normality of Estimates of Graduates' Quality of Learning Effectiveness
Result of calculation of error normality of Y - Ŷ estimation got L0 max = 0,09, meanwhile Lt = 0,11. The
normal requirement is L0 max Lt
thus the Y - tak estimated error is from a normally distributed population. Table 4. Summary of data
normality test using Liliefors test
No Galat LO Lt Description
1 2
Y –Ŷ Y –Ŷ
0,10 0,09
0,11 0,11
Normal Normal
Description: Normal conditions: Lo
Lt
2. Homogeneity Test of Variance a. Homogeneity Test of Variance of Motivation Data (X1) with Quality of Graduates (Y)
Homogeneity of variance of graduate quality data on motivation tested using Bartlett test. Based on the calculation results obtained value X2count = 12.11 while X2table =
30.14. The data requirement called homogeneous is X2count X2table.
This means that the graduate-quality data group on motivation comes from a homogeneous population.
b. Homogeneity Test of Variance of Learning Effectiveness Data (X2) with
Quality of Graduates (Y)
Homogeneity of variance of graduate quality data on study effectiveness tested using Bartlett test. Based on the calculation results obtained value X2hitung = 9.57 while
X2tabel = 33.92. The data requirement
called homogeneous is X2count
X2table. Means that graduate quality
data on the effectiveness of learning comes from a homogeneous population.
Table 5. Homogeneity Test of Graduate Quality Regression (Y) with Motivation (X1) and Effectiveness of Learning (X2)
Variable X2hitung X2tabel α =
0,05 Y atas X1 12,11 30,14
Y atas X2 9,57 33,92
3. Hypothesis Testing
a. Motivation (X1) with Quality
Graduates (Y)
Functional relationship between motivation (X1) and Graduate
Quality (Y) can be presented in the form of regression equation as
follows: Ŷ = 126,79 + 0,11 X1. To
test the hypothesis that there is a positive correlation between motivation (X1) and Quality of
230 variable of graduate quality (Y) is significant.
To test whether the regression equation is linear or not, it is necessary to test linearity with F test. The linearity requirement of what
regression equation when Fcount
Ftable. Based on the calculation results obtained Fhitung = 1.25 while
Ftable = 2.40 (dk pembilang = 28 dk
denominator = 20 and α = 0.05). Thus the regression Ŷ = 126,79 + 0.11 X1 is
linear.
Result of calculation of significance test and regression linearity test between motivation variable (X1) with
Quality Graduates (Y) can be seen in
table 6.
Table 6. List of ANAVA for Meaning and Linearity X1 with Y
Anava
Analysis db JK RJK
Fhitung Ftabel
= 0,05
Total (T) 50 943905 - - -
Regresi (a) Regresi b/a)
Sisa
1 1 48
937628,18 101,71 6175,11
937628,18 101,71 128,65
- 7,91*
-
4,20
Tuna Cocok Galat
28 20
3928,61 2246,50
140,31
2246,50 1,25 2,40
Information:
*: very significant regression (Fcount = 7.91> Ftable = 4.20)
: linear regression (Fcount = 1.25 <Ftabel = 2.40)
From the above calculation results obtained Fhitung = 7.91, while at α = 0.05 Ftabel = 4.20. Because Fcount> Ftable then the regression is very significant. In the linearity test of simple linear regression equation, the calculation results show the value Fcount = 1.25 and Ftable = 2.40. Because Fcount <Ftabel then the model of linearity equation of motivation (X1) on graduate quality
(Y) is linear and significant.
b. Learning Effectiveness (X2) with
Graduate Quality (Y)
The functional relationship between learning effectiveness (X1)
and Graduate Quality (Y) can be presented in the form of regression
equation as follows: Ŷ = 126,05 +
0,11 X2. To test the hypothesis that there is a positive correlation between
the effectiveness of learning (X1) and
the Quality of Graduates (Y), it is necessary to test the significance and linearity of the regression equation by using F test. The requirements of the
tested hypothesis is when Fcount
Ftable. Based on calculation result of regression significance test obtained value Fcount = 6.62 while Ftabel 4.20. This shows that the relationship between motivation variable (X1)
with variable of graduate quality (Y) is significant. To test whether the regression equation is linear or not, it is necessary to test linearity with F test. The linearity requirement of what regression equation when
Fcount Ftable. Based on the
calculation results obtained Fhitung = 0.90 while Ftabel = 2.40 (dk pembilang = 25 dk denominator = 23
and α = 0.05). Thus the regression Ŷ
= 126.05 + 0.11 X2 is linear.
231 vitas learn (X2) on the quality of
graduates (Y) known regression equation Y = 54.818 + 0.567 X2.
From the calculation results obtained values as presented in table 7 below:
Table 7. List of ANAVA for Meanability and Linearity X2 with Y
Information:
*: very significant regression (Fcount = 6.62> Ftable = 4.20)
: linear regression (Fcount = 0.90 <Ftable = 2.40)
From the above calculation results
obtained Fcount = 6.62 while at α =
0.05 Ftabel = 4.20. Because Fcount> Ftable then the regression is very significant. In the linearity test of simple linear regression equation, the calculation results show the value Fcount = 0.90 and Ftable = 2.40. Since Fcount <Ftabel, the model of linearity effectiveness of learning equation (X2) on graduate quality (Y)
is linear and significant.
DISCUSSION
Based on the calculation of the analysis of the influence of Motivation, and the Effectiveness of Learning to the Quality of Graduates, it can be proved that the research hypothesis is significant at the level
of α = 0.05. There is influence of each
exogenous variable to endogenous variable.
1. Motivation (X1) with Quality
Graduates (Y)
Based on primary data obtained in the field about the motivation of S1
PGSD FKIP Jambi University, the respondent can answer questions with the highest score of 114 and the lowest score is 64 with a score range 50. While the total theoretical score is 23 to 155.
From the average data score (mean) 89.06 with a mean of 87.04 while the most frequent value appears (mode) is 84.17. In addition, the sample variance score of 159.98 and standard deviation (SD) was 12.65.
The quality of graduate of PGSD S1 FKIP Jambi University, in the respondent can answer the question with the highest score is 154 and the lowest score is 101 with a score range 53. While the total theoretical score is 31 to 155. From the calculation results obtained average score (mean) of 136 , 94 with a median of 137.91. While the value that often appears (mode) is 138.50. This shows that the average scores of respondents, middle values and values most often appear not so much different.
Based on the calculation results obtained Fhitung = 7.91, while
at α = 0.05 Ftabel = 4.20. Because
Fcount> Ftable then the regression is very significant. In the linearity test
Anava Analysis db JK RJK Fhitung Ftabel
= 0,05
Total (T) 50 943905 - - -
Regresi (a) Regresi b/a)
Sisa
1 1 48
937628,18 85,37 6191,45
937628,18 85,37 128,99
-
6,62* 4,20
Tuna Cocok Galat
25 23
3062,08 3129,37
122,48
232 of simple linear regression equation, the calculation results show the value Fcount = 1.25 and Ftable = 2.40. Because Fcount <Ftabel then the model of linearity equation of motivation (X1) on graduate quality
(Y) is linear and significant.
2. Learning Effectiveness (X2) with
Quality Graduates (Y)
Based on the results of measurements on the effectiveness of learning, obtained data with the highest score of 121 and the lowest score is 76 with a score range of 45. The theoretical (mean) range of scores is 27 to 135. Average learning effectiveness score (mean) of 100.82 with value middle (median) of 104.88, while the most frequent score (mode) is 109.74. This indicates that the mean scores (mean), middle values and values most often appear (mode) are not so much different. In addition, the value of sample variance was 149.99 with standard deviation (SD) of 12.25
The quality of graduate of PGSD S1 FKIP Jambi University, in the respondent can answer the question with the highest score is 154 and the lowest score is 101 with a score range 53. While the total theoretical score is 31 to 155. From the calculation results obtained average score (mean) of 136 , 94 with a median of 137.91. While the value that often appears (mode) is 138.50. This shows that the average scores of respondents, middle values and values most often appear not so much different.
Based on the above calculation results obtained Fcount =
6.62 while at α = 0.05 Ftable = 4.20.
Because Fcount> Ftable then the
regression is very significant. In the linearity test of simple linear regression equation, the calculation results show the value of Fhitung = 0.90 and Ftabel = 2.40. Since Fcount <Ftabel, the model of linearity effectiveness of learning equation (X2) on graduate quality (Y) is linear
and significant.
CONCLUSION
Based on the description of the discussion of research results, then the conclusion in this study put forward as follows: (1) The calculation results obtained Fhitung =
7.91, while at α = 0.05 Ftabel = 4.20.
Because Fcount> Ftable then the regression is very significant. In the linearity test of simple linear regression equation, the calculation results show the value Fcount = 1.25
and Ftable = 2.40. Because Fcount < Ftabel
then the model of linearity equation of motivation (X1) on graduate
quality (Y) is linear and significant. This means that motivation affects the quality of graduates, if the motivation of lecturers run well against students in the KBM, then the quality of graduates will be better too. (2) Based on the calculation results obtained
Fcount = 6.62 while at α = 0.05
Ftabel = 4.20. Because Fcount> Ftable then the regression is very significant. In the linearity test of simple linear regression equation, the calculation results show the value of Fhitung = 0.90 and Ftabel = 2.40. Since Fcount <Ftabel, the model of linearity effectiveness of learning equation (X2) on graduate quality (Y)
233 PGSD FKIP University Jambi increasingly affect the quality of graduates.
BIBLIOGRAPHY
Anonim. 2007. Undang-Undang Nomor 14 Tahun 2005.
Tentang Guru dan Dosen.
Jakarta: Visimedia.
________. 2003. Undang-Undang Nomor 20 tahun 2003. Tentang Sistim Pendidikan Nasional. Jakarta: Balai Pustaka
Coulhoun, JF dan Acocella, JR. 1993. Psikologi tentang Penyesuaian dan Hubungan Kemanusian. (Alih bahasa Satnoko). Semarang: IKIP Semarang Press.
Fandy Tjiptono dan Anastasia Diana. 2001. Total Quality Management. Jogyakarta: Anda Gibson, James L, H. Donelly Jr. Jhon M. Ivancevich. 1996. Organisasi Prilaku Struktur Proses. Jakarta: Bina Rupa Aksara
________. 2006. Manajemen. Jakarta: Erlangga.
Lindsay, William dan Petrick. 1974. Total Quality and Organization Development. USA: ST Luce Press.
Joko Purwanto, Agus. 1999.
Problematika dan Strategi
Pendidikan di Indonesia dalam Era Pascamodernisasi (Suatu
Kajian Kebijakan). Jakarta:
Cakrawala Pendidikan. Universitas Terbuka.
Malayu S. P. Hasibuan. 2001. Manajemen Sumber Daya
Manusia. Jakarta: Bumi
Aksara.
Purbiyatno, Peodjijo. 2002. Hubungan Antara Gaya
Kepemimpinan Kepala
Sekolah dan Motivasi Kerja Guru dengan Kinerja Guru SMU Negeri di Wilayah Bogor: Tesis Program Pascasarjana Universitas Pakuan, Non Publisher.
Purwanto, Ngalim. 1993. Psikologi Pendidikan. Bandung: Remaja Rosda Karya.
Rusdi, M (2004). Studi Korelasi Kepempinan Kepala Sekolah dengan Disiplin Kerja Guru Terhadap Tanggung Jawab Guru Terhadap Tugas (Survei Pada Sekolah Menengah Umum Titian Teras Jambi). Tesis Program Pascasarjana Universitas Pakuan, Non Publisher.
Stephen P. Robbins. 1991.
Organizational Behavior,
Concepts, Controversies and
Applications. New Jersey:
Prentice-Hall.
Sallies, Edward. 1993. Total Quality Management in Education. London: Biddles Ltd.