www.elsevier.nlrlocaterjappgeo
Multi-component seismic surveying for near surface
investigations: examples from central Wyoming and southern
England
C.R. Bates
a,), D.R. Phillips
ba
Sedimentary Systems Research Group, School of Geography and Geosciences, UniÕersity of St. Andrews, Fife,
KY16 9ST Scotland, UK b
GeoQuest ReserÕoir Technologies, 3609 S. Wadsworth BlÕd., 5th Floor, DenÕer, CO 80235, USA
Received 25 May 1998; accepted 14 January 1999
Abstract
Within the crust, the weathered layer has been shown to contain some of the greatest values of shear wave velocity anisotropy. There are two main causes of this shear wave velocity anisotropy. In all rock types, anisotropy results from structural weaknesses commonly manifest as aligned open fractures. In sedimentary rocks, additional anisotropy can result from mineral or grain particle alignment and layering or bedding. Unconsolidated sediments also show this preferential particle alignment which causes ordered heterogeneity or anisotropy that can be described as transverse isotropy. Both forms of anisotropy can have significant implications not only for the strength of a material but also for the passage of fluids through it. Two case histories are presented that describe these forms of anisotropy in the near surface and the implications for environmental investigations. In central Wyoming, a downhole survey was conducted using 28 borehole locations
Ž .
instrumented with three-component 3C receivers and surface shear wave impact sources. The sandstone bedrock at the site showed anomalous areas of high shear wave anisotropy that were interpreted to be due to a dominant regional fracture pattern. In southern England, a downhole survey was conducted in two boreholes using an array of 3C receivers and both surface and down hole shear wave sources. At this site, the heavily overconsolidated Oxford Clay showed transverse isotropy due to the strong preferential particle alignment. Both examples illustrate the use of shear wave seismic studies for mapping near surface geological features that may have important impacts for environmental and hydrogeological investigations.q2000 Elsevier Science B.V. All rights reserved.
Keywords: Shear wave splitting; Anisotropy; Multi-component seismic; Environmental investigation
1. Introduction
In bedrock, where the hydrology is controlled by fractures and shear zones, these features
)Corresponding author. E-mail: [email protected]
often represent the dominant pathways for groundwater flow and contaminant migration. The fractures are typically sub-vertical to verti-cal and aligned with a dominant azimuth. The preferential alignment caused by unequal hori-zontal stress imparts anisotropy which, in its
0926-9851r00r$ - see front matterq2000 Elsevier Science B.V. All rights reserved.
Ž .
( )
C.R. Bates, D.R. PhillipsrJournal of Applied Geophysics 44 2000 257–273
258
simplest case, is known as transverse isotropy
Ž .
with a horizontal axis of symmetry TIH . Such a system is described using five elastic con-stants rather than the two Lame concon-stants for
´
isotropic media. In unconsolidated sedimentary sequences, an important environmental objec-tive is the mapping of clay and sand strata. In particular, mapping the continuity of clay layersŽ .
as barriers aquitards to contaminant migration is a principal objective in characterisation and remediation investigations. Preferential particle alignment in clay sequences also imparts anisot-ropy to the material that can be described as transverse isotropy but with a vertical axis of
Ž .
symmetry TIV . It is possible to measure the amount and type of anisotropy in rocks and unconsolidated sediments using seismic waves and in particular shear waves. The use of shear waves for this purpose will be a focus of this paper.
Shear waves are sensitive to different physi-cal properties of earth materials than are com-pressional waves. Many authors have noted the advantages in using shear waves in addition to compressional waves for near surface reflection
Ž .
seismics Clark et al., 1994; Dobecki, 1995 and
Ž
for deep seismics Domenico and Danbom,
.
1987; Corbin et al., 1987 . The advantages of using the shear waves for near surface investiga-tions include higher seismic impedance con-trasts at clay–sand interfaces, insensitivity to water table and increased resolution for detect-ing thin strata. However, these benefits are often not realised for several reasons. Shear waves are more difficult to generate than compressional waves and they usually are attenuated more rapidly in the near surface. Also, shear wave records are often contaminated by noise from other wave types such as surface waves. One of the major benefits of using shear waves is that they exhibit shear wave birefringence or shear wave splitting in anisotropic media. This prop-erty can be used to characterise rocks and their anisotropy and has been exploited in the oil and
Ž
gas industry for over 15 years Lynn and
Thom-.
sen, 1990; Mueller, 1991; Lynn, 1994 . In the
engineering and environmental fields, similar advantages can be demonstrated but have seen
Ž
limited use Hasbrouck, 1987; Rai and Hanson,
.
1988; Bates, 1991 .
1.1. Shear waÕe birefringence
Shear wave birefringence, or shear wave splitting, describes the action of a shear wave when it enters an anisotropic medium. The shear wave splits into two waves that travel at differ-ent speeds with differdiffer-ent polarisation directions along the same propagation path. The magni-tude of splitting and the polarisation directions of the split waves contain information about the anisotropy of the medium. Shear wave splitting has been comprehensively described in the liter-ature and for a thorough review, the work of
Ž .
Crampin 1985 is recommended.
1.2. Deep shear waÕe inÕestigations
In the hydrocarbon industry, most shear wave work has concentrated on a particular form of anisotropy in the ground described as azimuthal
Ž
anisotropy or TIH Winterstein, 1990; Crampin
.
and Lovel, 1991 . Such conditions are com-monly observed in naturally fractured hydrocar-bon reservoirs with vertical open fractures paral-lel to the maximum horizontal stress direction providing the dominant pathways for oil and gas
Ž
migration Heffer and Dowokpor, 1990; Teufel
.
and Farrel, 1992 . Shear wave surveys for oil and gas targets typically involve acquiring multi-component seismic data using
three-com-Ž . Ž .
ponent 3C geophones and one- or up to three component sources. For surveys with 3C geo-phones and 3C sources, a complete 9C data set is recorded. Identification of shear wave split-ting and its routine use in the hydrocarbon industry required a number of important
devel-Ž . Ž .
opments: 1 digital 3C recording systems, 2 high energy sources that could produce shear
Ž .
not only available for near surface investiga-tions but they are cost effective to use as well.
1.3. Near surface shear waÕe inÕestigations
Shear wave studies in the near surface have recorded some of the greatest values of shear
Ž
wave velocity anisotropy Crampin, 1990; Lynn,
.
1991 . However, few near surface shear wave surveys conducted over the last 10 years have been directed at measuring this feature. Rather, an emphasis has been placed on the fact that shear waves travel at slower velocities than compressional waves and, therefore, if they can be generated with the same frequency then an
Ž
increase in seismic resolution is possible Clark
.
et al., 1994; Dobecki, 1995 . This will hold true only if waves of the same frequency can be produced and the absorption per unit wave-length is the same for compressional waves and shear waves. Sadly, in practice this has rarely been observed. Before the advent of the
mini-Ž .
vibrators Christensen, 1992 , generating shear waves with sufficient energy and bandwidth for surveying to depths greater than 30 m was difficult as the only engineering shear wave source was the traction plate and hammer or
Ž .
some variation of this Mooney, 1974 . In addi-tion, because of the high costs associated with shear wave seismic, most near surface shear wave surveys have tended to record only a limited number of components rather than the full nine components.
One of the other potential uses of near sur-face multi-component seismic is in hydrocarbon surveys for naturally fractured reservoirs. In these types of survey, use is made of the shear wave splitting to determine directions and de-gree of fracturing within deep hydrocarbon reservoirs. One problem with these surveys is that measurements made at the surface must be used to infer changes at depth, thus the signa-tures imparted to the shear wave at depth have to pass through the surface layer before they are recorded. If the surface layers contain a high degree of anisotropy this can overprint the
ac-tual deep signal that is of interest. Therefore, a knowledge of the magnitude of surface anisotro-py is critical to interpreting the records for deeper information.
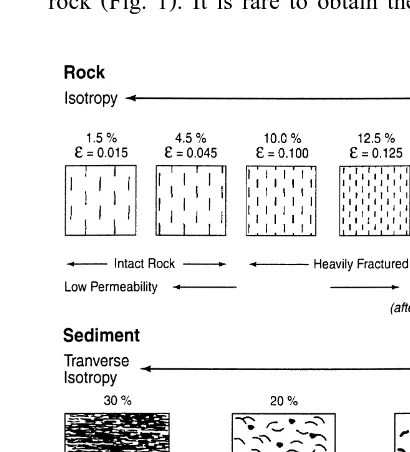
2. TIH, fracture anisotropy and anisotropic criticality
The magnitudes of shear wave and compres-sional wave anisotropy in hydrocarbon investi-gations range from background levels of 1–4.5% to anomalous levels of 25–30% recorded near
Ž .
some fault zones. Crampin 1994 has presented extensive data that suggest a correlation be-tween the magnitude of shear wave anisotropy and the magnitude of fracturing in a rock mass. According to Crampin, at background levels of anisotropy of 1–4.5%, the rock mass can be considered to be intact and discrete fractures are surrounded by largely uncracked, competent
Ž .
rock Fig. 1 . It is rare to obtain the quality of
Fig. 1. Schematic realisation of percentage shear wave
Ž
anisotropy and crack density in a fracture rock after
.
Crampin, 1994 together with a schematic realisation of
Ž .
( )
C.R. Bates, D.R. PhillipsrJournal of Applied Geophysics 44 2000 257–273
260
data necessary to record these background lev-els of anisotropy and a few percent anisotropy is often within the experimental errors associated with a field survey. The range of shear wave anisotropy between 4.5 and 10% represents a narrow band of fracture state that can easily be crossed by only small differences in local in situ stress inequalities. At values of shear wave ani-sotropy greater than 10% the rock is in a state of heavy fracture with a cracking so severe that a breakdown in shear strength may occur and increased flow of pore fluids is evident through the enhanced permeability. This theory of frac-ture criticality, above which the rock mass loses structural integrity and thus fluid flow becomes enhanced, has similarities to fluid percolation
Ž .
theory. Percolation theory Stauffer, 1985 is used to describe fluid flow in heterogeneous media. When occasional fractures are isolated in a medium of low matrix permeability, flow or permeability is near zero. As the density of fracturing increases, the amount of fracture in-terconnectivity increases. At a critical density of fracturing, interconnectivity is achieved and the fluid permeability increases significantly. Zones of high fracture density have been correlated with zones of anomalous high hydrocarbon pro-duction as is evident in the Austin Chalk
ŽMueller, 1991 . While the work of Crampin.
has been based in large part on deeper studies of crustal rocks where minimum stress directions are usually horizontal and not vertical there are implications of his work for the near surface where the minimum stress is usually vertical. Some important places in the near surface where the horizontal stress direction could be at the minimum are steep hillsides, rock cuttings and embankments and cliffs where instability is a sever engineering problem. In addition, vertical stress release would tend to accentuated hori-zontal weakness planes such as bedding.
Results from the hydrocarbon industry have
Ž
important ramifications for environmental near
.
surface investigation. For example, in the northeast of the US, there is a heavy depen-dence on groundwater production from
frac-tured bedrock. Similarly, in the southeast of England, there is a reliance on the naturally fractured chalk aquifers for approximately 70% of water supplies. Clean drinking water is pro-duced from fractures in these rocks but fluid contamination will also migrate along the same fractures. Typical well head protection pro-grammes use hydrogeological models based on circular capture zones. In a fractured system, this assumption is clearly invalid but currently few techniques are available to adequately de-scribe the fracture systems. Mini-vertical seis-mic profiles are suggested for mapping fractures which intersect boreholes, while mapping the fractures between the boreholes would require surface reflection and refraction studies. The following example details an investigation of naturally fractured sandstone in central Wyoming.
2.1. Central Wyoming fracture anisotropy study
Ž . Ž . Ž .
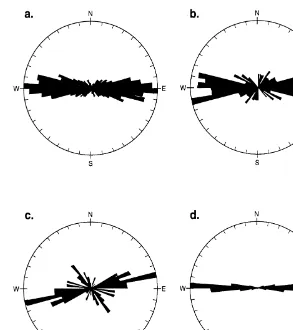
Fig. 2. Results of geological outcrop analysis for a structural trend of faults and fractures, b folds, c topographic linear
Ž .
features from aerial photo-lineament analysis. d shows the results of the down hole seismic survey for fast shear, S1 direction.
Ž .
area Fig. 2a and b . The results of an aerial
Ž .
photo-lineament analysis Fig. 2c also showed an approximate West–East trend in topographic linear features. The major topographic features in these arid badlands environment tend to fol-low the structural weaknesses in the bedrock. The regional water table is variable and incon-sistent at between 20 and 40 m depth.
2.2. Field procedure
As part of a three-dimensional 3C deep hy-drocarbon survey using dynamite sources, 28 boreholes were drilled over a 5 km2 area prior
to the main survey and fitted with 3C
( )
C.R. Bates, D.R. PhillipsrJournal of Applied Geophysics 44 2000 257–273
262
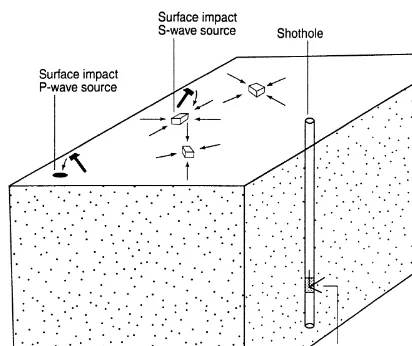
Fig. 3. Acquisition geometry for shear wave to borehole study in Wyoming.
wave polarisation data. Once the geophones had been deployed, the holes were back-filled and left to settle for three weeks before recording to allow the ground to recover from drilling distur-bances.
The acquisition procedure is illustrated in Fig. 3. For each buried geophone location, a minimum of three near offset shear and com-pressional wave source locations separated by 308 to 408 were surveyed. In addition, two far offset compressional wave source locations were used per hole for orienting the downhole assem-bly. The shear wave source consisted of a sledge hammer and 30 kg steel plate coupled to the ground using 15 cm long spikes. The plate was struck on each end to create shear waves of opposite polarity which aids in the identification of the shear arrivals. The source was located a distance of 3 m from the hole in both radial and transverse orientations. Striking the source ver-tically created the compressional waves. Seis-mic noise at the site was minimal as the nearest source of cultural noise was 2 km from the site.
The following sequence was used in the pro-cessing of the shear wave records. The orienta-tions of the horizontal geophone components were determined using arrivals from the two offset compressional wave sources to rotate the data into directions parallel and perpendicular to the plane of incidence between source and re-ceiver. One set of shear arrivals for both hori-zontal components at all the 28 stations is shown in Fig. 4a. The rotated data is shown in Fig. 4b. A final rotation following the method of Alford
Ž1986 was used to separate the fast and slow.
shear waves and to indicate the azimuth of fast shear wave direction. An example of the final data for one record after Alford rotation is shown in Fig. 4c. For each hole, a comparison of at least three source positions were made in order to give an estimate of the error in the recording procedure and the final azimuth and magnitude of shear wave splitting. The fast and slow shear wave time series were then cross-correlated over a 20 ms time window around the first breaks to obtain the time delay between
Ž .
fast and slow waves Fig. 4c . The final output was a measure of the azimuth of fast shear wave, the time difference between fast and slow shear waves and the magnitude of anisotropy in shear wave velocity.
2.3. Results
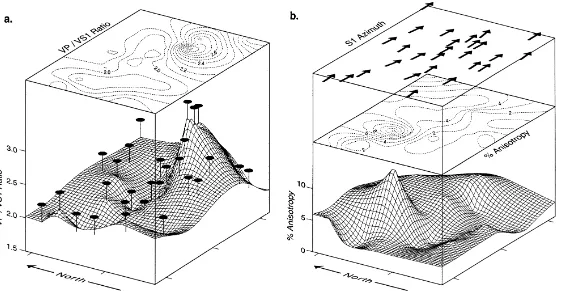
The results for all 28 geophone locations are displayed as contour maps. In Fig. 5a, the VPrVS1 ratio is shown. Only at one place in the survey did the VPrVS1 ratio exceed 3 and therefore, following the work of Sipos and
Mar-Ž .
shall 1995 it may be inferred that this is the only location which truly belongs to a highly weathered surface layer. For deep multi-compo-nent investigations, it is only at this location that compressional wave static solutions can not
Ž . Ž .
Fig. 4. a Example field record of shear wave data to both unrotated horizontal geophones for all 28 locations, b example of the same shear wave field records for both horizontal geophones after software rotation based on the compressional wave
Ž .
()
C.R.
Bates,
D.R.
Phillips
r
Journal
of
Applied
Geophysics
44
2000
257
–
273
264
Ž . Ž .
be used to construct shear wave solutions in the absence of specific shear wave data.
Fig. 5b illustrates the percent shear wave anisotropy and fast shear wave azimuth. The fast shear azimuth shows a consistent direction approximately West–East. This direction was also plotted on the rose diagram in Fig. 2d and shows a similar direction to that for the struc-tural geology and linear topographical trends. Thus, the fast and slow shear directions are interpreted to indicate a predominant weakness direction aligned approximately West–East in the surface rocks. The magnitude of shear wave anisotropy is a measure of the difference in velocity between fast and slow shear waves and is greatest in the northern half of the survey where values greater than 10% are observed. This, according to the work of Crampin, would represent a state of competency in the rock mass where fracturing is so severe that a breakdown in shear strength occurs and enhanced perme-ability or vertical fluid conductivity is inferred. Thus, vertical hydraulic conductivity is also greater at this location. This area would be flagged as anomalous during an environmental study and caution would be recommended with regard to well head protection and potential contamination or leak of hazardous waste in this area.
It should be noted that the location that con-tained the problem area for seismic static solu-tions is not the area of highest anisotropy with greatest impact for the environmental and engi-neering surveys. Nevertheless, the technique de-scribed here simultaneously addresses both problem areas. The variation in shear wave velocity anisotropy across the survey area is significant and indicates the potential for rapid variations in shear wave anisotropy in similar geological settings. It is interesting to note that the sampling grid for this survey was large and therefore the question remains whether closer sampling would have identified even greater variation in shear wave travel time anisotropy and if these near surface lateral variations are also seen at greater depth.
3. TIV, clay layering and aquitards
The geological feature that most influences near surface contaminant migration in unconsol-idated sediment sequences is the presence and continuity of clay layers. Beneath many indus-trial sites and landfills, contaminants have leaked into the groundwater and the migration of the contaminants is directly influenced by the per-meability anisotropy of the sediments. Clay lay-ers often inhibit migration and therefore repre-sent an aquitard or barrier to fluid movement. The degree to which the clay layer is a barrier is often dependent on the amount of clay particles in relation to sand particles within the layer and the distribution of the particles or the anisotro-py. The highest permeability anisotropy is usu-ally observed where the clay content is highest and shows the most distinct preferential clay particle alignment. This alignment is usually horizontal to sub-horizontal thus causing a per-meability anisotropy where fluid flow is less in the vertical direction than in the horizontal di-rection. Holes in clay layers, where either the clay content is reduced or the clay has been eroded, often represent sinks where contami-nants can leak through to deeper aquifers. Lo-cating these holes is critical to many site inves-tigations. It is postulated that for most clay deposited in dynamic environments, as the pro-portion of clay to other minerals, dominantly sands, decreases so will the degree of layer
Ž .
( )
C.R. Bates, D.R. PhillipsrJournal of Applied Geophysics 44 2000 257–273
266
The following example details a site investi-gation of an overconsolidated clay sequence in southern England to investigate the degree of transverse isotropy. The survey was conducted as an engineering experiment to determine the degree of anisotropy that could be associated with unconsolidated clay sequences. Such clays are often cited as excellent fluid contamination barriers and are used as such in many landfill sites.
3.1. Preferential particle orientation study
At a site near Purton, southern England, the Oxford clay, a heavily overconsolidated clay, is horizontally bedded to depths of greater than 100 m. Within this sequence, no significant lithological or structural boundaries are ob-served and a steep velocity profile has been recorded for both compressional and shear waves.
3.2. Field procedure
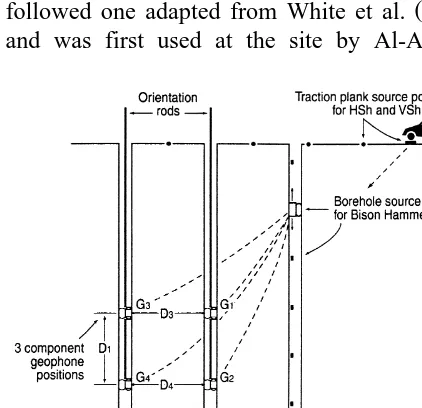
The field technique, illustrated in Fig. 6,
Ž .
followed one adapted from White et al. 1983 and was first used at the site by Al-Azzawi
Fig. 6. Acquisition geometry for surface to downhole study at Purton, southern England.
Ž1986 . An approximately square array of 3C.
geophones was clamped at sequential depths in two adjacent boreholes. The 3C geophone as-semblies were the OYO Borehole Picks with 28 Hz receiver elements. The azimuth of each 3C geophone assembly was controlled using orien-tation rods from the surface and the receivers themselves were clamped to the borehole walls using inflatable bladders. The surface shear wave source for horizontally polarised shear wave energy was a sledge hammer and traction plank weighed down by a vehicle. The source was struck on either end in order to correctly iden-tify the shear wave arrivals. In addition, each record was stacked and normalised in order to average out any inconsistencies in impact strength. In Fig. 7a, an example is given of the stacked shear wave arrival energy from a source position at the mid point between the two bore-holes to an array positioned with geophones at 20, 22, 24 and 26 m depths. Only the horizontal geophone that is aligned with the source is shown in this figure. A Bison Instruments Bore-hole Shear Wave Hammer was used for the down hole vertically polarised shear waves. This hammer is deployed in an adjacent borehole and then clamped to the sides of the borehole by a mechanical lever action. The hammer is then activated by rapidly sliding a weight against the clamped hammer thus inducing a vertically po-larised wave. An example from this source at a depth of 2 m to an array clamped with the top geophones at 18 m is given in Fig. 7b.
From the arrival times of waves generated by the sources at the surface and within an adjacent borehole, the phase and velocity for horizontally
Ž .
propagating, horizontally polarised waves hSh , horizontally propagating, vertically polarised
Ž .
waves hSv and vertically propagating,
hori-Ž .
Ž .
Fig. 7. a Example records for downhole shear wave arrivals from a horizontal shear wave source position between
Ž .
boreholes to geophones at 20, 22, 24 and 26 m depth on channels 1 and 5, 2 and 6, 3 and 7, 4 and 8, respectively, b example records from vertical shear wave source at 2 m depth to geophones at 18 m depth on channels 1 and 2 in the near borehole and 5 and 6 in the far borehole and to geophones at 27 m depth on channels 3 and 4 in the near borehole and 7 and 8 in the far borehole.
In addition to the field investigation, samples were obtained of the Oxford clay for laboratory analysis which included velocity logging for shear and compressional waves and analysis using an electron microscope to determine the particle fabric orientation.
3.3. Results
The results of the borehole shear wave sur-vey are plotted in Fig. 8a for arrays from the surface to 50 m depth together with those from
Ž .
a previous survey by Al-Azzawi 1986 from 50 to 90 m depth. The computed velocities for hSh and vSh are plotted together with the results for a standard cross-hole survey, hSv. Velocities recorded varied between 175 and 850 msy1.
Plotted in Fig. 8b are the calculated shear wave velocity transverse isotropy results that varied between 20 and 50%. These results fall within the range of transverse isotropy modelled by
Ž .
Kerner et al. 1988 with a strong velocity gradient in both the compressional wave and shear wave records. In Fig. 9, a view of the results from SEM analysis are shown for a vertical section of the clay obtained from a depth of 6 m. This image clearly shows the strong preferential alignment of the clay parti-cles in sub-horizontal orientation.
The results from the Purton site can be ex-plained in terms of a card deck model popular
Ž
in structural geology Hills, 1972; Thomsen,
.
impor-( )
C.R. Bates, D.R. PhillipsrJournal of Applied Geophysics 44 2000 257–273
268
Ž . Ž .
Fig. 8. a Downhole results for hSh, vSh and hSv for Purton site and b shear wave velocity anisotropy for the Purton site.
Ž .
Surface to 50 m depth from this survey together with those from a previous survey by Al-Azzawi 1986 from 50 to 90 m depth.
Ž . Ž .
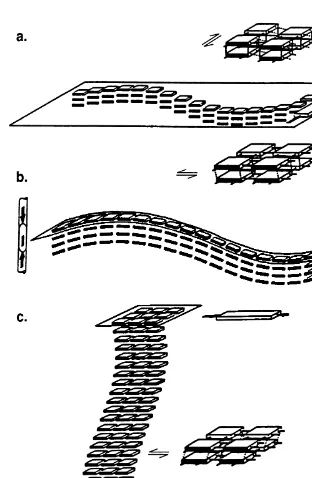
tance to the study of transverse isotropy using White’s method, namely hSh, hSv and vSh.
The hSh waves propagate in the horizontal direction with particle motion horizontal and entirely contained within the transverse planes.
This wave type will exhibit no additional shear wave splitting if the polarisation direction is perpendicular to the axis of symmetry. Within
Ž .
the card deck Fig. 10a , this is represented by a greater strength within each card than bonding
Fig. 10. Card deck model for shear wave propagation in transversely isotropic media showing individual card response and
Ž . Ž . Ž .
the impact source orientations. a Horizontal propagation, horizontally polarised waves hSh . b horizontal propagation,
Ž . Ž . Ž .
( )
C.R. Bates, D.R. PhillipsrJournal of Applied Geophysics 44 2000 257–273
270
between cards. Thus, flexure of each card or buckling within the layers is difficult and analo-gously, the velocity of a wave is high.
The hSv waves propagate horizontally but with the polarisation direction vertical and aligned with the axis of symmetry. On passage of this wave, particles are flexed and slip with respect to each other. The card deck analogy
ŽFig. 10b shows that flexure or bending a card.
deck along its length causes the cards to bend or fold with slip between individual cards and this requires less force than was required to buckle the cards during hSh deformation. The velocity of this wave is therefore predicted to be less than for hSh.
The vSh waves propagate vertically with hor-izontal polarisation and thus cause particles to once again slip over each other. Here, the verti-cal bonds between particles or the friction be-tween the cards controls the velocity or force needed for deformation. The card deck model
Ž .
predicts that vSh waves Fig. 10c and hSv
Ž .
waves Fig. 10b should have similar velocities and this is in fact what is found in the field
Ž .
study Fig. 8a . Furthermore, it is predicted that these should both be less than hSh waves and once again this was observed in the field. The cause of these variations is explained in terms of the preferential particle alignment of the clay minerals which was observed in the electron microscope images.
The directional variations in velocity, and hence elastic properties at this site, have impor-tant implications for engineering, hydrogeology and environmental investigations. For example, the likely permeability anisotropy that the pref-erential particle alignment in the clay causes will result in very different contamination breakthrough times horizontally vs. vertically. The seismic shear wave method provides a means to determine the amount of anisotropy in the field over a wide area and thus provides significant data for characterisation and remedi-ation actions at such a site or where a clay is to be used as a barrier, either natural or artificial, to fluid contaminant migration. Further work is
now needed to link the seismic anisotropy to the engineering properties and hydraulic flow rates at sites.
4. Discussion
The examples presented above illustrate the high degree of anisotropy in the near surface resulting from two very different geological fea-tures. In each case, the geological features could be described with seismic measurements using five elastic constants. The relatively simple symmetry system allowed shear wave energy to be easily identified as the records were uncom-plicated by mode conversion or additional split-ting. Unfortunately, such simplicity may not always prevail, and complex systems with up to the full 21 elastic constants may be necessary to describe the anisotropy. Such cases are not only beyond routine surveying today but would be prohibitively expensive even if the technology were readily available to make such measure-ments.
The Wyoming data identified an area of high
Žgreater than 10% shear wave anisotropy that.
would be described using Crampin’s criteria for
Ž .
would be described as an aquitard with high permeability anisotropy likely especially below 18 m where the shear wave anisotropy is great-est. Current work seeks to investigate the limits of thickness of clay layers where seismic shear wave anisotropy can be measured and the quan-titative relation between clay particle alignment, permeability anisotropy and seismic anisotropy. What is the future of multi-component seis-mic in near surface engineering and environ-mental work? Multi-component surveys are ex-pensive, but there is a subset of the multi-com-ponent survey that is applicable to near surface engineering and environmental problems that can be used effectively and cheaply. The amount of information to be gained from a multi-com-ponent survey is large and applicable to the near surface field. Applications can be found in engi-neering studies where dynamic property evalua-tion and the assessment of stability of slope conditions are critical. Also, in earthquake engi-neering a measure of shear strength, and its lateral and vertical variation, is important in the design of structures. In hydrogeologic studies, many groundwater resources are controlled by fractured bedrock or anisotropic clay layers. For example in a hydrogeologic study in the Madi-son Formation in the Black Hills region of
Ž .
South Dakota, Cheema and Islam 1994 found using standard engineering tests that the direc-tion of open fractures was closely associated with that of preferential fluid flow in a ground-water aquifer. Such studies now need to be accompanied by seismic investigations of the type outlined in this paper. In environmental investigations, preferential migration of contam-inants is controlled by the heterogeneity in the subsurface, specifically flow barriers formed by clays and conduits created by alignment of sand and gravel bodies. Shear wave surveys are also recommended at these sites.
The cost of full multi-component surface flection surveys using three orientations of re-ceivers and three orientations of source will always be high. However, the risks of acquiring
Ž
only a subset of the data one-component
.
recording can be large. Under certain circum-stances, such as the relatively simple anisotropic systems outlined herein and with a good knowl-edge of the existing geologic conditions, this risk can be limited and a successful survey will result. The use of borehole seismic in the form of fracture logging and shear wave vertical seis-mic profiles can provide further information on the possible anisotropic conditions and perhaps should be a pre-requisite to any surface reflec-tion work especially if one is to limit the num-ber of components that are measured in the field. To be able to understand and thus eventu-ally fully utilise multi-component seismic will require additional field data to document the relationships between geologic and hydrogeo-logic parameters and the seismic signatures. Such information should include studies where the seismic anisotropy has been recorded and information is available on the current in situ stress field, fracture orientations, preferential sediment particle alignment, hydraulic gradients and permeability anisotropy. Furthermore, addi-tional information on electrical and electro-mag-netic anisotropy should be integrated with the seismic anisotropy as the cause of the anisotro-py is likely to be linked. Unlike deep oil and gas seismic work where over the last 15 years, a good understanding has been gained of the geo-logical processes that cause seismic anisotropy, the causes in the near surface field are still being investigated. A great future therefore ex-ists for near surface multi-component surveys not only with respect to understanding the causes of near surface anisotropy, but also in helping to understand deeper data.
Acknowledgements
The original data recorded at the southern England site was recorded under NERC award
ŽGT4r86rGSr106 . A. Davis and J. Bennell.
( )
C.R. Bates, D.R. PhillipsrJournal of Applied Geophysics 44 2000 257–273
272
DE-AC21-94MC31224 and Eugene Lavely is thanked for software development and insightful commentary. Support from the oil and gas in-dustry partner is also recognised for access to the site.
References
Al-Azzawi, M., 1986. Shear Wave Propagation Character-istics in Anisotropic Sediments. PhD Dissertation, Uni-versity of Wales.
Alford, R.M., 1986. Shear Data in the Presence of Az-imuthal Anisotropy: Expanded Abstracts, Society of Exploration Geophysicists, 56th International Meeting, Dilley, TX, pp. 476–479.
Bates, C.R., 1991. Transverse isotropy in sedimentary sequences. In: Proc. Symposium on the Application of Geophysics to Engineering and Environmental Prob-lems, pp. 39–54.
Clark, J.C., Johnson, W.J., Miller, W.A., 1994. The appli-cation of high resolution shear-wave seismic reflection surveying to hydrogeological and geotechnical investi-gators. In: Proc. Symposium on the Application of Geophysics to Engineering and Environmental Prob-lems, pp. 231–245.
Cheema, T.J., Islam, M.R., 1994. Experimental determina-tion of hydraulic anisotropy in fractured formadetermina-tions. Bulletin of the Association of Engineering Geologists
Ž .
31 3 , 329–341.
Christensen, E., 1992. Small Vibrator Development. Ex-panded Abstracts, European Association of Exploration Geophysics, 54th International Meeting.
Corbin, R.J., Bell, D.W., Danbom, S.H., 1987. Shear- and compressional-wave surface and downhole tests in
Ž .
southern Louisiana. In: Danbom, Domenico Eds. , Shear-wave Exploration: Geophysical Development Se-ries, No. 1, Society of Exploration Geophysicists, pp. 62–78.
Crampin, S., 1985. Evaluation of anisotropy by shear-wave
Ž .
splitting. Geophysics 50 1 , 142–152.
Crampin, S., 1990. Alignment of near surface inclusions and appropriate crack geometries for geothermal hot-dry-rock experiment. Geophysical Prospecting 38, 621–631.
Crampin, S., 1994. The fracture criticality of crustal rocks. Geophysical Journal International 118, 428–438. Crampin, S., Lovel, J.H., 1991. A decade of shear-wave
splitting in the earth’s crust: what does it mean? What use can we make of it? What should we do next? Geophysical Journal International 70, 387–407. Dobecki, T.L., 1995. High resolution in saturated
sedi-ments — a case for shear-wave reflection. In: Proc. Symposium on the Application of Geophysics to Engi-neering and Environmental Problems, pp. 319–333. Domenico, S.N., Danbom, S.H., 1987. Shear-wave
tech-nology in petroleum exploration-past, current and
fu-Ž .
ture. In: Danbom, Domenico Eds. , Shear-wave Explo-ration: Geophysical Development Series, No. 1, Society of Exploration Geophysicists, pp. 3–18.
Hasbrouck, W.P., 1987. Hammer-impact, shear-wave
stud-Ž .
ies. In: Danbom, Domenico Eds. , Shear-wave Explo-ration: Geophysical Development Series, No. 1, Society of Exploration Geophysicists, pp. 97–121.
Heffer, K.J., Dowokpor, A.B., 1990. Relationship between azimuths of flood anisotropy and local earth stresses in
Ž .
oil reservoirs. In: Graham, Trotman Eds. , North Sea Oil and Gas Reservoirs Vol. 2, Norwegian Institute of Technology.
Hills, E.S., 1972. Elements of Structural Geology. Chap-man & Hall, London.
Kerner, C., Dyer, B., Worthington, M., 1988. Wave propa-gation in a vertical transversely isotropic medium: field experiment and model study. Geophyics Journal Inter-national 97, 295.
Lynn, H.B., 1991. Field measurements of azimuthal ani-sotropy: first 60 m, San Francisco bay area, and estima-tions of horizontal stress ratios from VS1rV . Geo-S2 physics 56, 822–832.
Lynn, H.B., 1994. Opening Address of 6th International Workshop on Seismic Anisotropy.
Lynn, H.B., Thomsen, L.A., 1990. Reflection shear-wave data collected near the principal axes of azimuthal anisotropy. Geophysics 55, 147–156.
Mooney, H.M., 1974. Seismic shear-waves in engineering. Journal of Geotechnical Engineering 107, 905–933. Mueller, M.C., 1991. Prediction of lateral variability in
fracture intensity using multi-component shear wave surface seismic as a precursor to horizontal drilling in the Austin Chalk. Geophyics Journal International 107, 409–415.
Rai, C.S., Hanson, K.E., 1988. Shear-wave anisotropy in sedimentary rocks: a laboratory study. Geophysics 53
Ž .6 , 800–806.
Sipos, Z., Marshall, R., 1995. Remarks on static correc-tions for S-waves. Journal of Seismic Exploration 4, 199–209.
Stauffer, D., 1985. Introduction to Percolation Theory. Taylor and Francis.
Teufel, L.W., Farrel, H.E., 1992. Interrelationship Be-tween Insitu Stress, Natural Fractures and Reservoir Permeability Anisotropy — A Case Study of the Ekofisk Field, North Sea. Presented at Fractured and Jointed Rock Conference, SRM Symposium.
International Meeting and Exposition, Society of Ex-ploration Geophysics, pp. 468–470.
White, J.E., Martineau-Nicoletis, L., Monash, C., 1983. Measured anisotropy in the Pierre Shale. Geophysical Prospecting 31, 709–725.
Winterstein, D.F., 1990. Velocity anisotropy terminology
Ž .
for geophysicists. Geophysics 55 8 , 1070–1088. Winterstein, D.F., 1992. How Shear-wave Properties