www.elsevier.com/locate/eja
Environmental e
ff
ects on linseed (
Linum usitatissimum
L.) yield
and growth of flax at di
ff
erent stand densities
R. Casa
a,
*, G. Russell
b
, B. Lo Cascio
a
, F. Rossini
a
aDipartimento di Produzione Vegetale, Universita` della Tuscia, Via San Camillo de Lellis, 01100 Viterbo, Italy
bInstitute of Ecology and Resource Management, University of Edinburgh, West Mains Road, Edinburgh EH9 3JG, UK
Accepted 2 July 1999
Abstract
The effect of environmental factors and stand density on linseed (Linum usitatissimumL.) yield was investigated by examining yield components and development rates from 4 years of field experiments carried out at Viterbo, Central Italy, in which different seed rates were tested. Spring sowings were carried out using the linseed cultivar ‘Mikael’. Growth analysis using the functional approach and modelling using the SUCROS model for potential production parameterized for linseed were used to carry out a more detailed analysis of environmental effects.
Linseed yields varied greatly in response to weather and soil type but showed very little effect of plant density. The crop was able to compensate for reduced stand densities mainly by increasing the number of capsules per plant. All yield components were significantly influenced by weather as represented by the year of sowing. Growth analysis showed that the unit leaf rate had higher values at lower stand densities, suggesting that self-shading at higher densities decreased the efficiency of the foliage. The environmental factors most likely to affect yields were high temperature, due to its effect on development rate, and the consequent shortening of the growing cycle and perhaps water shortage. The foliage duration was more important than the maximum leaf area index. © 1999 Elsevier Science B.V. All rights reserved.
Keywords:Growth analysis; Linseed; Stand density; Yield components
1. Introduction wider cultivation of this crop in Europe. It is a
species with low nitrogen requirements (Hocking et al., 1987), reducing the risk of environmental In the search for alternative species to increase
diversification of European cropping systems, flax problems. No specialized farm machinery is needed, as sowing and combine harvesting can be (Linum usitatissimum L.) for linseed production
has emerged as potentially interesting for a wide carried out with the same equipment as that used for winter cereals. It is adapted to a wide range of range of agro-ecological environments although it
certainly cannot be considered a new species, being environments, with Canada, Argentina and India being among the world’s largest producers. Seed one of the oldest cultivated plants of mankind.
There are several advantages that could come from flax, however, grows best in moderate to cool conditions, particularly during seed filling, and is thus essentially a crop for temperate regions.
* Corresponding author. Tel.:+39-0761-357-559;
Experiments carried out in controlled conditions
fax:+39-0716-357-558.
E-mail address:[email protected] (R. Casa) showed that high temperatures during the ripening
phase reduce the number of seeds per capsule and increasing the number of fertile tillers and of capsules (Diepenbrock and Iwersen, 1989). For the seed weight and decrease oil yield and quality
(Dybing and Zimmerman, 1965). Flax tolerates a spring-sown seed flax, there is less possibility of compensation due to the shortened vegetative wide range of soils, but grows best on well-drained,
medium to heavy textured soils, especially silty or phase (D’Antuono and Rossini, 1994). However, there is no general agreement on the optimal seed clay loams of about pH 6 (Hocking et al., 1987).
Although flax is not usually irrigated in Europe, rate for spring sown flax because of a strong interaction with the environment, including the it is susceptible to water stress at the seedling
stage, at flowering and during early seed develop- effect on establishment rate (Natarelli et al., 1995). For example Diepenbrock et al. (1995), in an ment (Martin et al., 1976). Rainfall or irrigation
late in the season can result in a flush of new tillers experiment in 15 locations in Germany and Switzerland, found that yield was unaffected by and leaves, causing uneven ripening (Diepenbrock
and Iwersen, 1989). In dry environments, irriga- seed rates varying from 200 to 800 seeds m−2 in the lowest- as well in the highest-yielding locations. tion at flowering and during grain filling
consider-ably increases yields as well as nitrogen-use In the other locations, low and high seed rates yielded less than intermediate rates of 400 and efficiency ( Tiwari et al., 1988; Dutta et al., 1995).
European linseed production is insufficient to meet 600 seeds m−2. Growth analysis and modelling provide a way of extending the results from tradi-the demand, so tradi-the EU is a major importer
( Venturi et al., 1994). The largest EU linseed tional agronomic trials because environmental and management effects can be analysed in more detail, producers are Germany, the UK and France with
an average harvested area of 74 000, 64 000 and but approaches of this kind seem to be lacking for seed flax agronomic work carried out in recent 47 000 ha, respectively, in the years 1995–1997
(FAO, 1998). Although seed flax has been extens- years. Flax response to temperature has been inves-tigated in the ripening phase in controlled condi-ively cultivated in Italy in the past, areas have
dramatically dropped in recent years. Unlike the tions (Dybing and Zimmerman, 1965). However, as the rate of development in flax has been shown major crops such as wheat, seed flax productivity
in Italy has increased less than 20% over the past to be linearly related to mean air temperature (D’Antuono and Rossini, 1995a), the effect of four decades ( FAO, 1998) largely because of the
lack of comparable crop-breeding efforts. temperature on the duration of growth might also have important consequences. Nevertheless, Genotype–environment interactions have been
shown to be high for flax grown in Central Europe studies on the effect of temperature during the vegetative phase in field conditions are lacking. (Diepenbrock et al., 1995), and yields vary
con-siderably between seasons, depending on location Agronomic studies on the effect of irrigation on linseed have been carried out by Indian authors in and weather.
It is therefore important to understand the main a completely different environment and using rather different management practices from those environmental causes of yield variation and to
determine the most important agronomic factors in Europe ( Tiwari et al., 1988; Dutta et al., 1995). Model simulations can be used to investigate that influence yield. Sowing time and seed rates
are certainly among the key agronomic decisions whether temperature or rainfall has the more important influence on yield. The SUCROS crop that have to be taken by farmers and researchers
in order to establish how optimal stand density growth model for potential production situations (Spitters et al., 1989) has been recently parameter-varies with the environment. Experiments carried
out to determine optimal sowing rates indicated ized for seed flax (Casa et al., 1997). The model was shown to simulate realistically the effect of that satisfactory yields can be obtained in a wide
range of stand densities, especially where it is sowing time and stand density on yields for trials carried out at Viterbo over several years. The possible to sow flax in autumn as in Southern and
flax to environmental factors in the field and to 1998. The plot size was increased in 1997 and 1998 evaluate how these responses may vary with stand to allow for periodic harvests for growth analysis. density. Growth analysis and modelling were used The distance between rows was 15 cm. Phosphorus as tools to extend the information obtainable from fertilizer was applied during seedbed preparation classical agronomic trials. using 92 kg P
2O5ha−1, and 80 kg N ha−1 was applied as urea, half 15 days after emergence and half at the beginning of stem elongation. Weeding
2. Materials and methods was carried out by hand. The emergence date was
established when 50% of the plants emerged, as Four field trials were carried out with the spring determined from counts carried out in 6 m lengths seed-flax variety Mikael, at Viterbo, Italy ( latitude of rows per plot each 2 days. The start of flowering 42°43∞N, longitude 12°07∞E, altitude 310 m) in the was taken to be the day when the first flower years 1995–1998. All the trials were carried out in appeared in the plots, which were visited at least the experimental farm of Viterbo University, in every 2 days. The components of yield, including different fields each year, with flax always following stand density, were determined at maturity using wheat. Soils in the area are rather heterogeneous, samples collected from an area of 0.3 m2per plot and the main soil characteristics of the plot used in 1995 and 1996 and 0.25 m2 in 1997 and 1998. each year are reported in Table 1. Plots were sown Growth analysis was carried out in 1997 and 1998 in March using sowing rates of 200, 400, 600 and by cutting o
ffat ground level all the plants in one 800 seeds m−2 in the first 2 years but only of 400 0.25 m
2 quadrat per plot per harvest. Harvests and 800 seeds m−2 in the other 2 years. The
were carried out weekly in 1997 and fortnightly in number of treatments was reduced to allow more
1998. These samples were dried in an oven at 80°C detailed growth analysis measurements to be
car-for 48 h and then weighed to determine the above-ried out. The amounts of seed used were calculated
ground biomass components. Green leaf area was for each target seed rate by taking into account
calculated (before drying) by using an electronic measured germinability, seed weight and increasing
area meter (Delta-T Devices, Cambridge, UK ) to by 20% to allow for possible emergence losses. In
measure the area of the leaves from a 10 plant all years, a randomized complete block design with
sub-sample and scaling up. In 1997 and 1998, the three replicates was employed. The plot size was
soil moisture content was measured gravimetrically 10.5 m2in 1995 and 1996, and 63 m2in 1997 and
by sampling to a depth of 40 cm in three separate layers (0–10 cm, 10–20 cm, 20–40 cm) with a
Table 1 cheese-type corer (3 cm core diameter). These
Soil characteristics (average 0–30 cm depth) measured in the values were converted to volumetric moisture fields used in the trials in different years
content using bulk density values, measured in the field at the end of the growing season at four
Year 1995 and 1997 1998
1996 points, for the same depth layers as the moisture samplings, using the excavation method (Blake
Bulk density (g cm−3) 1.21 1.05 1.17
and Hartge, 1986). Sampling for water content
Permanent wilting point (m3m−3) 0.11 0.16 0.22
was carried out in each plot weekly in 1997 and
Field capacity (m3m−3) 0.20 0.24 0.30
Coarse sand (%w) 35.4 37.3 31.1 twice weekly in 1998. Data were analysed by
Find sand (%w) 23.9 30.4 30.7 ANOVA. As no significant difference in soil
mois-Silt (%w) 24.2 14.4 12.5
ture between the seed rate treatments was found,
Clay (%w) 16.5 17.9 25.6
data from all the points were averaged to describe
Coarse fragment content (%w) 10.9 30.9 17.9
pH 6.9 6.7 7.3 the seasonal soil moisture trend. Available soil
Organic matter (%w) 1.8 2.1 1.1 water was computed from measured field capacity Total nitrogen (%w) 0.13 0.11 0.08
and wilting point data. These were obtained in the
Calcium carbonate (%w) 0 0 0
appara-tus, at 0.03 and 1.5 MPa, respectively (Richards stress or heat stress on seed yield was carried out using the potential growth version of the SUCROS and Weaver, 1943; Colman, 1947).
The yield components were analysed by crop simulation model (Spitters et al., 1989). The parameter values used and other information ANOVA separately for each year and by a
com-bined ANOVA over the years (Gomez and Gomez, about the application of SUCROS to linseed have been reported by Casa et al. (1997). The agro-1983) only for the 400 and 800 m−2 treatments,
after checking the homogeneity of the years’ error nomic input data, which were taken from the trials, were the date of emergence, the date when mean squares using Bartlett’s test (Gomez and
Gomez, 1983). Trends of above-ground biomass flowering began, and the stand density ( Table 2 and 4). Meteorological data were measured at the and LAI within each year were analyzed by
ANOVA RCB for each growth analysis harvest agro-meteorological station of Viterbo University experimental farm. Since this version of the model date in order to test the treatment effects. The
crop growth rate (CGR) and unit leaf rate ( ULR) takes no account of the soil water balance, the ratio between observed and modelled yield was were obtained using the functional approach to
growth analysis (Hunt, 1982). After conversion to used to indicate the importance of water shortage independently of any effect of high temperature natural logarithms to ensure homoscedasticity,
functions were fitted to biomass and LAI data, on the rate of development. Estimates of soil water deficit were only made in 1997 and 1998, so the and CGR and ULR were derived analytically. The
choice of function was based on F-tests of the rainfall between sowing and harvest was used as an index of water availability.
increases in sum of squares relative to increases in degrees of freedom moving from more complicated to simpler functions. The functions that were
chosen were polynomials of grade 2 for LAI and 3. Results Richard’s function for above-ground biomass. The
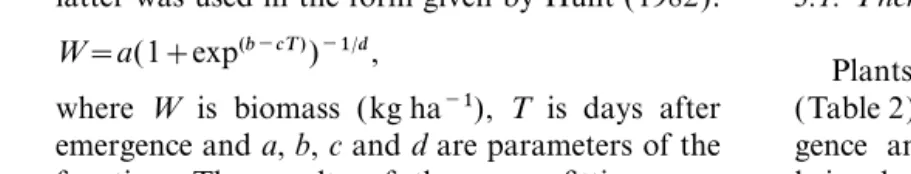
latter was used in the form given by Hunt (1982): 3.1. Phenology W=a(1+exp(b−cT))−1/d,
Plants emerged 12–19 days after sowing (Table 2). Flowering began 41–56 days after emer-where W is biomass (kg ha−1), T is days after
emergence anda,b,canddare parameters of the gence and lasted about 1 month, the duration being longest in the earliest emerging crop. The function. The results of the curve fitting were
tested by breaking up the residual sum of squares final harvest was carried out once the plants had lost all their green colour. Other phenological data into the ‘lack of fit’ and ‘pure error’ components
and by making sure by F-tests that the ratio of are given in Table 2. In 1997, plants were sown earlier and grew taller in comparison with the the respective mean squares was not significant
when the significance of the regression was tested other years. In 1996 and 1998, plants reached flowering with a reduced foliage area and height (Draper and Smith, 1981).
Estimation of the relative importance of water because of a shorter vegetative period. The base
Table 2
Main development dates of the experiment trials
Year 1995 1996 1997 1998
Sowing 22 March 22 March 6 March 18 March
Emergence 6 April 3 April 18 March 6 April
Start of flowering 24 May 18 May 13 May 17 May
Harvest 21 July 15 July 7 July 15 July
Emergence to flowering (days) 48 45 56 41
temperature for this phase was calculated to be opment and caused a shortening of the growing cycle as compared to cooler years such as 1997. 4.8°C using the method of Yang et al. (1995).
Using this value, the temperature sum from
emer-gence to beginning of flowering, calculated using 3.2. Yield components
the mean daily temperature, averaged 382°Cd
(degree days). The maximum LAI, which coincided Seed yields were rather low in 1995 and 1998, and only in 1997 did they exceed 2 t ha−1 with full flowering, was reached in 1997 and 1998
at about 400°Cd, which took 16 days fewer from (Table 3). Yield and plant height were significantly influenced by the year but not by the stand density. emergence in 1998 ( Fig. 1). The higher
temper-atures and dry conditions during the vegetative Particularly high yields were obtained in 1997 in spite of the difficult emergence period encountered development phase in 1998 thus accelerated
devel-which considerably reduced plant densities (Table 4). The proportion of seeds that developed into mature plants varied considerably from year to year and tended to decrease with seed rate (Table 4). The lowest proportion was 0.39 for the highest seed rate in 1995, and the highest was for the lower seed rate in 1998, when the stand density exceeded the target 400 plants (because of the 20% seed rate increase). The stand density at the highest seed rate ranged from 309 to 711. The soil and weather conditions at or after emergence were the
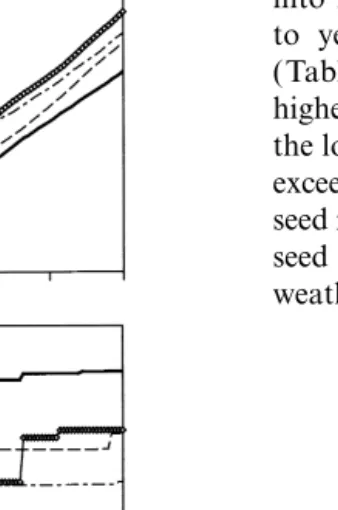
Fig. 1. Temperature, rainfall and soil moisture trends in the years of the field trials, plotted against days after emergence (DAE ). Top: temperature sum from emergence (base temper-ature=4.8°C ); middle: cumulative rainfall from emergence;
Fig. 2. Relationship between actual stand density and capsules bottom: fraction of available soil water (fASW ) in the 0–40 cm
layer (only for 1997 and 1998) calculated using absolute data per plant (top) and seeds per plant (bottom) for the four trial years.
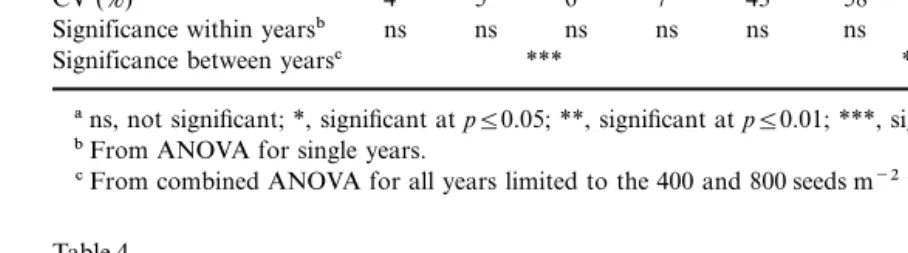
Table 3
Results of ANOVA for single years and combined for all years (only for 400 and 800 seeds in m−2treatments): yield and plant vegetative developmenta
Plant height (m) Seed yield (t ha−1) Harvest index (%)
1995 1996 1997 1998 1995 1996 1997 1998 1995 1996 1997 1998
Treatment
200 seeds m−2 0.40 0.63 – – 0.74 1.02 – – 43.9 27.3 – –
400 seeds m−2 0.42 0.64 0.60 0.45 1.13 1.27 1.99 0.98 46.1 28.4 38.7 31.5
600 seeds m−2 0.42 0.58 – – 1.01 0.97 – – 42.3 26.3 – –
800 seeds m−2 0.42 0.59 0.64 0.45 0.93 1.50 2.10 0.78 41.2 22.5 35.3 29.0
CV (%) 4 5 6 7 43 58 15 17 3 11 4 3
Significance within yearsb ns ns ns ns ns ns ns ns * ns ns ns
Significance between yearsc *** *** ***
ans, not significant; *, significant atp≤0.05; **, significant atp≤0.01; ***, significant atp≤0.001.
bFrom ANOVA for single years.
cFrom combined ANOVA for all years limited to the 400 and 800 seeds m−2treatments.
Table 4
Results of ANOVA for single years and combined for all years (only and 800 seeds m−2treatments): yield componentsa
Stand density (m−2) Capsules plant−1 Seed capsule−1 Seed weight (mg) 1995 1996 1997 1998 1995 1996 1997 1998 1995 1996 1997 1998 1995 1996 1997 1998
Treatment
200 seeds m−2 141 169 – – 12.0 16.6 – – 6.8 4.1 – – 6.5 8.7 – – 400 seeds m−2 232 232 216 423 10.8 14.8 16.8 6.5 6.5 4.4 6.9 4.9 7.2 8.3 8.1 6.7
600 seeds m−2 337 399 – – 6.9 8.5 – – 6.4 4.0 – – 7.0 7.4 – –
800 seeds m−2 309 711 345 622 7.2 7.5 12.7 3.8 6.1 3.4 7.0 4.8 6.8 8.1 6.8 6.7
CV (%) 30 15 9 38 16 24 12 34 3 23 4 14 3 4 8 2
Significance within yearsb ns * * ns * ns ns ns ** ns ns ns ns * ns ns
Significance between yearsc *** *** *** ***
ans, not significant; *, significant atp≤0.05; **, significant atp≤0.01; ***, significant atp≤0.001.
bFrom ANOVA for single years.
cFrom combined ANOVA for all years limited to the 400 and 800 seeds m−2treatments.
cause of this deviation from the planned stand of capsules per plant (r=−0.73**) and seeds per plant (r=−0.73**) ( Fig. 2). However, the number density. The years 1995 and 1997 were particularly
difficult. In 1995, the air temperature fell below of capsules per plant was significantly different only in 1995 ( Table 4). No correlation was found zero for 6 days during the period from sowing to
emergence, reaching−4°C. The minimum temper- between stand density and seeds per capsule, which were, however, significantly affected in 1995. ature in the 10 days after emergence was lowest in
1995 and 1997 (averaging 2.7 and 4.7°C, respec- Although the higher sowing rate resulted in about 40% fewer capsules per plant than the lower rate tively) as compared to 1996 and 1998 (averaging
6.2 and 5.8°C ). When the temperature dropped on average, the difference was only significant in 1995. From the combined ANOVA over the years, below zero, a surface crust was sometimes observed
on the soil. it was found that all traits were significantly influ-enced by the year ( Tables 3 and 4), but that only Yield components were more influenced by year
between year and stand density were never signifi- after the start of flowering, in 1997, whereas in 1998, it reached a plateau at 60 DAE, 19 days after cant (data not shown).
the start of flowering. In 1997, the 800 seeds m−2−2 treatment produced a higher and earlier maximum
3.3. Growth analysis
CGR than the 400 treatment. However, the final biomass was the same in both cases. In 1998, there In an attempt to understand the wide yield
variations occurring from year to year, the growth were no significant differences in above-ground biomass or CGR between the two stand densities. patterns of linseed were examined in detail in 1997
and 1998. These are representative of high and In 1998, for the first 40 DAE, the CGR of both treatments was similar to that of the low stand low yielding years, respectively. The fitting of
functions to transformed biomass and LAI data density one at the same date (not DAE ) in the previous year. However, the CGR reached its gave satisfactory results in general. In fact, the
‘lack of fit’ component of the residual mean square maximum and then declined. The above-ground biomass totalled about 700 g m−2in 1997 but only was never significant, and the regressions were
always highly significant, even if, in a few cases, about 300 in 1998.
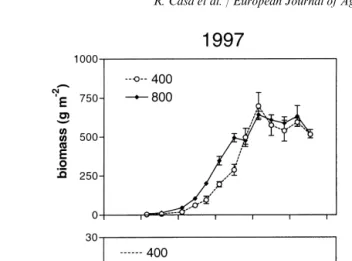
The leaf area index (Fig. 4) in 1997, especially standard errors of function parameters were rather
high (Table 5). Using temperature sum as the at the lower density, generally followed the typical linseed pattern in which the maximum LAI is independent variable, instead of DAE, did not
reduce the standard errors (results not shown). reached at flowering and subsequently declines due to senescence (Marshall et al., 1989). However, The time course of total above-ground biomass
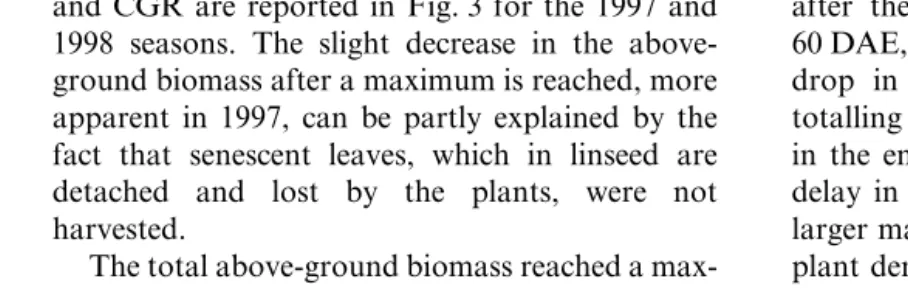
and CGR are reported in Fig. 3 for the 1997 and after the maximum LAI was reached at about 60 DAE, and senescence had started to cause a 1998 seasons. The slight decrease in the
above-ground biomass after a maximum is reached, more drop in green leaf biomass and area, rainfalls totalling 68 mm between DAE 76 and 80 resulted apparent in 1997, can be partly explained by the
fact that senescent leaves, which in linseed are in the emergence of new leaves and a temporary delay in the LAI decline. In 1997, a significantly detached and lost by the plants, were not
harvested. larger maximum LAI was produced by the higher plant density treatment: 2.2 (±0.23) compared to The total above-ground biomass reached a
max-imum 80 days after emergence (DAE ), i.e. 24 days 1.3 (±0.22) for the lower plant density. In 1998,
Table 5
Parameters of the curves fitted to the time course of natural logarithms and LAI. Richard’s function was used for biomass and polynomials of grade 2 for LAIa
Above-ground biomass LAI
1997 1998 1997 1998
Treatment 400 800 400 800 400 800 400 800
Parameters
a 8.68±0.08 8.70±0.04 7.91±0.08 7.85±0.10 −6.422±0.53 −6.554±0.48 −6.117±0.561 −5.831±0.912
b 7.72±2.19 8.58±1.65 7.69±3.76 8.73±6.74 0.179±0.023 0.23±0.02 0.273±0.034 0.283±0.056
c 0.12±0.03 0.15±0.02 0.18±0.08 0.20±0.14 −0.001±2E−04 −0.002±2E−04 −0.003±5E−04 −0.003±7E−04
d 5.50±1.83 7.36±1.63 7.00±3.91 9.75±8.41
n 39 39 21 21 27 27 12 12
r2 0.98 0.99 0.98 0.95 0.91 0.90 0.92 0.77
Significanceb *** *** *** *** *** *** *** ***
aFor parameters, see Richard’s function under ‘Materials and methods’.
Fig. 3. Trends of total above-ground biomass and crop growth rate (CGR) for 1997 and 1998 plotted against days after emergence (DAE ).
there were no significant differences between the to be shallow rooting (Hamdi et al., 1973) so the stress imposed must have been large, although, two treatments, and the maxima were low
(1.2±0.5) compared with the previous year. This since the plants survived, water must have been taken up from deeper in the soil. Gupta and reduction in LAI in 1998, as compared to 1997, is
even more striking when actual stand densities of Agrawal (1977) showed that seed flax can take up soil water from below 1.00 m. In 1997, there was the two years are considered ( Table 4). The area
of leaf per plant in 1998 was about one third of plenty of available water until well after full flowering.
the amount in 1997. ULR had a similar trend in
both years and was considerably higher in the The SUCROS model was run for the 4 years of trials ( Fig. 5). In terms of rainfall, 1996 was dry, lower density treatment.
1995 and 1998 was intermediate and 1997 was wet. In contrast to the results of Casa et al. (1997), the
3.4. Modelling the weather effects
modelled yields were overestimated at high stand densities, although they were close to the observed In 1998, not only was the weather during the
growing season hotter than in 1997, but cumulative yields when the stand density was lower. Indeed, there was a significant negative correlation (r=
rainfall was also considerably less (Fig. 1). In
1998, rainfall was no less than in 1997 for the first −0.70**) between the ratio of observed to mod-elled yield and stand density. The ratio for the 35 DAE. However, this period was followed by
32 days without rain, so a large water deficit lowest stand density (141 m−2) was 0.93, whereas the ratio for the highest (711 m−2) was 0.72. The developed. In fact, there was virtually no water
available for plant uptake in the upper 0.40 m of deviations from the regression line were not sig-nificantly correlated with rainfall.
Fig. 4. Trends of leaf area index (LAI ) and unit leaf rate ( ULR) for 1997 and 1998 plotted against days after emergence (DAE ).
below 0°C shortly after emergence, poor seedbed conditions, including those caused by frost, might also have contributed, as seed flax is very sensitive to this factor (D’Antuono and Rossini, 1995b; Diepenbrock et al., 1995). These observations con-firm that in Central Italy, the risk of frost in the early phases of crop development has to be taken into account for spring sowings.
Seed yields were not affected by stand density in the range tested, confirming the report of Albrechtsen and Dybing (1973), who found no significant yield differences for flax stands ranging from 100 to 700 plants m−2. In fact, the increase
Fig. 5. Ratio between observed and modelled yields for the
in the number of capsules per plant at lower stand
years 1995 ($), 1996 (%), 1997 (n) and 1998 (#) plotted
densities confirms, as has already been reported
against stand density. Simulations were carried out with the
for other environments (Dillman and Brinsmade,
model SUCROS as described in the text.
1938; Albrechtsen and Dybing, 1973; Diepenbrock and Porksen, 1992; Natarelli et al., 1995), that low 4. Discussion
numbers of flax plants are balanced by increased numbers of capsules per plant due to basal or The observed stand density varied greatly
inflorescence branching. The increase in capsules between years. Although low rates of emergence
effects of stand density on the number of capsules tions, there was no clear effect of rainfall on flax yield once the effect of stand density had been per unit land area.
Although the harvest index was greater for the removed. The results of the simulations are consis-tent with the hypothesis that temperature has a lower stand density than for the higher, in
agreement with the findings of Diepenbrock and large impact on yield through its effect on rate of development and thus on the duration of growth. Porksen (1992), higher stand densities did not
cause any increase in plant height (Dillman and The lower temperatures in 1997 slowed down the rate of development of the flax and extended the Brinsmade, 1938; Albrechtsen and Dybing, 1973).
The positive correlation between plant height and growing period compared with the other 3 years. However, the yields obtained suggested that yield, through the effect on both seed weight and
capsules per unit surface, shows the importance of water shortage did indeed reduce seed yields, even though it occurred towards the end of the growing adequate vegetative growth.
Growth analysis data showed, however, that cycle when its effect would have been reduced by mobilization of stem reserves and possibly by a even when the maximum LAI is less than 1.5, as
in the lower density in 1997, seed yields of almost greater water use efficiency of photosynthesis for stems and capsules than for leaves.
2 t ha−1can be obtained. ULR was higher for the
lower plant density treatment, so the higher effi- Another hypothesis is that the model underesti-mates potential yield and that yield was reduced ciency of the photosynthetic organs compensated
for the lower leaf area. This suggests that there by drought in all years. Increasing stand density would hasten the rate of depletion of available was significant self-shading at the higher stand
density. Although the CGR does not include root water and hence reduce the ratio of observed to modelled yields. The ratio should approach a biomass, the ULR in the early part of the growing
cycle was not considered to have been underesti- constant value because the relationship between canopy transpiration and stand density approaches mated by more than 30%with the error becoming
progressively smaller as flowering was approached. an asymptote. This hypothesis is also consistent with Fig. 5, although there are insufficient data to The values of ULR were similar to those observed
in Canadian trials carried out by Marshall et al. provide an unequivocal answer.
The farmer has to choose an appropriate seed (1989), although they reported a much higher
biomass (1500 g m−2) and CGR (50 g m−2d−1). rate and date of sowing. Although stand density did not have an important influence on yield in The value for CGR should be treated with caution,
however, since it is significantly larger than the the present work, the variable establishment rates suggest that care must be taken when recommend-highest short-term rate for C3 plants tabulated by
Monteith (1978). Marshall et al. (1989) also found ing seed rates in case the resultant stand density falls below the threshold where compensation is that a reduction in maximum LAI from 6.0 (wet
season) to less than 2.0 (dry season) resulted in a complete. Increasing seed rates to cover all eventu-alities is not an economically viable option because yield reduction of less than 10%, suggesting that
the optimum LAI is near 2.0. In our trials, ULR of the cost of the seed. Phenological simulation models can be useful aids in planning sowing dates did not differ much between 1997 and 1998,
although the maximum ULR, coinciding with the for seed flax to reduce the risks (D’Antuono and Rossini, 1995b) and it would be helpful to extend maximum LAI, was reached earlier in 1998. This
suggests that the main effect of heat and water them to take account of stand density and estab-lishment rate.
stress was on the LAI and not the ULR. In other reports, water and temperature stress have been shown to reduce ULR in linseed ( Tiver and
Williams, 1943; Marshall et al., 1989) by increasing 5. Conclusion respiratory losses.
expecta-D’Antuono, L.F., Rossini, F., 1995b. La probabilita` di danni
greatly in response to weather but showed very
da gelo su lino da olio (Linum usitatissimumL.) durante
little effect of seeding rate. The vulnerability of
l’emergenza: analisi territoriale nell’Italia centrale. Rivista
linseed plants in the establishment phase made it
di Agronomia 29, 550–556.
difficult to achieve the planned stand densities. Diepenbrock, W., Iwersen, D., 1989. Yield development in lin-The seed yields obtained in some years were rather seed (Linum usitatissimumL.). Plant Res. Dev. 30, 104–125. Diepenbrock, W., Po¨rksen, N., 1992. Phenotypic plasticity and
low compared to those typically obtained in
yield components of linseed (Linum usitatissimum L.) in
Central Europe (Diepenbrock et al., 1995) or even
response to spacing and N-nutrition. J. Agron. Crop Sci.
in Northern Italy (Natarelli et al., 1995). The
169, 46–60.
environmental factors most likely to be responsible Diepenbrock, W.A., Le´on, J., Clasen, K., 1995. Yielding ability for these yield reductions were high temperature, and yield stability of linseed in Central Europe. Agron. which caused significant yield losses due to its J. 87, 84–88.
Dillman, A.C., Brinsmade, J.C., 1938. Effect of spacing on the
effect on hastening development rate, and the
development of the flax plant. J. Am. Soc. Agron. 30,
consequent shortening of the growing cycle and
267–278.
possibly water shortage. From our data, it seems
Draper, N., Smith, H., 1981. Applied Regression Analysis.
that in Central Italy, the duration of growth is Wiley, New York. 709 pp
more important than the amount of foliage pro- Dutta, H.K., Ram Mohan Rao, D.S., Singh, H., 1995. duced in determining yield, although water deficits Response of linseed (Linum usitatissimumL.) to irrigation
and nitrogen. Indian J. Agron. 40, 130–131.
may also reduce crop growth rate in some years.
Dybing, C.D., Zimmerman, D.C., 1965. Temperature effects on
The possibility of extending the length of the
flax (Linum usitatissimumL.) growth, seed production and
growing period through earlier sowings seems,
oil quality in controlled environments. Crop. Sci. 5,
however, limited by the difficulties caused by low 184–187.
temperatures in the emergence phase. FAO, 1998. FAOSTAT Database. http://apps.fao.org
Gomez, K.A., Gomez, A.A., 1983. Statistical Procedures for Agricultural Research. Wiley, New York. 680 pp
Gupta, R.K., Agrawal, G.G., 1977. Consumptive use of water by gram and linseed. Indian J. Agric. Sci. 47, 22–26.
Acknowledgements
Hamdi, H., Youssif, S., El Samie, A.G., Ghazy, A., 1973. Root distribution patterns of flax plant under different soil
mois-This work was carried out in the framework of
ture stress. Egyptian J. Soil Sci. 13, 1–16.
the P.Ri.s.C.A. project of the Italian Ministry of Hocking, P.J., Randall, P.J., Pinkerton, A., 1987. Mineral nutri-Agricultural Policy. tion of linseed and fiber flax. Adv. Agron. 41, 221–296.
Hunt, R., 1982. Plant Growth Curves. The Functional Approach to Growth Analysis. Arnold, London. 243 pp Marshall, G., Morrison, I.N., Nawolsky, K., 1989. Studies on
the physiology ofLinum usitatissimumL.: the application
References
of mathematical growth analysis. In: Marshall, G. (Ed.), Flax: Breeding and Utilization. Kluwer Academic, Dor-Albrechtsen, R.S., Dybing, C.D., 1973. Influence of seeding rate
drecht, pp. 39–47. upon seed and oil yield and their components in flax. Crop
Martin, J.H., Leonard, W.H., Stamp, D.L., 1976. in: Principles Sci. 13, 277–280.
of Field Crop Production 3rd edition, Macmillan, New Blake, G.R., Hartge, K.H., 1986. . In: Klute, A. ( Ed.), Methods
York, pp. 797–811. of Soil Analysis. ASA-SSSA, Agronomy Monograph,
Monteith, J.L., 1978. Reassessment of maximum growth rates 363–375..
for C3 and C4 crops. Exp. Agric. 14, 1–5. Casa, R., D’Antuono, L.F., Rossini, F., 1997. Simulazione della
Natarelli, L., Fontana, F., Maestrini, C., Cremaschi, D., 1995. produzione potenziale del lino da olio (Linum usitatissimum
Influenza della densita` di semina sulla coltura del lino da L.) mediante il modello SUCROS. Applicazioni preliminari.
olio. L’Informatore Agrario 42, 33–35. Rivista di Agronomia 31, 624–633.
Richards, L.A., Weaver, L.R., 1943. Fifteen-atmosphere per-Colman, E.A., 1947. A laboratory procedure for determining
centage as related to the permanent wilting percentage. Soil the field capacity of soils. Soil Sci. 63, 277–283.
Sci. 56, 331–339. D’Antuono, L.F., Rossini, F., 1994. Biologia e tecnica colturale
Spitters, C.J.T., Van Keulen, H., Van Kraalingen, D.W.G., del lino da olio. L’Informatore Agrario 46, 7–10.
1989. A simple and universal crop growth model SUCROS-D’Antuono, L.F., Rossini, F., 1995a. Experimental estimation
( Eds.), Simulation and Systems Management in Crop Pro- and irrigation on linseed (Linum usitatissimumL.). Indian J. Agron. 33, 44–46.
tection Simulation Monographs. Pudoc, Wageningen,
pp. 147–181. Venturi, G., Amaducci, M.T., Cremaschi, D., 1994. Lino da olio, primi risultati del PRisCA. L’Informatore Agrario Tiver, N.S., Williams, R.F., 1943. Studies on the flax plant. 2
The effect of artificial drought on growth and oil production 46, 4–6.
Yang, S., Logan, J., Coffey, D.L., 1995. Mathematical formulae in a linseed variety. Aust. J. Exp. Biol. Med. Sci. 20,
201–209. for calculating the base temperature for growing degree days. Ag. For. Meteorol. 74, 61–74.