Ethanolic extraction of zein from maize
L.C. Dickey *, N. Parris, J.C. Craig, M.J. Kurantz
US Department of Agriculture,Eastern Regional Research Center,Agricultural Research Ser6ice,600East Mermaid Lane, Wyndmoor,PA19038-8598,USA
Received 17 January 2000; accepted 30 April 2000
Abstract
Zein can be extracted from maize (Zea mays) using ethanol solutions, and recovered from the extract by diluting with water. Dilution to 40% ethanol will precipitate a mixture of zein and maize lipid with15% lipid. For possible zein applications, such as film production, purer zein is required. Most of the lipid can be removed from the precipitate by selective re-extraction with hexane or ethanol, but this is expensive. A precipitate containing 90% or more of the protein in the extract, with less than 10% lipid, can be obtained by diluting the extract in stages. An initial dilution will precipitate a solid with 75% or more lipid, this precipitate can be centrifuged from the extract and the centrifugate diluted to precipitate a solid of 70% or more zein. The mass and composition of solid centrifuged from a maize extract that was diluted in several steps to characterize the composition of precipitates so formed. The lipid content of a zein product precipitated from an extract diluted from 55% ethanol to 50% is significantly lower than the content of precipitate of an extract diluted in a single step to 40% ethanol. Published by Elsevier Science B.V.
Keywords:Extraction; Precipitation; Centrifugation; Zein
www.elsevier.com/locate/indcrop
1. Introduction
The potential value of the non-fermentable maize components, beyond livestock feed, has been recognized widely and the search for new applications has been described (Parris et al., 1998; Lai et al., 1999). Zein is commercially
ex-tracted from corn gluten meal (CGM) in small amounts. The CGM is separated from steeped maize after germ and fiber removal, as part of a wet milling ethanol process. Our objective is to develop a zein extraction process suitable for dry-grind ethanol plants or wet mills. Retrofitting existing dry mills will be the least expensive way to produce amounts of zein that will be needed to supply an initial market. Commercial uses for zein outside the food industry are not competitive and may take several years to develop.
In principle, zein could be separated from the solid product, distillers’ dried grains (DDG), of existing dry grind or beverage alcohol plants.
Mention of brand or firm name does not constitute an endorsement by the US Department of Agriculture over others of a similar nature not mentioned.
* Corresponding author. Tel.: +1-215-2336640; fax: + 1-215-2336795.
E-mail address:[email protected] (L.C. Dickey).
However, relatively little protein in DDG can be extracted without adding reducing compounds to the ethanol (Wu et al., 1981; Wu, 1989; Wolf and Lawton, 1998). For DDG, heating in the distilla-tion reboiler, or dryer, reduces extractability of zein from these animal feed products (Wolf and Lawton, 1998) and CGM (Wu et al., 1997). Mod-ulated differential scanning calorimetric
measure-ments have shown differences in thermal
properties between hot air-dried (commercial) CGM and freeze-dried CGM, attributed to browning reactions (DiGioia, et al., 1999). Com-parisons of CGM and endosperm analyses show that (Landry et al., 1999), CGM contains a sig-nificant amount of alcohol-extractable protein, which would not have been extractable from the endosperm.
Separation of zein and oil from maize by ex-traction with ethanol has been reported. Hojilla-Evangelista et al. (1992) described a process to dry a 95% ethanol stream to fuel grade with dry maize. The ethanol stream extracted oil from the corn, and zein was subsequently extracted from the deoiled maize, with 45% ethanol – 55% 0.1 M NaOH. The scheme for recovering oil and protein in consecutive extractions appears to produce good recoveries, but the cost of evaporating the ethanol solutions from the maize twice is roughly twice that of a single extraction. Dickey et al. (1998) described a process to extract zein from maize with 70% ethanol, followed by dilution of the extract to 40% ethanol and centrifugation to separate a solid containing 70 – 80% protein. For uses such as forming a grease-resistant coated paper, zein combined with the natural maize oil may be acceptable. Films made from mixtures of commercial zein and fatty acids have better prop-erties than pure zein films (Lai et al., 1997; San-tosa and Padua, 1999). Furthermore, zein films containing linoleic acid have lower water absorp-tion than those containing palmitic acid. How-ever, high purity zein is desirable for uses requiring minimal color and aroma. Color- and aroma-imparting compounds can be extracted from the zein product with a hydrophobic, lipid-extracting, solvent. Alternatively, lesser amounts of the undesired compounds can be extracted initially, by using a more aqueous extracting
sol-vent. However, below 70 – 80% ethanol a lower ethanol content solvent will extract zein more slowly than one with more ethanol, increasing extraction cost. Thus, a less expensive method of obtaining purer zein by alcohol extraction would be to extract with an ethanol concentration high enough to maximize the extraction rate, and sub-sequently remove the immiscible oil and undesir-able associated compounds, prior to final dilution of the extract.
2. Materials and methods
2.1. Maize preparation
The maize used was fine-cut, dent maize pro-duced by a commercial feed mill (Davis Feed Mill, Perkasie, PA) with a counter-rotating, ribbed disc mill. Before disc milling, the maize was cracked with a roller mill and the pericarp removed by aspiration. The dehulled maize was then milled to a median size of 2 mm, based on sieve separation of 23 kg.
2.2. Analysis
The protein content (N×6.5) was determined
2.3. Extraction
The 26 kg of milled dent maize was added to 91
kg of an ethanol/water mixture, 70% ethanol, in a
model Biostat UD, 300-l fermentor (B. Braun Biotech, Inc., Allentown, PA). The slurry was agitated within the fermentor by turbine paddles at 200 rpm and circulated out of the fermentor through a centrifugal pump (Fristram, model FP702, Middletown, WI) and back to the fermen-tor, to increase the disruption of the endosperm structure. The suspension temperature was raised to 50°C in a few minutes. It was held at this
temperature for 1 h, then pumped at 550 kg/h to
a decanter centrifuge (Sharples, division of Alfa Laval, model PF-743, Warminster, PA) running at 6000 rpm. A stream of the same composition as the original extraction liquid was pumped into the centrifuge through a separate inlet and led to a section of the centrifuge where it would rinse the outgoing solids stream. The rinse rate was calcu-lated to be sufficient to displace the extract from
the (50%) solids stream being pushed out of the
centrifuge. This rate was usually third to one-fourth of the rate used to pump the extraction vessel contents into the centrifuge. Damp ex-tracted maize and extract (liquid) were collected at the separate centrifuge outlets.
2.4. Preliminary extract separation
The extract was cooled to ambient temperature and stored overnight, and then pumped to a 10.5-cm tubular-bowl centrifuge (Sharples, divi-sion of Alfa Laval, model M-312-H-16, Warmin-ster, PA) rotating at 15 000 rpm. The centrifuge
generated 13 200×g. The liquid centrifugate was
collected for analysis and dilution. The solid col-lected on the bowl was scraped out by hand, lyophilized, weighed and analyzed for protein, lipid and solid content.
2.5. Continuous centrifugation
The extraction and preliminary extract separa-tion steps were carried out using 74 kg of extract, which was pumped through the bowl centrifuge at
17.7 kg/h. Solids, mostly fine particles not
cap-tured by the decanter centrifuge, weighing 151.7 g. were recovered. The 72% ethanol centrifugate was diluted, held overnight, and pumped through the bowl centrifuge at 16 kg/h. This dilution, holding, and centrifugation sequence was repeated ten times with successively lower ethanol fraction.
2.6. Batch centrifugation
The decanted liquid extract, 81.3 kg, was col-lected, held overnight and pumped through the bowl centrifuge at 16.3 kg/h. This was a different extract prepared similarly to the extract used for the continuous centrifugations. Fine particles not separated by the decanter centrifuge, 189.4 g, were removed from the extract. The extract, 73.5 kg, was divided into two parts. The smaller part, 36.5 kg, was diluted with 6.5 kg of tap water and held overnight. The 37-kg of decanted extract remain-ing was stored for 4 months and used later for tests of concentrated extract. The diluted part of the extract was pumped through the bowl cen-trifuge and 40 kg of centrifugate recovered. A 5-kg portion of the centrifugate was used for a
series of dilution/holding overnight/batch
cen-trifugations similar to those carried out with the bowl centrifuge.
The batch was centrifuged with a RC-5B Sor-vall automatic superspeed refrigerated centrifuge (Kendro Laboratory Products, Newtown, CT)
with GSA rotor at 10 000 rpm (13 300×g). The
samples were spun for 30 min at 0°C.
Three 4.5-kg portions of the 40 kg of diluted, bowl-centrifuged extract were prepared and batch centrifuged as described, but at different rota-tional velocities to determine the effect of spin rate on separation. The centrifugates were then diluted with water to an ethanol concentration of 32 – 34 wt.% and centrifuged.
2.7. Extract concentration
2.7.1. E6aporati6e concentration
A 7.3 kg portion of the 40 kg of diluted extract, prepared as described in section 2.6., was diluted, centrifuged with the RC-5B Sorvall centrifuge and held at ambient conditions for 2.5 months; 7.3 kg of this solution was circulated through a constant temperature bath held at 40°C, for 4 h, to evapo-rate 2.9 kg of the solution. The concentevapo-rated extract was batch centrifuged at 10 000 rpm for 30 min. A second 7.3-kg portion of the 40-kg of diluted extract was circulated to evaporate 3.5 kg in four steps with 30-min batch centrifugation at 10 000 rpm on the day following each 1 or 12 h evaporation step. The solids separated by cen-trifugation contained 1.3 kg of liquid.
2.7.2. Microfiltration
A 14.3 kg portion (16 l) of the 37 kg of undi-luted extract, prepared as described in Section 2.6, was pumped into a feed tank, which is part of a membrane filtration facility. The extract con-tained 1.6% solids, 0.6% protein and 0.15% lipids. The facility affords circulation of solution from an agitated feed tank by a model 30510 flexible impeller pump (Jabsco, Costa Mesa, CA) through
a ceramic micro-filter (Ceramem LMA 0.2 mm,
Waltham, MA). The retentate flows from the pump through a coiled stainless tube immersed in a refrigerated water bath (model 2065, Caron
Products and Services, Marietta, OH), at 139
0.6°C to the feed tank. The micro-filtered perme-ate was collected in a receiver connected to a
radial port on the filter housing. Pressure and temperature of the solution were measured by means of gauges on the feed side of the filter.
These were 82.7 kPa and 2191°C for the first 8 h
of filtration and 82.7 kPa and 2491°C for the
last 23.8 h. The permeate contained 1.39% solids, 0.20% lipids and 0.39% protein. The retentate contained 2.36% solids, 0.20% lipids and 1.20% protein. The retentate was batch centrifuged, once before dilution and three more times after dilution with 0.66, 1.0 and 1.36 kg of distilled water, with holding overnight after dilution. The permeate was treated similarly, with an initial batch cen-trifugation followed by dilution with 1.0, 3.0 and 3.5 kg of distilled water and stored overnight. The solids and protein fractions recovered by the cen-trifuge separations were measured.
3. Results
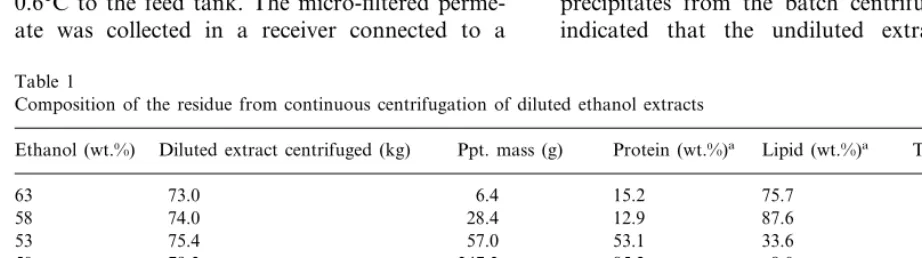
Analysis of the samples from the continuous centrifugation series is shown in Table 1. Based on the analysis of the precipitates, the undiluted extract, which had been passed through the de-canter centrifuge and subsequently the bowl cen-trifuge, contained 0.8% solids and 0.5% protein. No evidence of gelling was observed in the ex-tracts or diluted exex-tracts even after holding at ambient conditions for 22 months. Analysis of the precipitates from the batch centrifugation series indicated that the undiluted extract solution,
Table 1
Composition of the residue from continuous centrifugation of diluted ethanol extracts
Diluted extract centrifuged (kg) Ppt. mass (g)
Ethanol (wt.%) Protein (wt.%)a Lipid (wt.%)a Time (days)b
73.0 6.4 15.2 75.7 2
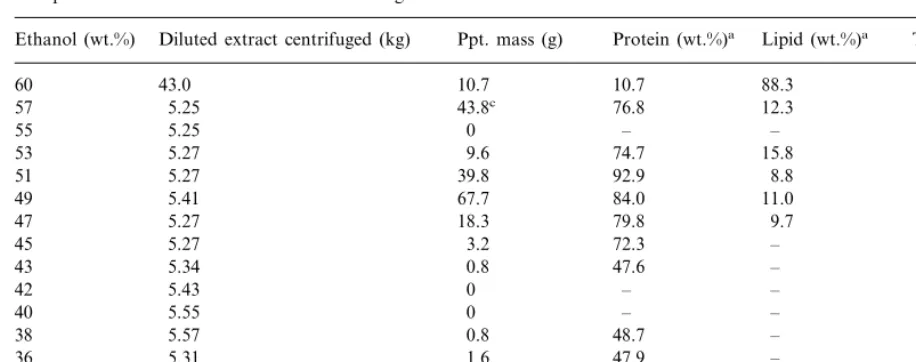
Table 2
Composition of the residue from batch centrifugation of diluted ethanol extracts
Ppt. mass (g) Protein (wt.%)a
Ethanol (wt.%) Diluted extract centrifuged (kg) Lipid (wt.%)a Time (days)b
10.7 10.7
aDry basis. Authors recognize that the total of identified components do not equal 100%. bTime interval between extraction and centrifugation.
cA total of 5 kg of the 40 kg of 63% ethanol diluted extract was diluted to produce this diluted extract, this and subsequent solid
masses was multiplied by eight to account for this sampling.
which had been passed through the decanter and bowl centrifuge, contained 0.6% solids and 0.4% protein. The solid composition and yield of each step of this series are listed in Table 2. The results of the batch centrifugal separations at different speeds are shown in Table 3.
Figs. 1 and 2 represent the yield as related to ethanol dilution and centrifugation. A bi-modal recovery distribution is illustrated in Fig. 2. We attribute the first peak of Fig. 2 (which corre-sponds to the second row of Table 2) to the relatively long centrifugation period provided by the batch centrifuge. Solids described in the first row of Table 2, and all of Table 1, were recovered with the continuous (bowl) centrifuge. Fine parti-cles, too small for removal during the relatively short passage through the bowl centrifuge, were pulled out of suspension during the initial batch centrifugation. The results of the continuous and batch treatments are similar, with maximum
protein separation from solutions of 50 wt.%
ethanol. The variation of centrifugal speed, in Table 3, indicates that, using stored decanted extract; separation of lipid from the 60% solution is improved at higher centrifuge speeds. There seems to be no advantage to using speeds higher
than 6000 to separate zein from the centrifugates diluted to 33% ethanol.
The liquid mass of the first extract concentrated by evaporation was reduced to 4.4 kg. Analysis of solids recovered by scraping the evaporation tank (40.6 g) and by batch centrifugation of the final liquid (12.1 g), showed that protein comprised 0.46% of the diluted extract (55% ethanol) and 0.76% of the partly evaporated extract (37% ethanol).
Mass and protein concentrations of solids that were separated by batch centrifugation after each evaporation step in the four-step evaporation pro-cess are listed in Table 4. No solid was deposited in the evaporation tank. The solution protein
Table 3
Mass of solid recovered at various centrifugal speeds
Speed (rpm) Solid mass: total–lipids–protein (g)
Fig. 1. Solid yield, dilution and continuous centrifugation of extract.
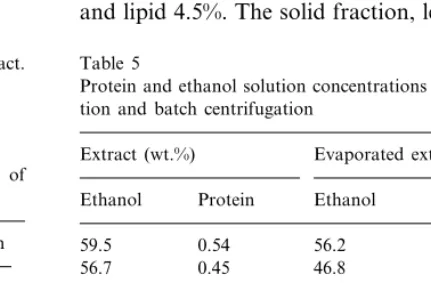
concentrations of samples taken from these steps, along with those from the dilution and batch centrifugation series for the unevaporated extract are shown in Table 5. Most of the protein precip-itated from the evaporated extract over the range 46 – 39% ethanol, whereas the standard extract dilution precipitation range was 59 – 48%. The slight increase of protein and other solute concen-tration in the evaporated extract resulted in less precipitation, contrary to expectation. That is, the dilution of evaporated extract maintained higher protein concentrations than diluted extract at the same ethanol concentrations. This suggests that evaporating the extract makes the solutes less susceptible to precipitation, and to simply recover protein by adding water is preferable to evapora-tion. Adding water, however, will increase the energy cost resulting from the increased mass flow of diluted and centrifuged extract sent to the distillation column for recovery.
The weight and protein fractions of the solid centrifuged from the diluted microfiltered extract are shown in Table 6. Permeate samples contained 1.39% solids, 0.20% lipids and 0.39% protein. Retentate samples of the final streams contained 2.36% solids, 0.20% lipids and 1.20% protein. The 9.4 kg of permeate had a precipitated solid con-tent (for the four precipitates shown in Table 6) of 0.4% of which protein was 33% and lipid 16.5%. The 3.9 kg of retentate had a precipitated solid content of 1.36%, with a protein content of 78% and lipid 4.5%. The solid fraction, less the protein
Fig. 2. Solid yield, dilution and batch centrifugation of extract. Table 5
Protein and ethanol solution concentrations prepared by dilu-tion and batch centrifugadilu-tion
Evaporated extract (wt.%) Extract (wt.%)
Ethanol Protein Ethanol Protein
0.54 0.59
59.5 56.2
0.395
0.45 46.8
56.7
54.7 0.435 38.8 0.15
31.6 0.11
0.35 52.8
51.0 0.235 17.5 0.095
0.125 – –
49.1
47.2 0.065 – –
– –
0.05 45.3
0.045 – –
43.4 Table 4
Mass of solid recovered by dilution and centrifugation of evaporated extract
Solid separated by centrifugation Ethanol concentration
(wt.%)
(g) (% protein)
– –
55
22.9
47 73
11.0
39 76
32 2.2 42
40 2.3
Table 6
Centrifuge/dilution of retentate of 0.2% microfiltration
Ethanol Retentate Permeate
(wt.%)
Solids Solid centrifuged Total Solid centrifuged
Total Solids
(wt.%)
(kg) (kg) (wt.%)
Total Protein Total Protein
(wt.%) (g)
(wt.%) (g)
1.99 18.7 74.4 9.43 1.36 0.1
65 3.89 –
1.60 1.2 35.8 10.13
3.66 1.26
53 0.1 –
0.95 28.9 85.1 12.80 0.83 26.9
43 4.89 26
0.85 4.0 57.3 15.89
6.00 0.57
33 10.0 50
fraction was the same, within the measurement error, for both concentrate and permeate.
4. Discussion
4.1. Ethanol/water/zein solutions
From spectroscopic measurements, it is known that pure alcohols form oligomers and water forms three-dimensional clusters. Sato et al. (1999) found that, based on dielectric relaxation of ethanol – water mixtures, mixtures with more than 36 wt.% ethanol were in almost the same environment as those in pure ethanol. Ethanol molecules form chainlike clusters in the pure liq-uid. Zein does not dissolve in either pure water or pure ethanol. The dilution experiments described here show that zein extracted with 70% ethanol precipitates when the ethanol concentration is re-duced to 50% (30 mol%) ethanol. This range of zein solubility is also the concentration range where a mixture of water and ethanol has a high negative excess molar volume (Takiguchi et al., 1996), and a low excess relative permittivity (Smith et al., 1998). Low specific volume could only result if a mixed composition phase has less specific volume than the arithmetic average
vol-ume of discrete phases of pure ethanol and/or
pure water molecules. The excess relative permit-tivity of the mixture is less than one would calcu-late from the pure liquids.
A liquid structure proposed by Matsumoto et al. (1995) was based on mass spectrometric mea-surements of ethanol – water clusters. They pro-posed that the ethanol molecules are hydrogen bonded together through their hydroxyl groups, forming polymers. The ethanol polymers can be stacked in arrays if the ethyl groups are directed to one side of the polymer, and the ethyl group sides of adjacent polymers face each other. Water molecules, in this model, fill between hydroxyl faces of the ethanol polymers and around layers of the ethanol polymers, with minor effect on the polymer structure. The arrays would complement the planar zein structure if the ethyl face of the ethanol polymer array is located adjacent to the zein. If the water fraction exceeds that amount needed to fill the space between layers of ethanol polymer around the zein solute and in the solu-tion, then water molecules would be available to hydrogen bond with the hydroxyl groups of the
ethanol molecules and disrupt the ethanol
polymers.
the ethanol polymers is probably not the cause for zein insolubility. As we found, 0.50 weight frac-tion ethanol is needed to maintain zein in solu-tion, at any temperature. This minimum weight fraction may be the fraction needed to keep the ethanol polymers in planar arrays with the ethyl groups all on one side, conformable to the zein shape.
4.2. Solution zein structure
Zein extracted from corn or corn gluten with an alcohol solution is a mixture of at least four protein groups where more than 70% is in the
a-zein group. This fraction is composed of two
sub-fractions: Z19 with 210 – 220 amino acid
residues and Z22, with 240 – 245 residues
(Lasztity, 1996). The helical fraction of a-zein in solution was measured by optical rotary disper-sion and found to be insensitive to zein concentra-tion up to 35% or to the dielectric constant of solvent. The fraction is 33 – 34% for ethanol solu-tion from 73 to 44% ethanol (Danzer et al., 1975). A recent model (Matsushima et al., 1997), based on small-angle X-ray scattering measurements of
a-zein in solution, indicates that a single zein
molecule is comprised of nine or ten, nearly
iden-tical a-helices joined anti-parallel into a folded
ribbon, 13 nm long. Based on the measured values of the structural parameters of zein in solution, it was suggested that these ribbons of helices are bundled together in asymmetric prisms of at least
four molecules, long sides together. Zein
molecules are so much larger than any probable cluster of ethanol and water molecules that their motion in solution will necessarily be practically independent of the solvent molecules’ motion. A zein solution is close to the boundary between a solution and a fine scale suspension, but the four-molecule prismatic aggregates (in solution) are small enough that they will not aggregate by shear alone except at local shear rates greater than 106
/s (Zukoski et al., 1996).
4.3. Zein precipitation from solution
Ethanol solutions containing 5% or more zein will gel after a few weeks unless heated above
100°C and treated with aldehyde (Evans and Manley, 1943). When the lateral (model) surfaces of undenatured zein molecules in solution are brought in contact by liquid motion, they will adhere. The film forming capability of zein (and prolamins of other cereals) solutions suggests that adhesion has a preferred direction and starts and continues at the solution interfaces. Zein films were examined with infrared spectroscopy by Kretschmer (1957), who concluded that zein films could be rolled, steamed or precipitated from dilute ethanol solution to produce material with moreb-sheet character and lessa-helical ordering
than zein precipitated from 70% ethanol
solutions.
Water-soluble, globular proteins can be dena-tured with heat. Cooling heat-denadena-tured solutions usually results in formation of gels. Subirade et al., 1998 reported an FTIR examination of a drying protein (glycinin) film. They found the unstable, denatured conformation evolved to an
intermolecular hydrogen-bonded b-sheet film.
Film formation during surface dehydration of water-soluble protein films resembles zein precipi-tation, because, in both, removal of solvent leads to adhesion of parallel molecular surfaces.
Svergun et al. (1998) found that a variety of proteins in aqueous solution are surrounded by a
first hydration shell 10% denser than the bulk
It might be expected, (Plasari et al., 1997), that an extract solution closer to saturation would precipitate with little dilution. The zein concentra-tion produced by the evaporative concentraconcentra-tion experiment was not near saturation. Stable con-centrations of zein in ethanol solutions up to 25% have been achieved by evaporation of extract (Dill, 1927).
4.4. Concentrating zein solutions
Process model simulations suggest that it will be cheaper to increase the extract zein concentra-tion before diluting to reduce the amount of diluted extract that must be distilled prior to reuse. However, the concentration of the zein content by evaporation will also reduce the etha-nol content and could confound the dilutions to precipitate lipid and zein. Zein concentration can also be achieved by micro-filtration, which would not change the ethanol concentration, but is ex-pensive. Batch centrifugation is too expensive for use in a commercial zein process, but the speed variation tests in Table 3 show a relation that may apply to continuous centrifugation. The increased lipid removal at higher speeds indicates that the lipid removal at the lower dilution is more de-manding than the final protein separation and may benefit from lower pumping rates through a bowl centrifuge.
5. Conclusions
A substantial fraction of the lipids extracted with the zein can be removed by centrifugation from 70% ethanol extracts of corn diluted to a concentration between 58 and 60% ethanol. This diluted solution contained 0.5% zein and one-third of the lipid in the decanted extract was removed. After further dilution to 50% ethanol, 90% of the extracted zein was removed by contin-uous centrifugation. Variation in ultracentrifuge speed showed that 10 000 rpm is significantly better at removing lipids from the 60% ethanol solution than separations at the lower speeds tried. However, separation of zein from the 50% ethanol solution was insensitive to speeds over the range 6 – 10 000 rpm.
Acknowledgements
The authors thank Michael F. Dallmer for
carrying out the extractions, dilutions and
centrifugations.
References
American Association of Cereal Chemists (AACC), 1995. Ap-proved Methods of the AACC, 9th edn., Method 46-13 The Association, St. Paul, MN.
Association of Official Analytical Chemists (AOAC), 1995. Official Methods of Analysis of the Association of Official Analytical Chemists. 16th edn., Method 32.203, The Asso-ciation, Arlington, VA.
Conio, G., Patrone, E., Brighetti, S., 1970. The effect of aliphatic alcohols on the helix-coil transition of poly-L -or-nithine and poly-L-glutamic acid. J. Biol. Chem. 245, 3335 – 3340.
Danzer, L.A., Ades, H., Rees, E.D., 1975. The helical content of zein, a water insoluble protein, in non-aqueous solvents. Biochim. Biophys. Acta 386, 26 – 31.
Dickey, L.C., Dallmer, M.F., Radewonuk, E.R., Parris, N., Kurantz, M., Craig, J.C., 1998. Zein batch extraction from dry-milled corn: cereal disintegration by dissolving fluid shear. Cereal Chem. 75, 443 – 448.
DiGioia, L., Cuq, B., Guilbert, S., 1999. Thermal properties of corn gluten meal and its proteic components. Int. J. Biol. Macromol. 24, 341 – 350.
Dill, D.B., 1927. The behavior of the prolamins in mixed solvents. II. J. Biol. Chem. 72, 239 – 247.
Evans, C.D., Manley, R.H., 1943. Stabilization of zein disper-sions against gelation. Ind. Eng. Chem. 35, 230 – 232. Hojilla-Evangelista, M.P., Johnson, L.A., Myers, D.J., 1992.
Sequential extraction processing of flaked whole corn: alternative corn fractionation technology for ethanol pro-duction. Cereal Chem. 69, 643 – 647.
Kretschmer, C.B., 1957. Infrared spectroscopy and optical rotatory dispersion of zein, wheat gluten and gliadin. J. Phys. Chem. 61, 1627 – 1631.
Lai, H.M., Padua, G.W., Wei, L.S., 1997. Properties and microstructure of zein sheets plasticized with palmitic and stearic acids. Cereal Chem. 74, 83 – 90.
Lai, H.M., Geil, P.H., Padua, G.W., 1999. X-ray diffraction characterization of the structure of zein – oleic acid films. J. Appl. Polym. Sci. 71, 1267 – 1281.
Landry, J., Delhaye, S., DiGioia, L., 1999. Protein distribution in gluten products isolated during and after wet-milling of maize grains. Cereal Chem. 76, 503 – 505.
Lasztity, R., 1996. The Chemistry of Cereal Proteins, 2nd edn. CRC Press, Boca Raton, FL, pp. 195 – 200.
mass spectrometry and X-ray diffraction. Bull. Chem. Soc. Japan 68, 1775 – 1783.
Matsushima, N., Danno, G., Takezawa, H., Izumi, Y., 1997. Three-dimensional structure of maizea-zein proteins stud-ied by small-angle X-ray scattering. Biochim. Biophys. Acta 1339, 14 – 22.
Parris, N., Vergano, V.J., Dickey, L.C., Cooke, P.H., Craig, J.C., 1998. Enzyme hydrolysis of zein – wax coated paper. J. Agric. Food Chem. 46, 4056 – 4059.
Plasari, E., Grisoni, P.H., Villermaux, J., 1997. Influence of process parameters on the precipitation of organic nanoparticles by drowning-out. Trans IChemE 75, 237 – 243.
Santosa, F.X.B., Padua, G.W., 1999. Tensile properties and water absorption of zein sheets plasticized with oleic and linoleic acids. J. Agric. Food Chem. 47, 2070 – 2074. Sato, T., Chiba, A., Nozaki, R., 1999. Dynamical aspects of
mixing schemes in ethanol – water mixtures in terms of the excess partial molar activation energy, enthalpy and en-tropy of the dielectric relaxation process. J. Chem. Phys. 110, 2508 – 2521.
Smith, R.L., Lee, S.B., Komori, H., Arai, K., 1998. Relative permittivity and dielectric relaxation in aqueous alcohol solutions. Fluid Phase Equilibria 144, 315 – 322.
Subirade, M., Kelly, I., Gueguen, J., Pezolet, P., 1998. Molec-ular basis of film formation from a soybean protein: com-parison between the conformation of glycinin in aqueous solution and in films. Int. J. Biol. Macromol. 23, 241 – 249.
Svergun, D.I., Richard, S., Koch, M.H.J., Sayers, Z., Kuprin, S., Zaccai, G., 1998. Protein hydration in solution: experi-mental observation by X-ray and neutron scattering. Proc. Natl. Acad. Sci. USA 95, 2267 – 2272.
Takiguchi, Y., Osada, O., Uematsu, M., 1996. Thermody-namic properties of {xC2H5OH+(1−x)H2O} in the
tem-perature range from 320 to 420 K at pressures up to 200 MPa. J. Chem. Thermodyn. 28, 1375 – 1385.
Walgers, R., Lee, T.C., Cammers-Goodwin, A., 1998. An indirect chaotropic mechanism for the stabilization of helix conformation of peptides in aqueous trifluoroethanol and hexafluoro-2-propanol. J. Am. Chem. Soc. 120, 5073 – 5079.
Wolf, W.J., Lawton, J.W., 1998. Isolation and characteriza-tion of zein from corn distillers’ grains and related frac-tions. Cereal Chem. 74, 530 – 536.
Wu, S., Myers, D.J., Johnson, L.A., 1997. Effects of maize hybrid and meal drying conditions on yield and quality of extracted zein. Cereal Chem. 74, 268 – 273.
Wu, Y.V., 1989. Protein-rich residue from ethanolic fermenta-tion of high lysine, dent, waxy, and white corn varieties. Cereal Chem. 66, 506 – 509.
Wu, Y.V., Sexson, K.R., Wall, J.S., 1981. Protein-rich residue from corn alcohol distillation: fractionation and character-ization. Cereal Chem. 58, 343 – 347.
Zukoski, C.F., Rosenbaum, D.F., Zamora, P.C., 1996. Aggre-gation in precipitation reactions: stability of primary parti-cles. Trans IChemE 74, 723 – 731.