www.elsevier.com / locate / econbase
Price limits and stock market volatility
*
Kenneth A. Kim
University of Wisconsin-Milwaukee, School of Business Administration, P.O. Box 742, Milwaukee, WI 53201, USA
Received 22 March 2000; received in revised form 16 October 2000; accepted 7 November 2000
Abstract
We examine the relationship between price limits and stock market volatility. We find when price limits are made more (less) restrictive stock market volatility is usually not lower (higher). This finding contradicts conventional wisdom and the view of most regulators. 2001 Elsevier Science B.V. All rights reserved.
Keywords: Price limits; Stock market volatility
JEL classification: G15; G18
1. Introduction
At the end of 1997, the Stock Exchange of Thailand (SET) increased their daily price limit from 10 to 30%. One year later, the Taiwan Stock Exchange (TSE) reduced their daily price limits from 7 to 3.5%. The contradicting actions of the SET and the TSE illustrates the current lack of consensus that exists on how restrictive price limits should be. Most regulators feel that price limits will reduce stock market volatility (conventional wisdom), but others feel that price limits will exacerbate stock market volatility. These differences of opinion and current debate represent the motivation for this paper. Specifically, we wish to see if price limits moderate stock market volatility.
Daily price limits are literal boundaries that pre-specify the maximum range, usually both upward and downward, in which security prices are allowed to move within a single day. Price limits are usually specified by a percent based on the previous day’s closing price. Daily price limits are currently in place in the US futures markets, but they are also used in many of our world’s stock
*Corresponding author. Tel.: 11-414-229-6530; fax: 11-414-229-6957. E-mail address: [email protected] (K.A. Kim).
1 2
markets. The primary function of price limits is to reduce stock market volatility. The rationale is simple: by constraining prices, ‘wild’ or ‘excessive’ intraday price swings are prevented from occurring, which, in turn, means that the markets will experience less volatility. However, whether or not price limits succeed in reducing volatility, in a meaningful economic sense, is a somewhat unresolved issue (Harris, 1998).
Perhaps the main reason why the evidence on price limit effects is scant is that there is no perfect way to identify the effects. For example, it would be senseless to simply measure stock market volatility for markets with restrictive price limits because price movements are truncated at the price limit. That is, extreme volatility will go undetected due to the censored data, and as such, most measures of volatility would be underestimated and / or ambiguous. Therefore, some papers have conducted event studies to access price limit effects, where a price-limit-hit represents an ‘event’ day,
3
but such papers have been subject to criticism.
In this paper, we attempt to access price limit performance in the following way. We identify a market that has changed their price limit range several times (Taiwan Stock Exchange). We measure stock market volatility under the different price limit regimes to see if more restrictive price limits
4
lead to lower volatility, and vice versa. To handle the problem of censored data, due to the price limit constraint, we borrow a technique from Roll (1984) (which we will discuss in more detail in the next section).
We hypothesize that restrictive price limits do not moderate volatility. This hypothesis is
5
contradictory to ‘conventional’ wisdom and to the views of many regulators. The justification for our hypothesis derives from the contentions of several researchers. For example, Kyle (1988) and Fama (1989) argue that when price limits are hit, then there is uncertainty with regard to the equilibrium
1
For example, Austria, Belgium, France, Greece, Italy, Japan, Korea, Malaysia, Mexico, The Netherlands, Spain, Switzerland, Taiwan, and Thailand.
2
France et al., 1994; Harris, 1998; Kim and Rhee, 1997; Taiwan Stock Exchange Fact Book, 1998; Tokyo Stock Exchange Fact Book, 1997.
3
These event-study papers have found that after a security hits a price limit, the volatility of that security is lower on subsequent days (e.g., Ma et al., 1989a,b). While this finding suggests that price limits may have played a role in mitigating volatility, Lehmann (1989) and Miller (1989) correctly point out that we would naturally observe lower volatility on days following high volatility days. Thus, while event studies are potentially insightful, they are subject to some interpretation problems, especially because stock price volatility is well known to be serially dependent (Chen, 1998; Kim and Limpaphayom, 2000; Lehmann, 1989; Miller, 1989; France et al., 1994). Further, these event studies also suffer from a sample selection bias because securities that hit price limits on consecutive days are often excluded from the study samples (Lehmann, 1989; Miller, 1989; and Kim and Rhee, 1997).
4
This approach is commonly used when testing the impact of initial margin requirement changes on stock market volatility (e.g., see Ferris and Chance, 1988). However, this basic approach has never been used to study price limit effects simply because stock returns are censored at their price limits.
5
6
price, which, in turn, may then actually increase stock market volatility. Therefore, restrictive price limits may in fact actually cause high volatility levels.
The next section of our paper outlines our test design and describes the data. Section 3 presents the results. Section 4 concludes the paper.
2. Test design and data
To conduct our study, we look to the Taiwan Stock Exchange (TSE) as it seems to offer much promise for insightful empirical investigation especially because, since 1962, they have had 11
7,8
different price limit ranges. Our TSE data is retrieved from the PACAP Databases. Daily stock
Table 1
Stock return variance 0.0615 . 0.0386 , 0.0615 , 0.4129 . 0.3218 . 0.0996
F51.59** F53.22** F56.72** F51.29** F53.22**
No. of observations 56 233 109 230 504 10 991 21 634 483 767
Test for equality
of variance F5252.7**
a
This table shows the average variance of daily stock returns under different price limit regimes. Variance measures are multiplied by 100. An F-value from Levene’s test for the homogeneity of variance is reported at the bottom of this table. When conducting pairwise variance comparisons, we use the symbols,and .to denote whether the variance from one regime is smaller than, or larger than, the variance from an adjacent regime. For the pairwise comparisons, statistical significance is determined using the F-statistic (reported below the, . symbols) on the ratio of the two variances.
**Denotes statistical significance at the 1% level.
6
In addition, Subrahmanyam (1994) argues that volatility may increase under these kinds of market mechanisms because traders may sub-optimally advance their trades in anticipation of an impending price-limit-hit. Kim and Rhee (1997) contend that price limits do not constrain volatility, but merely cause volatility to be ‘spilled-over’ to subsequent days. This argument is consistent with the findings of Lee et al. (1994) who observe volatility increases following New York Stock Exchange trading halts. These views and observations make sense considering that order-imbalances will have to be ‘corrected’ on days subsequent to price-limit-hit days (Lehmann, 1989).
7
We carefully thought about which market would be best to study. We ruled out the US futures markets due to an anticipated lack of sample size. Most price limit studies using US futures market data are only able to employ a few contracts (e.g., Ma et al., 1989a,b). For this reason, Kim and Rhee (1997) study the Tokyo Stock Exchange, but in their conclusion they state, ‘‘our small sample sizes are a weakness in our study. TSE price limits are set wide enough so that limit reaches are rare events.’’ Thus, we try to identify a market where price-limit-hits are a ‘regular’ occurrence. In a recent study by Kim and Limpaphayom (2000), they find the Taiwan Stock Exchange to be a very useful market to test price limit effects, as their price limits have been historically narrow enough to have had a significant impact on stock prices. In fact, in a theory paper by Kim and Sweeney (2000), they test their model using Taiwan data for similar reasons.
8
return data is available from 1975 to 1996 in the most recent version of this database, and as such, this represents our study period. Within this study period, the TSE has had six different price limit ranges (see Table 1).
Our empirical approach is as follows: we will measure the variance of daily stock returns for each of the six price limit regimes that exist in our study period. Pairwise comparisons will be conducted between adjacent regimes to see if the regime under more restrictive price limits had lower volatility. Conducting pairwise comparisons between adjacent regimes makes sense as market regulators are most likely to make revisions to their price limit range in response to current market conditions. However, as mentioned earlier, because price limits constrain daily returns, calculating the simple variance of daily stock returns will suffer estimation bias. Therefore, when we encounter a price-limit-hit day, we calculate a proxy for the ‘true’ return in the following manner: the closing price for that day is assumed to be the closing price on the next subsequent day which did not have a limit move. In other words, the returns are accumulated until a subsequent non-hit day occurs, and we treat this as a single return observation. We are assuming that these proxy returns can reasonably
9,10
represent the returns that would have been observed in the absence of price limits. In fact, our approach follows the same method used by Roll (1984) to identify ‘economic’ returns in his study of orange juice futures prices. The next section presents the results.
3. Results
Table 1 presents the results. There are six different price limit regimes in our sample period. First, we document that the variances from these six regimes are statistically different using the Levene test for the homogeneity of variances (F-value5252.7). Next, we conduct our pairwise comparisons. Going from regime I to regime II, where price limits were made more restrictive (from 5 to 2.5%), we find that the variance of stock returns decreases, which is consistent with the views of conventional wisdom and that of most regulators. Further, going from regime II to regime III, where price limits are relaxed (from 2.5 to 5%), we find that the variance of stock returns increases, which is again consistent with conventional wisdom. However, when we go from regime III to regime IV, where price limits are made more restrictive (from 5 to 3%), we find that volatility increases dramatically, despite the tighter price limit range. This observation contradicts conventional wisdom and it provides support for our hypothesis that restrictive price limits will not lead to lower volatility levels. Going from regime IV to regime V, where price limits are relaxed (from 3 to 5%), volatility actually decreases, again consistent with our hypothesis. Finally, going from regime V to regime VI, when price limits are further relaxed (from 5 to 7%), we again see that volatility decreases, consistent with
9
Some recent empirical support for this assumption is provided by Chen (1998) and Kim and Rhee (1997). They show that equilibrium price discovery takes place over subsequent days and they suggest that these equilibrium prices would have been realized in a single day in the absence of price limits.
10
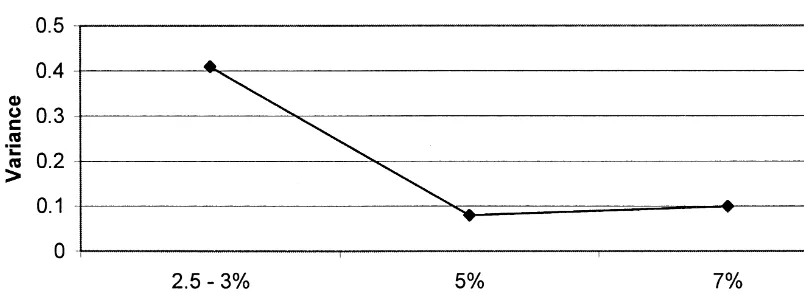
Fig. 1. Stock return variance levels at different price limit ranges for the Taiwan stock exchange during 1975–1996.
our hypothesis. All pairwise variance differences are statistically significant at the one percent level using the F-statistic on the ratio of the two variances. A different volatility measure, returns-squared, yields nearly identical qualitative findings, so they are not reported. An alternative way of examining the relationship between price limits and volatility is presented in Fig. 1. Rather than contrasting adjacent subperiods with different price limits, as in Table 1, this figure graphically depicts volatility at different price limit levels. Here, we again see that the stock market is not more volatile when price limits are less restrictive.
Overall, we find that for the most part, the stock market is not less volatile when price limits are more restrictive. In fact, it appears that the markets are more volatile under stricter price limits, especially when we contrast adjacent price limit regimes. The restrictive 2.5% price limit during regime II represents the only exception to our general contention. However, considering that regime II encompasses eight trading days that took place at the turn-of-the-year (and over 20 years ago), we consider this time period to be too unique in and of itself to offer useful insight. Therefore, we feel confident in our conclusion that restrictive price limits do not moderate volatility (at least not for the Taiwan Stock Exchange).
4. Conclusion
In this paper, we conduct a test on the relationship between price limits and stock market volatility. The popular view among regulators is that restrictive price limits can moderate volatility. However, using the experience of the Taiwan Stock Exchange’s price limit system, we find that stock market volatility is usually not lower (higher) when price limits are made narrower (wider).
Acknowledgements
generous guidance, to Pattanaporn Kitsabunnarat for superb research assistance, to Ghon Rhee for drawing my attention to this area of research, and to those with whom I have had fruitful discussions related to this topic. The usual disclaimer applies.
References
Chen, H., 1998. Price limits, overreaction, and price resolution in futures markets. Journal of Futures Markets 18, 243–263. Fama, E., 1989. Perspectives on October 1987, or, What did we learn from the crash? In: Kampuis, R., Kormendi, R.,
Watson, J. (Eds.), Black Monday and the Future of Financial Markets. Irwin, Homewood, IL, pp. 71–82. Ferris, S.P., Chance, D.M., 1988. Margin requirements and stock market volatility. Economic Letters 28, 251–254. France, V.G., Kodres, L., Moser, J.T., 1994. A review of regulatory mechanisms to control the volatility of prices, Federal
Reserve Bank of Chicago. Economic Perspectives 18, 15–26.
Harris, L., 1998. Circuit breakers and program trading limits: what have we learned. In: Litan, R.E., Santomero, A.M. (Eds.), Brookings-Wharton Papers on Financial Services. Brookings Institutions Press, Washington, DC, pp. 17–63.
Kim, K.A., Limpaphayom, P., 2000. Characteristics of stocks that frequently hit price limits: Empirical evidence from Taiwan and Thailand. Journal of Financial Markets 3, 315–332.
Kim, K.A., Rhee, S.G., 1997. Price limit performance: evidence from the Tokyo Stock Exchange. Journal of Finance 52, 885–901.
Kim, K.A., Sweeney, R.J., 2000. Effects of price limits on information revelation: theory and evidence, McDonough School of Business Working Paper, Georgetown University.
Kyle, A.S., 1988. Trading halts and price limits. The Review of Futures Markets 7, 426–434.
Lee, C.M.C., Ready, M.J., Seguin, P.J., 1994. Volume, volatility, and New York Stock Exchange trading halts. Journal of Finance 49, 183–214.
Lehmann, B.N., 1989. Commentary: Volatility, price resolution, and the effectiveness of price limits. Journal of Financial Services Research 3, 205–209.
Ma, C.K., Rao, R.P., Sears, R.S., 1989a. Volatility, price resolution, and the effectiveness of price limits. Journal of Financial Services Research 3, 165–199.
Ma, C.K., Rao, R.P., Sears, R.S., 1989b. Limit moves and price resolution: the case of the Treasury Bond futures market. Journal of Futures Market 9, 321–335.
Miller, M.H., 1989. Commentary: Volatility, price resolution, and the effectiveness of price limits. Journal of Financial Services Research 3, 201–203.
Roll, R., 1984. Orange juice and weather. American Economic Review 74, 861–880.
Subrahmanyam, A., 1994. Circuit breakers and market volatility: a theoretical perspective. Journal of Finance 49, 237–254. Taiwan Stock Exchange, 1998. Taiwan Stock Exchange Fact Book. Taiwan Stock Exchange, Taipei, Taiwan.
Tokyo Stock Exchange, 1997. Tokyo Stock Exchange Fact Book. Tokyo Stock Exchange, Tokyo, Japan.
US Presidential Task Force on Market Mechanisms, 1988. Report of the Presidential Task Force on Market Mechanisms, A report submitted to the President of the United States.