ANALYSIS OF SPATIO-TEMPORAL PATTERNS OF LEAF AREA INDEX IN DIFFERENT
FOREST TYPES OF INDIA USING HIGH TEMPORAL REMOTE SENSING DATA
Abha Chhabra* and Sushma Panigrahy
Agriculture, Terrestrial Biosphere and Hydrology Group, Earth, Ocean, Atmosphere, Planetary Sciences and Applications Area, Space Applications Centre (ISRO), Ahmedabad
* E-mail: [email protected]
KEY WORDS: India, Forest vegetation, MODIS LAI product, SPOT landuse/landcover classification, Spatio-temporal patterns ABSTRACT:
Knowledge of temporal variations of Leaf Area Index (LAI) aids in understanding the climate-vegetation interaction of different vegetative systems. This information is amenable from high temporal remote sensing data. India has around 78.37 million hectare, accounting for 23.84% of the geographic area of the country under forest/tree cover. India has a diverse set of vegetation types ranging from tropical evergreen to dry deciduous. We present a detailed spatio-temporal and inter-seasonal analysis of LAI patterns in different forest types of India using MODIS 8-day composites global LAI/fPAR product for the year 2005 at 1-km spatial resolution. A forest cover mask was generated using SPOT 1-km landuse/landcover classification over the Indian region. The range of estimated LAI varied from 0.1-6.9 among the different forest types. Maximum LAI was observed in tropical evergreen forests in North-Eastern region and Western Ghats. Low LAI was observed in Central Indian region due to predominance of dry deciduous forests. The spatial patterns of seasonal variations detected that for most of the forest types, the peak LAI values were observed during September and October months of the autumn season in contrast to minimum LAI during summer season. The mean LAI and standard deviation for each 8-day LAI composite were also computed and mean monthly LAI profiles were derived for each forest type classified on the basis of their geographical locations. These results are useful indicators for detailed understanding of phenological sequence and may also serve as important inputs for deriving bioclimatic indices for different forest types of India.
1. INTRODUCTION
About a third of the Earth’s surface is covered by land and much of this is vegetated. Terrestrial vegetation plays pivotal roles in the coupled human-earth system by transferring water, energy, and nutrients among the atmosphere, biota, and aquatic systems (DeFries, 2008). Leaf Area Index (LAI) is an important structural parameter for quantifying the energy and mass exchange characteristics of terrestrial vegetation such as photosynthesis, respiration, transpiration, carbon and nutrient cycle, and rainfall interception (Gong. 2003). It is also a central and basic descriptor of vegetation condition in a wide variety of physiological, climatological, and biogeochemical studies. LAI is defined as one-side green leaf area (m2) in a canopy per unit ground area (m2
) in broadleaf canopies, and as the projected needle leaf area in coniferous canopies (Asner et al., 2003). As LAI is a dimensionless quantity, it can be measured, analysed and modeled across a range of spatial scales, from individual tree crowns or clusters to whole regions or continents. LAI is not only an important driver of most ecosystem productivity models operating at landscape to global scales but also an interacting component of general circulation models (Buermann et al., 2001). Thus it is widely needed by the global change research community as a key vegetation characteristic.
There are two broad types of methods for LAI estimation, either employing the “direct” measures involving destructive sampling, litter fall collection, point quadrat sampling or “indirect” methods involving optical instruments LAI-2000 or LI-COR (Chen et al., 1997) and radiative transfer models. Although direct measurements of canopy LAI are relatively accurate, but
extremely labor intensive and destructive and limited to experimental plots only. The emerging remote sensing platforms and techniques have complemented existing ground-based LAI measurements. Remote sensing based spatially explicit measurements of LAI are an indispensible component necessary for modeling and simulation of ecological variables and processes. The premise of retrieving LAI based on spectral remote sensing data relies on the unique spectral response characteristic of green leaves compared with other land surface materials. As LAI remains consistent, while the spatial resolution changes, estimating LAI from satellite remote sensing allows for a meaningful biophysical parameter, and a convenient ecologically relevant variable for multi-scale, multi-temporal research that ranges from leaf, to landscape, to regional scales (Zheng and Moskal, 2009).
other countries (e.g., European Space Agency’s Medium Resolution Imaging Spectrometer have provided global observations for vegetation analysis over broad scales since the early 2000s. These data has helped to improve our understanding of global dynamics and processes of terrestrial vegetation. Data on LAI from the tropics is sparse as compared to temperate and boreal environments. In the entire global LAI database, only 8% of the studies are from tropical regions (Asner et al. 2003) and temporal LAI studies from tropical forests are even scarcer. Relatively few studies used remote sensing to evaluate/validate and retrieve LAI over terrestrial vegetation in India. These studies include agroecosystems (Pandya et al., 2006), or plantations (Datta, 2011) with limited spatial coverage. However, Indian forest vegetation with high structural heterogeneity has not been studied much and need to be understood in spatio-temporal domain. Therefore, the present study was undertaken to present a detailed spatial, temporal and seasonal analysis of Leaf Area Index for different forest types of India using high temporal satellite data. The major objectives of the study include:
• Estimation of maximum and minimum LAI in Indian forests. • Deriving seasonal patterns of LAI for different forests types • Detailed spatio-temporal analysis of LAI for different types
of India based on their geographical locations. 2. MATERIAL AND METHODS
2.1 Study area and Data used
This study was carried out for Indian forests. The country with a geographical area of 329 Mha is located at north of the equator between 08o04-37o06N and 68o07’-97o25E. It is bounded by the Indian Ocean in the south, Arabian Sea in the west, Bay of Bengal in the east and the Himalayas in the north. The range of topography, temperature and rainfall are responsible for the development of a great variety of macro and micro climates and the resultant rich biological diversity on the Indian subcontinent. The country has been divided into a number of bio-geographic zones based on biota and environmental realms (Rodgers and Panwar, 1988). India has nearly all the representative global ecological zones of South Asia. The overall climate of India is suitable for the growth of forests and country supports an immense variety of forests ranging from tropical rainforests to dry thorn forests based on species composition and plant functional types. The recent estimates by Forest Survey of India present the total forest and tree cover of the country as 78.37 Mha (including 69.09 Mha forest cover), which accounts for 23.84% of the geographic area of the country (SFR, 2009).
2.1.1 Remote Sensing and GIS data used in this study: One of the major data input of this study include MODIS 8-day composites LAI product at 1-km spatial resolution. MODIS is a key instrument aboard the Terra (EOS AM) and Aqua (EOS PM) satellites. Terra's orbit around the Earth is timed so that it passes from north to south across the equator in the morning, while Aqua passes south to north over the equator in the afternoon. Terra MODIS and Aqua MODIS are viewing the entire Earth's surface every 1 to 2 days, acquiring data in 36 spectral bands. Algorithms have been developed to generate a number of land products from MODIS, including LAI/fAPAR (Knyazikhin et al., 1999) that have been made available by the Land Processes-Distributed
Active Archive Center (LP-DAAC) for evaluation/validation and utilization. The level 4 MODIS global LAI and Fractional Photosynthetically Active Radiation (fAPAR) MCD15A2 product combines the data from Terra and Aqua MODIS and includes the science data sets of LAI, FPAR, and a set of quality rating, and standard deviation layers for each variable. The LAI variable defines the number of equivalent layers of leaves relative to a unit of ground area. It is expressed as a dimensionless ratio (m2/m2) of leaf area covering a unit of ground area. FPAR measures the proportion of available radiation in the photosynthetically active wavelengths in the 0.4-0.7 nm spectral range that are absorbed by green vegetation. It is also expressed as a unitless fraction of the incoming radiation received by the land surface. Leaf area index is the biomass equivalent of FPAR. Both variables are used as satellite-derived parameters to calculate surface photosynthesis, evapotranspiration, and net primary production which are used as inputs to calculate terrestrial energy, carbon, water cycle processes, and vegetation biogeochemistry. Both LAI and FPAR variables are computed daily at 1-km from MODIS spectral reflectances and composited over an eight-day period, where the selected value in a compositing period is that with the highest corresponding fAPAR. The MCD15A2 product is projected on the integerized sinusoidal 10o grid, where the globe is tiled into 36 tiles along the east–west axis, and 18 tiles along the north–south axis, and each tile is approximately 1200×1200 km (Myneni et al., 2002). The algorithm is based on rigorous three dimensional radiative transfer (RT) theory. A lookup table (LUT) method is used to achieve inversion of the three-dimensional RT problem. The 250-and/or 500-m resolution bands are aggregated into normalized 1-km resolution grid cells prior to ingestion (R. E. Wolfe, 1998).
Remote sensing based all-India 1-km landuse/landcover classification map over South Central Asia covering the Indian sub-continent and derived using SPOT-Vegetation and DMSP data for the period November 1, 1999 to December 31, 2000 (Agrawal et al., 2003) was used to assign the forest types in the study area. This LU/LC classification includes a total number of 45 classes based on the FAO land cover classification scheme classes. These forest classes correspond to the well known forest classification by Champion and Seth (1968) for the Indian forests. A vector layer of administrative boundary coverage of India in Albers Conical Equal Area projection was used for detailed analysis and deriving spatial patterns in ArcGIS 9.3.1.
2.2 Methodology
2.2.1 Database preparation:A detailed database was prepared using eight-day composites of the MODIS LAI/fAPAR product MCD15A2 version 4 pertaining to 18 tiles (h23v05, h24v05, h24v06, h24v07, h25v05, h25v06, h25v07, h25v08, h25v09, h26v05, h26v06, h26v07, h26v08, h27v05, h27v06, h27v07, h27v08, h27v09) over Indian sub-continent for each of the 46 dates of the study year downloaded from the Land Processes-Distributed Achieve Center (LP-DAAC) website, This dataset at 1-km spatial resolution is available in HDF-EOS format and sinusoidal projection. The 8-day composite data file of each tile was first pre-processed in ENVI 4.4 image processing software. This was followed by mosaicing of all 18 tiles for every single date. Using the ‘MODIS Reprojection Tool’
(http://lpdaac.usgs.gov./lpdaac/tools/modis_reprojection_tool)
geographic lat/long projection. All the 46 (8-day composite) reprojected data files of each tile were then stacked to generate a complete LAI database over Indian sub-continent for the year 2005. A vector layer of administrative boundary coverage of India was used to clip the database and prepare a subset database for the Indian region in ArcGIS.
2.2.2 Remote Sensing data analysis and Generation of LAI maps: The detailed landuse/landcover classification map with 45 classes over South Central Asia was clipped with vector layer of all-India administrative boundary coverage to obtain landuse/landcover classes over India. The different forest types include Tropical Evergreen (TEF), Semi-tropical Evergreen (STEF), Temperate Broadleaved (TeBLF), Tropical Montane, Tropical Semievergreen (TSEF), Temperate Conifer (TeC), Subtropical Conifer (STC), Tropical Moist Deciduous (TMDF), Tropical Dry Deciduous (TDDF), Junipers, Mangroves, Degraded Forest, Dry Woodland, Thorn Forest/Scrub (northern) and Thorn Forest/Scrub (southern). These classes also correspond to Champion and Seth classification (1968) for Indian forests. The forest classes were recoded and a forest mask was prepared in ENVI. This mask along with all-India mosaiced LAI mage was used to generate a forest LAI map with 46 stacked 8-day composites. The mean, minimum and maximum LAI in Indian forests were generated using the modeling tool in ERDAS/IMAGINE 9.1 image processing s/w. The vector layer in form of shape file for each of the forest type were prepared in ArcGIS using the LU/LC classification map. The mean LAI and standard deviation of every 8-day composite of each forest type were estimated using stacked all India mosaiced LAI image and shape file of corresponding forest type to run in batch mode. Based on the geographical locations, Indian forests were classified into seven regions namely; North India, North-East India, West India, Central India, Eastern Ghats, Western Ghats and Andaman & Nicobar Islands. The spatial patterns of mean monthly LAI in different forest types in different locations were also derived. The administrative boundary layer of India was overlaid on LAI images and different maps were generated in ArcGIS. The all-India annual database for the year 2005 was classified into five seasons namely; summer (April-May-June), rainy (July-August), autumn (September-October), winter (November-December-January) and spring (February-March) to study the detailed seasonal patterns of forest LAI. The 8-day composites in each of the season were stacked accordingly to derive the seasonal patterns. The maps were generated in ArcGIS.
3.0 RESULTS AND DISCUSSION
In the present study, an attempt has been made to study LAI of Indian forests and develop their spatio-temporal LAI patterns. The results are discussed below.
3.1Spatio-temporal patterns of Forest LAI
A detailed spatio-temporal analysis of LAI during a normal year of 2005 was carried out. The results indicated that the range of LAI varies from 0.1-6.9 among the different forest types. Variations in LAI result due to the interaction of electromagnetic radiation with vegetation canopies, complex structure and amount of light availability of sparse vegetation (Goel and Strebel, 1983). However, other limiting factors also influence LAI such as water and nutrients availability, stand age and climatic factors. On the
basis of remote sensing derived LU/LC classification, it has been estimated that TDDF and TMDF are the major forest types covering 27.1% and 11.4% of the forest area of the country, respectively. Figure 1 illustrates a broad spatial pattern of maximum LAI in Indian forests during the study year. At few places in North-east India and Western Ghats, forest LAI of more than 5.5, with a maximum value of 6.9 was observed as these are dominated by TEF. A maximum LAI of 2.5 is observed in Central India due to predominance of TDDF. In general, LAI is higher in TMDF as compared to TDDF due to their bigger canopy and leaf growth; however there are wide monthly/seasonal variations as well.
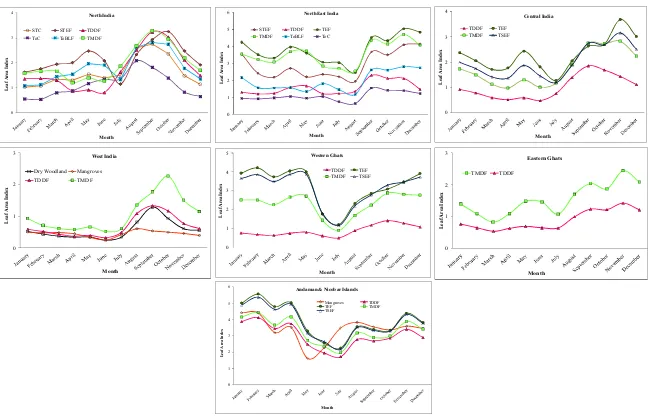
Examination of seasonal patterns indicated the maximum greenness pertaining to high LAI values in autumn season during the months of September and October due to rich vegetation growth after monsoon. Natural vegetation growth in India broadly depends on the monsoon rain (Dash et al., 2010) and pattern described by the 8-day LAI composites broadly coincide with the arrival and withdrawal of the south-west monsoon The minimum LAI is observed in April-May-June months of the summer season with LAI value of 0.5 reported in majority of forest types of the country. The seasonal patterns of LAI in Indian forests are illustrated in the Figure 2. The detailed spatio-temporal analysis of mean monthly LAI across different regions indicated variable patterns among the forest types as presented in the Figure 3. In North India, the major forest types include TeBLF, TeC, TMDF, STC and TDDF. In most of the forest types, peak LAI is observed during September/October followed by leaf-fall with lowest LAI in November and December. In sub-tropical evergreen forests, bimodal curve was observed indicating two peaks in May and October. Leaf initiation begins in February with a peak in May before pre-monsoon showers. Besides the forest types of North India, tropical evergreen forest are dominant in Northeast with peak mean LAI above 5 in November. In few regions like North India and Central India, low LAI values were observed in July particularly for TEF. These may not completely attributed to the cloudy pixels as LAI were generated by applying a scaling factor after masking out water and urban pixels (Knyazikhin et al., 1999). However, Bonan et al. (2002) also reported that evergreen forests show minor greening during the growing season as compared to the deciduous forests and peak LAI occurs during October compared to July and August.
starting around June and ending early by February with almost three months in a year without leaves (Yadav and Yadav, 2008).
By shedding leaves in dry season, they limit evapotranspiration (Dash et al., 2010).
Figure 1: Spatial pattern of maximum LAI in Indian forests
Figure 2: Seasonal patterns of Leaf Area Index in Indian forests
Figure 3: Spatio-temporal patterns of Leaf Area Index in different forest types at different geographical regions of India
Mangroves are another major forest type on Gujarat coast of West India, East Coast and Andaman and Nicobar Islands. Mangroves occur in low lying, broad coastal plains where the topographic gradients are small and the tidal amplitude large. Rainfall is not the only source of moisture as they repeatedly get flooded, and well drained soil supports a rich growth of mangroves. The mean monthly LAI remains low in range of 0.2-0.6 as compared to other tropical species. Western Ghats support rich variety of TEF, TSEF, TMDF and TDDF. Evergreen forests are multilayered and complex in their architectural characteristics. These trees shed their leaves at a slow and steady rate throughout the year, which results in continuous decay and decomposition on the forest floor which is full of leaf litter and decaying wood on which mushrooms, lichen and fungi thrive. Jain et al. (2010) estimated LAI in the range of 1.1-1.2 for understorey (upto to a height of 5m) of TEF in Western Ghats through ground measurements. RS based data analysis indicated that mean monthly LAI pattern remains similar in different forest types in Western Ghats with a peak in May. TDDF has lower LAI values than other forest types as they receive scanty rainfall and high temperature during summer season. Peak greenness is observed in post-monsoon season followed by leaf fall concentrated in cool and dry winter months i.e. from October to February. The Eastern Ghats of India is a broken chain of hills that extends from Orissa to Tamil Nadu and dominated by TMDF and TDDF. Similar patterns of mean monthly LAI were observed with peak values in November. Due to tropical hot and humid climate with abundant rains, the entire in Andaman & Nicobar Islands support very luxuriant and rich vegetation with unique tropical rain/evergreen forest canopy. Rainfall is common there and is generally divided into two phases: May to mid September and November to mid December. Thus, the climate of Andaman and Nicobar Islands is highly favorable for the evergreen forest and mean LAI above 2 throughout the year with a peak of 5.5 in February. The mangrove forests of Andaman are also highly diversified and rich in species composition. Using IRS-P6 LISS-IV data, Madugundu et al. (2008) estimated LAI of 5.24 with a positive relationship between LAI and above ground biomass in deciduous forests of Western Ghats.
The present study results may have few inherent uncertainties due to used RS data. MODIS ver.4 LAI product was generally found to be a significant overestimate compared to in situ observations. Fang and Liang (2005) reported significant regional mean overestimates in savannah (2.5); broadleaf forest (3.7) and needleleaf forest (3.5) using aggregated Landsat ETM+data, a radiative transfer scheme and nonparametric regression methods. Another problem with MODIS estimates are unrealistic day-to-day variations, which result in very noisy seasonal dynamics. Cohen et al. (2006) reported that this was particularly evident during the growing and winter seasons in evergreen needleleaf conifer forests, resulting from cloud and/or snow contamination in the surface reflectance input data. Significantly, it is also stems from the MODIS algorithm taking no account of LAI retrievals from the previous compositing time window. Therefore what in reality is a smoothly varying seasonal LAI, is not depicted by the EO-derived estimate, and values are free to fall and rise unrealistically (Quaife & Lewis, 2010). Since current coarse resolution observations are limited to describe mixed biomes, high spatial (20m–100 m) and temporal (1–10 days) sampling remote sensing observations must be developed to better capture surface spatial heterogeneity (Garrigues et al., 2008).
Furthermore, global algorithms could be supplemented by multiple regional algorithms calibrated using intensive field measurements over particular regions or ecosystems. Broad scale validation of remote sensing derived MODIS LAI product with field measurements is essential for the improved understanding vegetation phenology in different forest types. Remote sensing technology with accurate, timely and dynamic acquisition of LAI at the landscape level requires developing new algorithms optimized for the characteristics of the remote sensors.
4.0 CONCLUSION
India supports an immense variety of forests ranging from tropical evergreen to dry deciduous forest. LAI, being a measure of canopy foliage content is key vegetation characteristic among the different forest types. The study investigated the spatio-temporal and inter-seasonal variations in LAI in different forest types using satellite remote sensing data. The study used Terra and Aqua MODIS combined level 4 8-day composites global LAI/fPAR product for the year 2005 at 1-km spatial resolution. A forest cover mask was generated using SPOT 1-km landuse/landcover classification over Indian region. The range of estimated LAI varied from 0.1-6.9 among the different forest types. At few places in North-east India and Western Ghats, forest LAI of more than 5.5, with a maximum value of 6.9 was observed as these are dominated by tropical evergreen forests. A maximum LAI of 2.5 is observed in Central India due to predominance of TDDF. The inter- seasonal variations indicated that for most of the forest types, the peak LAI values were observed during September and October months of the autumn season in contrast to minimum LAI during summer season. The spatial patterns were derived in ArcGIS using administrative boundary layer of India. The mean LAI and standard deviation for each 8-day LAI composite were also computed and mean monthly LAI profiles were derived for each forest type classified on the basis of their geographical locations. In most of the forest types of North India, peak LAI is observed during September/October followed by leaf-fall with lowest LAI in November and December. Mangroves, which are the major forests on West Coast, East Coast and Andaman and Nicobar Islands reported lower mean monthly LAI in the range of 0.2-0.6 as compared to other tropical species. The spatio-temporal patterns of LAI resulted from this study are very useful indicators for detailed understanding of phenological sequence in different forest types. The study results may also serve as important inputs vis-à-vis climatic parameters for deriving bioclimatic indices for different forest types of India at different locations.
REFERENCES
Agrawal, S. et al., 2003. SPOT-Vegetation multi temporal data for classifying vegetation in South Central Asia. Curr. Sci.
84(11), pp. 1440-48.
Bonan, G. B., 1993. Importance of leaf area index and forest type when estimating photosynthesis in boreal forests. Remote Sens.
Environ., 43, pp. 303-314.
Bonan, G.B. et al., 2002. Landscapes as patches of plant functional types: An integrating concept for climate and ecosystem models. Global Biogeo. Cycles, 16(2), p.5-1-18. Buermann, W. et al., 2001. Evaluation of the utility of satellite-based vegetation leaf area index data for climate simulations. J. Clim., 14, pp. 3536–3550.
Champion, H.G., Seth, S.K., 1968. A revised survey of forest types of India, Manager of Publication, New Delhi.
Chen, J. M. et al., 1997. Leaf area index of boreal forests: Theory, techniques, and measurements. J. Geo. Res. 102, pp. 29429-43. Cohen, W. B. et al., 2006. MODIS landcover and LAI collection 4 product quality across nine sites in the western hemisphere.
IEEE Trans. Geosci. Rem. Sens., 44, pp. 1843−1857.
Dash, J. et al., 2010. The use of MERIS Terrestrial Chlorophyll Index to study spatio-temporal variation in vegetation phenology over India. Rem. Sens. Environ. 114, p. 1388–1402.
DeFries, R., 2008. Terrestrial vegetation in the coupled Human-Earth System: Contributions of Remote Sensing. Ann. Review of
Environmental Resource, 33, pp. 369–90.
Fang, H., Liang, S., 2005. A hybrid inversion method for mapping leaf area index from MODIS data: experiments and application to broadleaf and needleleaf canopies. Remote Sens. Environ, 94, pp. 405−424.
Garrigues, S. et al., 2008. Validation and intercomparison of global LAI products derived from remote sensing data. J.
Geophysical Research, 113, G02028.
Goel, N.S., Strebel, D.E., 1983. Inversion of vegetation canopy reflectance models for estimating agronomic variables. I. Problem definition and initial results using the Suits model. Rem. Sens.
Environ. 13(6), pp. 487–507.
Gong, P. et al., 2003. Estimation of forest leaf area index using vegetation indices derived from Hyperion hyperspectral data.
IEEE Trans. Geosc. and Rem. Sens. 41 (6), pp. 1355-1362.
Jain, M. et al., 2010. Evaluation of methods to estimate foliage density in the understorey of a tropical Evergreen forest. Curr.
Sci. 98 (4), pp. 508-515.
Kalacska, M. et al., 2005. Estimating leaf area index from satellite imagery using Bayesian networks. IEEE Trans. Geosci. and Rem.
Sens. 43(8), pp. 1866−1873.
Kimes, D. S. et al., 2000. Inversion methods for physically-based models. Rem. Sens. Review, 18, pp. 381−440.
Knyazikhin, Y. et al., 1999. MODIS LAI and photosynthetically active radiation absorbed by vegetation product (MOD15) Algorithm Theoretical Basis Document.
Madugundua, R. et al., 2008. Estimation of LAI and above-ground biomass in deciduous forests: Western Ghats of Karnataka, India. Int. J. App. Earth Obs. Geoinf., 10, pp. 211-219.
Mishra, R. K. et al., 2006. Phenology of species of moist deciduous forest sites of Similipal biosphere reserve. Lyonia, 11, pp. 5−17.
Myers, N. et al., 2000. Biodiversity hotspots for conservation priorities. Nature, 403, pp. 853-858. DOI 10.1038/35002501. Myneni, R. B. et al., 2002. Global products of vegetation leaf area and fraction absorbed PAR from year one of MODIS data.
Remote Sens. Environ, 83, pp. 214-231.
Myneni, R. B., Ramakrishna, R., Nemani, R., Running, S. W., 1997. Estimation of global leaf area index and absorbed par using radiative transfer models. IEEE Tran. Geoscience and Rem. Sen.35(6), pp. 1380−1393.
Pandya, M.R. et al., 2006. Leaf area index retrieval using IRS LISS-III sensor data and validation of the MODIS LAI product over central India. IEEE Trans. on Geoscience and Remote
Sensing, 44(7), pp. 1858-1865.
Quaife, T., Lewis, P., 2010. Temporal constraints on linear BRDF model parameters. IEEE Trans. on Geoscience and Rem. Sens.
48, 2445−2450, doi:10.1109/TGRS.2009.2038901.
Rodgers, W. A., Panwar, S. H., 1988, Biogeographic
classification of India (Dehradun: New Forest)
Roy, P. S., Joshi, P. K., 2002. Forest cover assessment in NE India-the potential of temporal wide swath satellite sensor data (IRS-1C WiFS). Int. J. Rem. Sen., 23, pp. 4881-4896.
Saikia, A., 2009. NDVI Variability in North East India. Scottish
Geographical Journal, 125, pp. 195-213.
SFR, 2009. State of the Forest Report, published by Ministry of Environment and Forests, Govt. of India.
Wang, F. et al., 2007. New vegetation index and its application in estimating LAI of rice. Rice Science, 14(3), pp. 195−203. Wolfe, R. E. et al., 1998. MODIS land data storage, gridding, and compositing methodology: Level 2 grid. Remote Sens. Environ, 36, pp. 1324–1338.
Xiao, Z. et al., 2009. A temporally integrated inversion method for estimating leaf area index from MODIS data. IEEE Trans. on
Geoscience and Remote Sensing, 47(8), pp. 2536−2545.
Yadav, R.K., Yadav, A.S., 2008. Phenology of selected woody species in a tropical dry deciduous forest in Rajasthan, India.
Tropical Ecology, 49(1), pp. 25-34, 2008, ISSN 0564-3295.
Zheng, G., Moskal, M.L., 2009. Retrieving leaf area index using remote sensing: Theories, methods and sensors. Sensors, 9, pp. 2719-2745; doi:10.3390/s90402719.
ACKNOWLEDGEMENTS
This study was carried out as a part of ‘Development of remote
sensing based bioclimatic index for Indian region’ project under