UNSUPERVISED WISHART CLASSFICATION OF WETLANDS IN NEWFOUNDLAND,
CANADA USING POLSAR DATA BASED ON FISHER LINEAR DISCRIMINANT
ANALYSIS
F. Mohammadimanesh*a, B. Salehia, M. Mahdianparia, S. Homayounib
a C-CORE and Memorial University of Newfoundland, St. John’s, NL, Canada
b Dept. of Geography, Environmental Studies and Geomatics, University of Ottawa, Ottawa, Canada
Commission VII, WG VII/4
KEY WORDS: Polarimetric Synthetic Aperture Radar (PolSAR), Unsupervised Wishart Classification, Fisher Linear Discrimination, Feature Weighting.
ABSTRACT:
Polarimetric Synthetic Aperture Radar (PolSAR) imagery is a complex multi-dimensional dataset, which is an important source of information for various natural resources and environmental classification and monitoring applications. PolSAR imagery produces valuable information by observing scattering mechanisms from different natural and man-made objects. Land cover mapping using PolSAR data classification is one of the most important applications of SAR remote sensing earth observations, which have gained increasing attention in the recent years. However, one of the most challenging aspects of classification is selecting features with maximum discrimination capability. To address this challenge, a statistical approach based on the Fisher Linear Discriminant Analysis (FLDA) and the incorporation of physical interpretation of PolSAR data into classification is proposed in this paper. After pre-processing of PolSAR data, including the speckle reduction, the H/α classification is used in order to classify the basic scattering mechanisms. Then, a new method for feature weighting, based on the fusion of FLDA and physical interpretation, is implemented. This method proves to increase the classification accuracy as well as increasing between-class discrimination in the final Wishart classification. The proposed method was applied to a full polarimetric C-band RADARSAT-2 data set from Avalon area, Newfoundland and Labrador, Canada. This imagery has been acquired in June 2015, and covers various types of wetlands including bogs, fens, marshes and shallow water. The results were compared with the standard Wishart classification, and an improvement of about 20% was achieved in the overall accuracy. This method provides an opportunity for operational wetland classification in northern latitude with high accuracy using only SAR polarimetric data.
1. INTRODUCTION
Wetlands are important natural features that are tied to climate change, water and carbon cycles. Despite their importance, wetlands have been severely damaged by human interference and poor management (Walter et al. ,2007). Therefore, there is an urgent need to monitor and manage wetland areas. However, wetland mapping and monitoring on large scales is challenging and expensive. Synthetic aperture radar (SAR) has shown to be important for wetland monitoring, especially under conditions in which optical images are useless. SAR images are also able to penetrate vegetation canopies to some degree, in which longer wavelength such as L-band has the deeper penetration capability compared to the shorter wavelengths such as X-band which just interact with upper part of vegetation (Kasischke et al.,1997, Mahdian et al., 2013). Polarimetric SAR (PolSAR) decomposition has gained more attention during the past several decades and has been found to be successful for vegetation mapping of various wetland areas (Cloude, 1988; van Zyl, 1992; Cloude and Pottier
1996; Touzi et al., 2004b.)
Several studies have used remote sensing techniques for wetland monitoring (Dronova et al. 2012; Belluco et al. 2006; Evans et al. 2014; Marechal et al. 2012). For example, a classification approach using spectral and spatial properties of neighbouring pixels has been reported by Dekok and colleagues
(1999). A new method for monitoring the Amazon floodplain using the fusion of single polarized radar data and optical image has also been proposed in Silva et al. (2010). Many classifiers and machine learning methods, such as the maximum likelihood classifier (MLC) (Erdas, 1999), support vector machine (SVM) (Vapnik and Chervonenkis., 2015; Vapnik., 1999; Osuna., 1998), and artificial neural networks (ANNs), have been adopted for PolSAR data classification over wetland regions (Chen et al.,2003). The main challenge of most classification methods is that features with moderate and low between-classes discrimination capabilities are removed and only features with high class separability are incorporated into classification. Another important step in processing of PolSAR data is de-speckling (Mahdian et al., 2013).
In this study, full polarimetric C-band RADARSAT-2 data from the Avalon area in Newfoundland and Labrador, Canada, have used for classification of different vegetation types in wetlands. The utility of using remote sensing to monitor wetlands in the Avalon study area is presented in Section 2. Next, the methodology and the steps of our proposed approach are discussed in detail in Section 3. Section 4 demonstrates the performance of the method with real PolSAR data and discusses the results. Finally, our findings are summarized in the concluding section.
2. CASE STUDY AND REMOTE SENSING DATA
Canada is home to 25 % of the world’s wetlands; more than any other country (Tiner et al., 2015). The present study was, therefore, carried out in the province of Newfoundland and Labrador, a spatially diverse region of approximately 660 � that includes wetlands with diverse characteristics such as bogs, fens, marshes, and shallow water. Wetland complexes are distributed throughout the province and the vegetation in the study area comprises mainly marshes with fewer bogs and fens and swamp. Figure 1 shows the study area which is the Avalon pilot site located in the north eastern portion of the Avalon Peninsula, on the island of Newfoundland, Canada, in the Maritime Barren ecoregion (See Fig. 1).
In this study, two Fine Quad (FQ) RADARSAT2 C-band images, in descending mode, from Study area have used for classification.
Figure 1. The location of study area.
3. METHODOLOGY
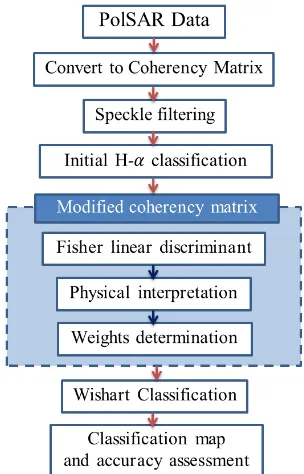
The proposed classification framework includes five major steps (Fig. 2). First, the Sinclair scattering matrix is converted to a coherency matrix because it has more physical interpretation meaning than a covariance matrix. After that, de-speckling as most important step in PolSAR pre-processing should be done (Mahdianpari et al., 2012). This step is followed by an Enhanced Lee adaptive de-speckling step. Then, H/�̅ unsupervised classification is performed to identify the base scattering models, specular, double bounce and volume scattering. In the fourth step, a feature weighting technique is employed in order to determine appropriate features weights. Then, these modified weights are used for supervised Wishart classification. These general steps are described in more detail in the following sections.
Figure 2. The flowchart of proposed method for wetland classification.
3.1 Initial H/α Classification
There are various polarimetric representations of which the most commonly used are the covariance and coherency matrices. The coherency matrix was used in this study because it has more physical meaning and has been captured using Pauli basis (Lee and Pottier., 2009 ) as follows:
� =
√ [ ℎℎ+ �� ℎℎ− �� ℎ�]�
(1)
where ℎ� is the scattering element of horizontal (h) receiving and vertical (v) transmitting polarization, respectively, and other three elements can be similarly defined. The coherency matrix is then generated from the outer product of the Pauli vector with its conjugate transpose as follows:
where the superscript “T” denotes the matrix transpose. In this study, an unsupervised H/α classification approach based on coherency matrix was performed as an initial classification. The
entropy, H, was used to measure the randomness of scattering mechanisms while α is used to determine different types of scattering mechanisms. The parameters were calculated based on the eigenvalues and eigenvectors of the coherency matrix T,
as follows:
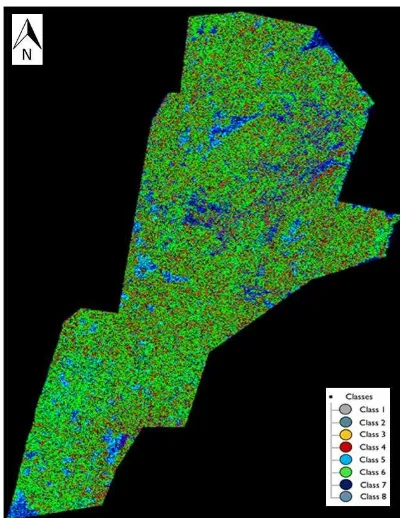
In terms of the H/� plane (Lee and Pottier., 2009), eight initial classes with different scattering mechanisms are acquired and can be seen in Fig. 3.
Figure 3. The initial unsupervised classification using H/α plane.
3.2 Fisher Linear Discriminant Analysis (FLDA)
Linear Discriminant Analysis (LDA) is a classification method that projects high-dimensional data onto a line and performs classification in this one-dimensional space. Specifically, Fisher Linear Discriminant Analysis is a statistical approach for dimensionality reduction using linear transformation. The projection maximizes the distance between the means of the two classes while minimizing the variance within each class. This
defines the Fisher criterion, which is maximized over all linear projections. It has also been successfully applied for image classification (Chen et al.,2015).
In an image with K classes in N dimensions, the Fisher linear discriminant can be formulated as follows:
� = ∑ ∑ − feature and can be illustrated, respectively, as follows:
= ∑ ��
For PolSAR image classification using a coherency matrix, the nine elements are given equal weight in a conventional classification method. This is an applicable scenario for classification of images with different target backscatters. However, this conventional approach can easily either remove some classes with close backscatters or misclassified them. Therefore, a robust technique for feature discrimination can significantly improve classification accuracy.
However, selecting the best feature with maximum discrimination ability is a challenging task. One practical approach is to consider within-class and between-class distances. Ideally, such an approach will keep within-class differences minimal and between-class differences as large as possible. In Fisher Linear Discriminant analysis, the differences between classes are defined using mean differencing and variance summation and are applied to determine within-class differences. Therefore, the following equation is used to determine weight of n-th feature: summation of all weight of feature in different class as follows:
� = � + � + ⋯ + �8
Therefore, the weighting matrix is represented by:
� = � + � + ⋯ + �8= [
� � �
� � �
� � � ]
(11)
The discrimination between classes can be further increased using physical interpretation of different backscatter mechanisms in a modified coherency matrix. According to the H/� plane, 1st and 3rd classes represent the low entropy surface scattering events and the low entropy multiple scattering, respectively. The lack of volume scattering is clear in these two classes. Also, the element only represents the volume scattering mechanism in the coherency matrix. Therefore, adding physical interpretation to the statistical approach makes feature discrimination more powerful by assigning zero weights to the corresponding elements of the Fisher coefficients, as follows:
�∗ = [�� �� ��
� � � ] = [
� �
� � ]
(12)
�∗ = [�� �� ��
� � � ] = [
� �
� � ]
(13)
The final weighting matrix �� can be defined as follows:
��= �∗ + � + �∗ + ⋯ + �8 (14)
The coherency matrix was then modified by multiplying the final weights (��) and coherency matrix (T):
�= ��. = [
�� �� ��
�� �� ��
�� �� ��
]
(15)
This modified coherency matrix with better discriminating capability, was then used in Wishart classification. The experimental results are presented in the following section.
4. EXPERIMENTAL RESULTS AND ANALYSES
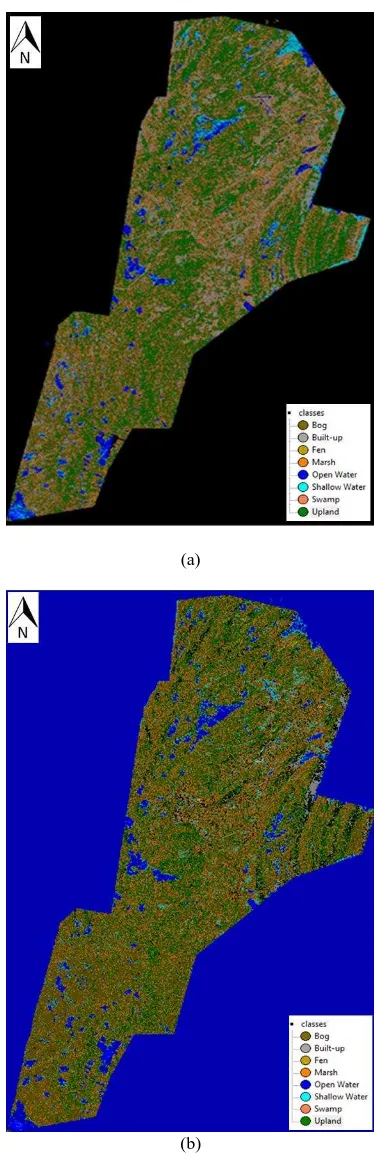
For better evaluation of the proposed method, comparison between two classified maps, one based on conventional Wishart classification and the other based on the proposed method, was performed. The classification map has 8 different wetland classes which are bog, built-up, fen, marsh, open water, shallow water, swamp and upland. Fig. 4 shows the difference between two classifications.
(a)
(b)
Figure 4. Classification results: (a) Wishart classification method, (b) Fisher-based Wishart classification method.
Wishart Classification Method
Table 1. Classification accuracy based on the coherency matrix for conventional and Fisher-based Wishart classification
method.
It is clear from Table 1 that the proposed method was more accurate for classifying wetland types in the study area than the conventional method. In both methods, Wishart classifier was used, but in first scenario, Wishart classification method was applied over a coherency matrix while in the second scenario the modified coherency matrix was considered as an input matrix. The results illustrate the efficiency of combining the physical interpretation and Fisher statistical analysis on a coherency matrix, which was improved by approximate 20 %.
5. CONCLUSIONS
In this study, a novel method for classification of different wetland types was proposed. The method uses H/α classification as its first step to identify the major scattering mechanisms. Fisher Linear Discriminant analysis was applied to modify the weight of the coherency matrix. The proposed method provides the most discriminate features by assigning large weights to strong features. Accordingly, poor features are devalued by assigning them small weights. One of the advantages of the proposed method is removal of irrelevant and redundant features while enhancing the powerful features. Furthermore, physical interpretation was applied to better distinguish classes with close backscatter. The modified weights were then used in Wishart classifier for classification of wetland types using RADARSAT2 images from the Avalon study area in Newfoundland, Canada. The results showed more accurate and reliable land-covers information of various wetland types by the proposed method when compared to the classic ones.
ACKNOWLEDGEMENTS
This research was financially supported by Newfoundland and Labrador Research and Development Corporation Ignite grant and Environment Canada National Wetland Conservation and Atlantic Ecosystem Initiatives Programs. The SAR imagery was provided by Dr. Brian Briscoe from Canadian Centre for Mapping and Earth Observation. The aerial Ortho-photos were provided by Newfoundland and Labrador Department of Municipal and Intergovernmental Affairs, Surveys and Mapping Division. The field data was partly collected by Newfoundland and Labrador Department of Environment and Conservation. The authors thank these organizations for generously supporting and providing such valuable datasets.
REFERENCES
Belluco, E., Camuffo, M., Ferrari, S., Modenese, L., Silvestri, S., Marani, A. and Marani, M., 2006. Mapping salt-marsh vegetation by multispectral and hyperspectral remote sensing. Remote sensing of environment, 105(1), pp.54-67.
Chen, B., Wang, S., Jiao, L., Stolkin, R. and Liu, H., 2015. A Three-Component Fisher-Based Feature Weighting Method for Supervised PolSAR Image Classification. Geoscience and Remote Sensing Letters, IEEE, 12(4), pp.731-735.
Chen, C.T., Chen, K.S. and Lee, J.S., 2003. The use of fully polarimetric information for the fuzzy neural classification of SAR images. Geoscience and Remote Sensing, IEEE Transactions on, 41(9), pp.2089-2100.
Cloude, S.R., 1992. Uniqueness of target decomposition theorems in radar polarimetry. In Direct and inverse methods in radar polarimetry (pp. 267-296). Springer Netherlands.
De Kok, R., Schneider, T. and Ammer, U., 1999. Object-based classification and applications in the alpine forest environment. International Archives of Photogrammetry and Remote Sensing, 32(Part 7), pp.4-3.
Dronova, I., P. Gong, N. E. Clinton, L. Wang, W. Fu, S. Qi, and Y. Liu. 2012. “Landscape Analysis of Wetland Plant Functional Types: The Effects of Image Segmentation Scale, Vegetation Classes, and Classification Methods.” Remote Sensing of Environment, 127: 357–369.
Evans, T.L., Costa, M., Tomas, W.M. and Camilo, A.R., 2014. Large-scale habitat mapping of the Brazilian Pantanal wetland: A synthetic aperture radar approach. Remote Sensing of Environment, 155, pp.89-108.
Guide, E.F., 1999. Erdas Inc. Atlanta, Georgia, 672, p.94. Kasischke, E.S., Melack, J.M. and Dobson, M.C., 1997. The use of imaging radars for ecological applications—a review. Remote Sensing of Environment, 59(2), pp.141-156.
Liu, C. and Wechsler, H., 2002. Gabor feature based classification using the enhanced fisher linear discriminant model for face recognition. Image processing, IEEE Transactions on, 11(4), pp.467-476.
Mahdian, M., Homayouni, S., Fazel, M.A. and Mohammadimanesh, F., 2013. Agricultural land classification based on statistical analysis of full polarimetric SAR data. International Archives of the Photogrammetry, Remote Sensing and Spatial Information Sciences, 1, p.W3.
Mahdian, M., Motagh, M. and Akbari, V., 2013. Image enhancement and speckle reduction of full polarimetric SAR data by Gaussian Markov random field. ISPRS-International Archives of the Photogrammetry, Remote Sensing and Spatial Information Sciences, 1(3), pp.263-267.
Mahdianpari, M., Motagh, M. and Akbari, V., 2012, July. Speckle reduction and restoration of synthetic aperture radar data with an adoptive markov random field model. In Geoscience and Remote Sensing Symposium (IGARSS), 2012 IEEE International (pp. 1-4). IEEE.
Marechal, C., Pottier, E., Hubert-Moy, L. and Rapinel, S., 2012. One year wetland survey investigations from quad-pol RADARSAT-2 time-series SAR images. Canadian Journal of Remote Sensing, 38(3), pp.240-252.
Osuna, E.E., 1998. Support vector machines: Training and applications (Doctoral dissertation, Massachusetts Institute of Technology).
Silva, T.S.F., Costa, M.P. and Melack, J.M., 2010. Spatial and temporal variability of macrophyte cover and productivity in the eastern Amazon floodplain: A remote sensing approach. Remote Sensing of Environment, 114(9), pp.1998-2010.
Tiner, R.W., Lang, M.W. and Klemas, V.V. eds., 2015. Remote Sensing of Wetlands: Applications and Advances. CRC Press.
Touzi, R., Boerner, W.M., Lee, J.S. and Lueneburg, E., 2004. A review of polarimetry in the context of synthetic aperture radar: concepts and information extraction. Canadian Journal of Remote Sensing, 30(3), pp.380-407.
Van Zyl, J.J., 1992. Application of Cloude's target decomposition theorem to polarimetric imaging radar data [1748-14]. In PROCEEDINGS-SPIE THE INTERNATIONAL SOCIETY FOR OPTICAL ENGINEERING, SPIE INTERNATIONAL SOCIETY FOR OPTICAL , pp. 184-184.
Vapnik, V.N. and Chervonenkis, A.Y., 2015. On the uniform convergence of relative frequencies of events to their probabilities. In Measures of Complexity (pp. 11-30). Springer International Publishing.
Vapnik, V.N., 1999. An overview of statistical learning theory. Neural Networks, IEEE Transactions on, 10(5), pp.988-999.
Walter, K.M., Edwards, M.E., Grosse, G., Zimov, S.A. and Chapin, F.S., 2007. Thermokarst lakes as a source of atmospheric CH4 during the last deglaciation. science, 318(5850), pp.633-636.