POTENTIAL OF MULTITEMPORAL TANDEM-X DERIVED CROP SURFACE MODELS
FOR MAIZE GROWTH MONITORING
C. H¨utta∗, N. Tillya, H. Schiedungb, G. Baretha
a
University of Cologne, Institute of Geography, 50923 Cologne, Germany - ( christoph.huett, nora.tilly, g.bareth, )@uni-koeln.de bUniversity of Bonn, Institute of Crop Science and Resource Conservation, 53121 Bonn, Germany - [email protected]
KEY WORDS:SAR Interferometry, Agriculture, Maize Monitoring, TanDEM-X, SAR, Crop Heights, Radar Remote Sensing
ABSTRACT:
In this study, first results of retrieving plant heights of maize fields from multitemporal TanDEM-X images are shown. Three TanDEM-X dual polarization spotlight acquisitions were taken over a rural area in Germany in the growing season 2014. By interferometric processing, digital terrain models (DTM) were derived for each date with 5 m resolution. From the data of the first acquisition (June 1st) taken before planting, a DTM of the bare ground is generated. The data of the following acquisition dates (July 15th, July 26th) are used to establish crop surface models (CSM). A CSM represents the crop surface of a whole field in a high reso-lution. By subtracting the DTM of the ground from each CSM, the actual plant height is calculated. Within these data sets 30 maize fields in the area of interest could be detected and verified by external land use data. Besides the spaceborne measurements, one of the maize fields was intensively investigated using terrestrial laser scanning (TLS), which was carried out at the same dates as the predicted TanDEM-X acquisitions. Visual inspection of the derived plant heights, and accordance of the individually processed polarisations over the maize fields, demonstrate the feasibility of the proposed method. Unfortunately, the infield variability of the intensively monitored field could not be successfully captured in the TanDEM-X derived plant heights and merely the general trend is visible. Nevertheless, the study shows the potential of the TanDEM-X constellation for maize height monitoring on field level.
1. INTRODUCTION
The TanDEM-X Constellation (TDM) consists of the Synthetic Aperture Radar (SAR) satellites TerraSAR-X and TanDEM-X that fly in a close formation. TDM is the first satellite based solution for single pass radar interferometry (Krieger et al., 2007). Its main aim is the generation of a global elevation model. During the science phase other objectives can be pursued with innovative imaging modes, such as the one presented in this study.
Maize is one of the most important crops in the world. It is used to produce bio-fuel, but most importantly it serves as food for humans and animals (Nuss and Tanumihardjo, 2010). In the con-text of a growing world population and decreasing area that is available for agriculture, a higher productivity is needed (Spiertz, 2013). Therefore, accurate information about the state of maize fields is of great importance to allow precision agriculture tech-niques. In this context, is has been demonstrated that parame-ters based on optical and near infrared reflections, such as the Normalized Differenced Vegetation Index (NDVI) correlate with plant height of maize (Freeman et al., 2007). Furthermore, Free-man et al. (2007) proposed a combined usage of plant height and NDVI to estimate biomass accumulation, resulting in an improved application of nitrogen.
Maize can be monitored from space using the visible and infrared part of the electromagnetic spectrum alone (Claverie et al., 2012; Pimstein et al., 2007). However, these techniques require cloud-free conditions and are therefore not reliable. In contrast, SAR is an all weather, day and night imaging system. Besides, the commonly used approach to use vegetation indices suffers from saturation effects (Chen et al., 2006). Especially for monitoring maize plants, that gain a lot of height during the growing period, additional information about plant height, extracted from SAR images could help to overcome such saturation effects.
∗Corresponding author
Accordingly, spaceborne SAR interferometry, such as from the ERS-Tandem mission (Santoro et al., 2010), has been utilized for maize monitoring. Though, the fast decorrelation of plants in general, mainly due to wind, resulting in a changing geometry of plants, hindered height retrieval. The innovative bistatic inter-ferometric capability of TDM allows height retrieval even of mov-ing vegetation. Therefore, TDM data has been used for height re-trieval and biomass estimation of forests (Kugler et al., 2014) and the potential for agricultural purposes have already been demons-trated on paddy rice (Rossi and Erten, 2015).
In the context of such promising capabilities of TDM, the objec-tive of this paper is to investigate the potential of TDM for maize growth monitoring. We present first results of height retrieval by combining TDM image pairs from three dates. At each date, high resolution spotlight images with two independent polarisations were acquired with the same viewing geometry. As maize fields merely gain about 3 m in height, an increased baseline configura-tion of the TDM was favoured, making it sensitive to the height variations of growing maize fields. The results are evaluated by comparing the heights from the two polarisations over all maize fields in the area of interest. For further reference, one maize field was intensively monitored using terrestrial laser scanning (TLS) and manual measurements within the field at similar dates as the images acquired from TDM.
2. STUDY SITE AND DATA SETS
The measurements were carried out over a collection of maize fields near J¨ulich, Germany (50.8◦N, 6.4◦E) in 2014. As the area is characterised by fertile soils, it provides good conditions for intense agricultural production. The main crops include maize, wheat, barley, sugar beet and potatoes. The terrain is virtually flat with slopes rarely exceeding 3◦. The mean elevation is about 140 m above sea level.
exact dates and individual characteristics of the acquisitions can be found in Table 1. As it can be seen, they have a Height of Ambiguity (HoA) reaching from 21.5 m to 27 m, which is a low value for the TDM, which makes the measurements sensitive to small height variances. All other configurations of the acquisi-tions were the same for all three image pairs: The viewing ge-ometry is steep-looking with an incidence angle of only 23.4◦. The polarization configuration is HH/VV for both satellites. This configuration results in 4 independent images for every acquisi-tion, as they were taken in the standard bistatic mode with one satellite serving as the transmitter and both satellites as recorder of the same signal (Krieger et al., 2007). While the pixel spac-ing of the products is 0.9 m x 1.8 m (range x azimuth), the actual spatial resolution of the images is about 2 m.
Table 1. TanDEM-X acquisitions that were used in this study. All acquisition are in Spotlight HS Mode with dual Polarisation HH/VV + HH/VV. They taken from relative orbit 40 (ascending) and have an incidence angle of 23.4◦.
No. Date Height of Ambiguity [m]
Effective Baseline [m]
1 June 1, 2014 -22.90 151.13
2 July 15, 2014 -21.58 160.29
3 July 26, 2014 -27.11 127.60
On the predicted dates of the TDM acquisitions TLS was carried out on the same maize field that was already investigated one year earlier (H¨utt et al., 2014; Tilly et al., 2014). Based on experiences gained in this previous year, the scanning dates were planned to be in the time-frame where the most plant growth was anticipated. The actual measurements took place on June 13, June 26, July 15, and July 31. On each date the field was scanned with the TLS sys-tem Riegl LMS-Z420i (Riegl GmbH, 2010) mounted on a cherry picker. Four positions close to the corners of the field were estab-lished to cover the whole field and minimize shadowing effects. An illustration of the methodology to use TLS-derived crop sur-face models for plant monitoring is given by Tilly et al. (2014).
2.1 Interferometric Processing of the TDM acquisitions
The dual polarimetric measurement on both satellites results in four independent images for each acquisition. The images taken by the TDM constellation were preprocessed by the data provider DLR and delivered in CoSSC data format. All images resulting from one acquisition are already co-registered and filtered to the same Doppler spectrum (Duque et al., 2012). They can be di-rectly used for interferogram generation. There is also no need for additional bistatic considerations.
We used the SNAP processing environment (SNAP-ESA, 2016), which conveniently also subtracts the flat earth phase and com-putes the coherence during the interferogram generation. Each polarisation was treated separately. In consequence there are two independent interferograms from every acquisition. The result of this first processing step can be seen in Figure 2.
The next step was a multilooking, which decreases the pixel spac-ing, but also the unwanted speckle effect. We chose 2 pixels in range and 3 pixels in azimuth. The result of this processing step can be seen in Figure 3.
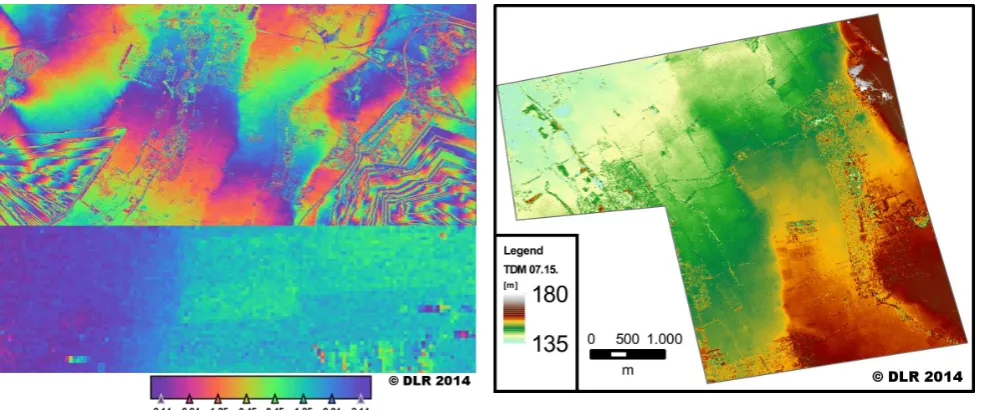
The observed phase values are in modulo 2π. A process called phase unwrapping estimates unambiguous phase values from those modulo 2π interferograms. We used the SNAPHU algorithm (Chen and Zebker, 2002) with MST initialisation and the statistical-cost method TOPO (see Figure 4).
Figure 1. Cherry Picker with Riegl Scanner next to the maize field, date: June 13, 2014.
Figure 2. Interferogram generated from the TDM pair of July 15, 2014 (HH-Polarisation), left: whole scene, right: over the intensively monitored maize field.
Geocoding of all images was done by using the range doppler terrain correction (Curlander and McDonough, 1991; Dowman, 1992) with the help of a high resolution digital terrain model (DTM) (Scilands-GmbH, 2010). Final pixel spacing was set to 5 m during this process.
For geographic reference, we also processed a mean amplitude image with the same geometry. The very high relative accuracy of the images from one acquisition made it possible to stack the reference image with the two interferograms (HH+VV). Surpris-ingly, we found the absolute geometric accuracy of the TDM im-ages to be not sufficient for a multitemporal pixel based process-ing. This issue was solved by co-registering the stack of each TDM acquisition to high resolution and highly accurate digital orthophotos (Geobasis-NRW, 2014). The achieved accuracy was high, as the resulting root mean square error (RMSE) was always below half a pixel (2.5 m).
Figure 3. Multilooked Interferogram generated from the TDM pair of July 15, 2014, top: whole scene, bottom: over the inten-sively monitored maize field.
Figure 4. Unwrapped Phase generated from the TDM pair of July 15, 2014.
formula 1 to transfer the values to meters.
heigth[m] = HoA∗unwrappedphase
2π (1)
Obtaining absolute height values was achieved by subtracting the high resolution reference DTM (Scilands-GmbH, 2010) from the TDM-derived DTM. Next, the median value of this Difference-DTM was used as offset-value to get the absolute ground height. Figure 5 shows the final DTM from HH-polarisation. The de-scribed processing was equally applied to all three TDM acquisi-tions for each polarisation individually, resulting in 6 DTMs.
2.2 Using crop surface models for plant height calculation
At the first TDM acquisition date (June 1st) the maize plants were just about to emerge. Consequently, the DTM derived from this date was used to calculate a DTM representing the bare ground. As no significant difference of the DTMs from HH- and VV-polarization was observed, we used the mean value of both DTMs. The later dates (July 15th, July 26th) were used to calculate crop surface models (CSM). As introduced by Hoffmeister et al. (2009) CSMs represent the surface of a whole field with a high spatial resolution. By subtracting the DTM of the bare ground from the CSM the plant height is calculated.
Figure 5. Geocoded DTM, generated from the TDM pair from 15.07.2014 (HH-Polarization images only)
3. RESULTS
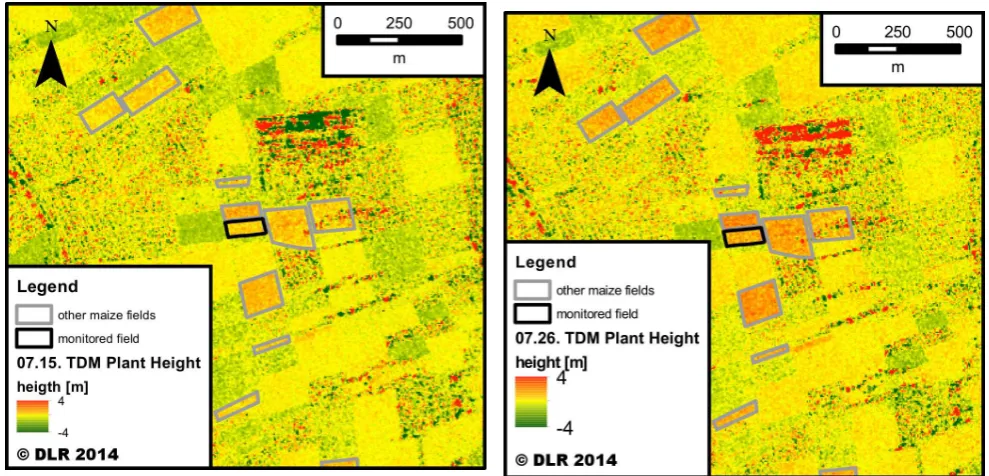
Applying the described methodology resulted in rasters repre-senting the difference in height between the first TDM acquisition and the later acquisitions. While the former is taken at the time, where merely the ground of the maize fields was visible, the lat-ter were acquired at the time where the maize plants were devel-oped. Therefore, this difference can be interpreted as maize plant height at the time of the later acquisitions. A high coherence over the maize fields made it possible to create Figures 6 and 7, which give an overview of the final plant heights acquired over the study area. Maize plants are clearly visible as the crops that gained the most height during the observation period in the study area. Con-sequently, they could be identified in these images. Furthermore, the identification is in accordance with land use classification data of this region (Lussem and Waldhoff, 2014), which was generated using multitemporal optical satellite images and the land use class maize was validated with high accuracy (Waldhoff and Bareth, 2009). To some degree the maps presented in Figures 6 and 7 can be used to identify delayed growth of some maize fields. How-ever, there is still a high degree of noise, as a result of the speckle effect, within the fields.
While the proposed methodology was developed for monitoring growing maize fields, the images also reveal interesting facts of the nearby fields. Some of these non-maize fields show merely a pure noise pattern, because the processing over those fields failed. This is mostly because of low coherence at one of the TDM acquisitions. The field westwards of the intensively moni-tored field shows negative plant heights. This field was a rapeseed fields, which has been harvested in between the image acquisi-tions. Consequently, this results in a lower surface at the later acquisition and is therefore represented as negative plant height in the Figures 6 and 7.
Figure 6. Heigth difference between June 1st and July 15th, de-rived from TDM.
plant heights, extracted from the two polarizations are well in accordance. They only differ very slightly from each other and no general difference of the polarizations can be observed.
After internal validation of the TDM-derived plant heights using the two polarizations separately, the heights retrieved from TDM were compared to TLS-derived height values. Figure 9 shows the result of the TLS-derived heights plotted against the TDM-derived heights over the intensively monitored maize field. For each TDM pixel the mean TLS-derived plant height was calcu-lated. The TDM-derived plant heights show a fairly high standard deviation compared to the plant heights derived from the TLS measurements. Generally, the TDM data tempts to underestimate maize plant heights and merely the general trend of maize plant growth is visible. The pixel-based values of the TLS- and TDM-derived plant heights were not correlated.
4. DISCUSSION
In this paper, we investigated the potential of TDM for maize growth monitoring. Our results show that maize field heights can be successfully extracted from multitemporal, dual polari-metric TanDEM-X observations. The high resolution spotlight mode was useful for monitoring maize growth on a field basis. A successful validation using the two polarizations individually indicates the usability of the proposed method (shown in figure 8). Unlike (Rossi and Erten, 2015) who found polarization and growth state related height differences in paddy rice, no differ-ence of the heights obtained from the different polarisations was detected.
One limitation of this study is the quantification of the in-field variability of the intensively monitored field. The comparison to the TLS measurements revealed an underestimation of the maize plant height derived from TDM and a high standard deviation of the TDM-derived plant heights compared to the TLS-derived plant heights. The former can partly be explained by the differ-ence of the observation angle. Even though the Laser Scanner was mounted on a cherry picker that reached a height of 8 m above the ground, the angle was still oblique compared to the
Figure 7. Heigth difference between June 1 st and July 26th, derived from TDM.
Figure 8. Mean height values from HH- and VV-Polarisations over of the maize fields of the region, generated from the TDM acquisitions No. 1 and 2 (Table 1) (n = 30).
steep incidence angle of TDM of 23.4◦. The consequence of this steep angle should be a much deeper penetration of the radar sig-nal into the maize field, whereas the oblique view of the TLS mainly interacts with higher parts of the plant.
Regarding the high standard deviation of the TDM-derived maize plant heights there are several issues to be taken into account. A key issue is the effective baseline of the TDM at image acqui-sition and the resulting HoA. For the analysis of complex ter-rain, higher HoAs and lower baselines prevent phase ambiguities. However, in this study, phase ambiguities were not an issue due to the low relief of the study site. Consequently, a much lower HoA and longer effective baselines would result in a higher sen-sitivity to the height differences within the maize fields. Another issue is the complex structure maize fields with multiple scat-terers per SAR resolution cell resulting in speckle noise. This noise was already reduced by multilooking (Section 2.). Con-versely, the disadvantage of multilooking is a reduced spatial res-olution, whereas a higher resolution of the final difference maps would improve sensitivity to small scale height differences of the maize field. Interferometric phase filtering (Lee et al., 1998) in-stead of multilooking could be used to decrease the speckle effect. Furthermore, potential quality improvements can be achieved by considering atmospheric path delays (Fritz et al., 2011), which have not been taken into account at the presented processing chain.
In summary, our study shows that it is possible to obtain maize plant heights from the bistatic interferometric phase measure-ments of TDM. Since maize plant height correlates with maize biomass (Freeman et al., 2007), there is now the potential to es-timate the actual biomass accumulation of maize fields, over an extended area, and regardless of the weather conditions.
5. CONCLUSIONS AND OUTLOOK
The study is a first attempt to retrieve maize plant heights based on interferometric processing of multitemporal TDM acquisitions. Plant height of maize fields could be spatially visualized and the results show the potential to monitor maize field heights. How-ever, the reference data acquired with TLS on one maize field, revealed the limitations of the approach to monitor the in-field variability, which could not be detected from the TDM data so far. Future studies could include additional reference data, in-vestigations of polarimetric interferometric (PolIn) SAR features and integration of additional TanDEM-X acquisitions with differ-ent viewing geometries.
6. ACKNOWLEDGMENTS
The TerraSAR-X / Tandem-X data were provided by DLR un-der the proposal: no. XTI VEGE1746: Potential of Single Pass PolInSAR for Agriculture Monitoring.
References
Chen, C. W. and Zebker, H. A., 2002. Phase unwrapping for large sar interferograms: statistical segmentation and general-ized network models. IEEE Transactions on Geoscience and Remote Sensing40(8), pp. 1709–1719.
Chen, P.-Y., Fedosejevs, G., Tiscareno-Lopez, M. and Arnold, J. G., 2006. Assessment of modis-evi, modis-ndvi and vegetation-ndvi composite data using agricultural measure-ments: an example at corn fields in western mexico. Envi-ronmental monitoring and assessment119(1-3), pp. 69–82.
Claverie, M., Demarez, V., Duchemin, B., Hagolle, O., Ducrot, D., Marais-Sicre, C., Dejoux, J.-F., Huc, M., Keravec, P., B´eziat, P. et al., 2012. Maize and sunflower biomass estima-tion in southwest france using high spatial and temporal res-olution remote sensing data. Remote Sensing of Environment 124, pp. 844–857.
Curlander, J. C. and McDonough, R. N., 1991. Synthetic aperture radar- Systems and signal processing. New York: John Wiley & Sons, Inc.
Dowman, I., 1992. The geometry of SAR images for geocod-ing and stereo applications. International Journal of Remote Sensing13, pp. 1609–1617.
Duque, S., Balss, U., Rossi, C. and Fritz, T., 2012. Cossc gener-ation and interferometric considergener-ations.
Freeman, K. W., Girma, K., Arnall, D. B., Mullen, R. W., Martin, K. L., Teal, R. K. and Raun, W. R., 2007. By-plant prediction of corn forage biomass and nitrogen uptake at various growth stages using remote sensing and plant height.Agronomy Jour-nal99(2), pp. 530–536.
Fritz, T., Rossi, C., Yague-Martinez, N., Rodriguez-Gonzalez, F., Lachaise, M. and Breit, H., 2011. Interferometric processing of tandem-x data. In: Geoscience and Remote Sensing Sym-posium (IGARSS), 2011 IEEE International, IEEE, pp. 2428– 2431.
Geobasis-NRW, 2014. Digitale orthophotos, http://www.bezreg-koeln.nrw.de/brk
internet/geobasis/luftbilderzeugnisse/digitale-orthophotos/index.html.
Hoffmeister, D., Bolten, A., Curdt, C., Waldhoff, G. and Bareth, G., 2009. High-resolution crop surface models (csm) and crop volume models (cvm) on field level by terrestrial laser scan-ning. In:The Sixth International Symposium on Digital Earth, International Society for Optics and Photonics.
H¨utt, C., Schiedung, H., Tilly, N. and Bareth, G., 2014. Fusion of high resolution remote sensing images and terrestrial laser scanning for improved biomass estimation of maize. The In-ternational Archives of Photogrammetry, Remote Sensing and Spatial Information Sciences40(7), pp. 101–108.
Krieger, G., Moreira, A., Fiedler, H., Hajnsek, I., Werner, M., Younis, M. and Zink, M., 2007. Tandem-x: A satellite forma-tion for high-resoluforma-tion sar interferometry.Geoscience and Re-mote Sensing, IEEE Transactions on45(11), pp. 3317–3341.
Kugler, F., Schulze, D., Hajnsek, I., Pretzsch, H. and Papathanas-siou, K. P., 2014. Tandem-x pol-insar performance for for-est height for-estimation. Geoscience and Remote Sensing, IEEE Transactions on52(10), pp. 6404–6422.
Lee, J.-S., Papathanassiou, K. P., Ainsworth, T. L., Grunes, M. R. and Reigber, A., 1998. A new technique for noise filtering of sar interferometric phase images. Geoscience and Remote Sensing, IEEE Transactions on36(5), pp. 1456–1465.
Lussem, U. and Waldhoff, G., 2014. Enhanced land use classification 2014 of the rur catchment - update, crc/tr32 database (tr32db). accessed from http://tr32db.uni-koeln.de/data.php?dataid=1142 at 2016-01-09.
Pimstein, A., Karnieli, A. and Bonfil, D. J., 2007. Wheat and maize monitoring based on ground spectral measurements and multivariate data analysis.Journal of Applied Remote Sensing.
Rossi, C. and Erten, E., 2015. Paddy-rice monitoring using tandem-x. Geoscience and Remote Sensing, IEEE Transac-tions on53(2), pp. 900–910.
Santoro, M., Wegm¨uller, U. and Askne, J. I., 2010. Signatures of ers–envisat interferometric sar coherence and phase of short vegetation: an analysis in the case of maize fields.Geoscience and Remote Sensing, IEEE Transactions on48(4), pp. 1702– 1713.
Scilands-GmbH, 2010. Digital Elevation Model 10 with anthro-pogenic landforms, Goettingen, Germany.
SNAP-ESA, 2016. Sentinel application platform v2.0.2, http://step.esa.int.
Spiertz, H., 2013. Challenges for crop production research in improving land use, productivity and sustainability. Sustain-ability5(4), pp. 1632–1644.
Tilly, N., Hoffmeister, D., Schiedung, H., H¨utt, C., Brands, J. and Bareth, G., 2014. Terrestrial laser scanning for plant height measurement and biomass estimation of maize. The Interna-tional Archives of Photogrammetry, Remote Sensing and Spa-tial Information Sciences40(7), pp. 181–187.