EVALUATING DENSE 3D RECONSTRUCTION SOFTWARE PACKAGES FOR OBLIQUE
MONITORING OF CROP CANOPY SURFACE
S. Brocksa,∗, G. Baretha
a
Institue of Geography, GIS & RS Group, University of Cologne, AlbertusMagnusPlatz, 50923 K¨oln, Germany -(sebastian.brocks, g.bareth)@uni-koeln.de
KEY WORDS:structure-from-motion, csm, crop surface monitoring, 3D, oblique, vegetation, monitoring, comparison
ABSTRACT:
Crop Surface Models (CSMs) are 2.5D raster surfaces representing absolute plant canopy height. Using multiple CMSs generated from data acquired at multiple time steps, a crop surface monitoring is enabled. This makes it possible to monitor crop growth over time and can be used for monitoring in-field crop growth variability which is useful in the context of high-throughput phenotyping. This study aims to evaluate several software packages for dense 3D reconstruction from multiple overlapping RGB images on field and plot-scale. A summer barley field experiment located at the Campus Klein-Altendorf of University of Bonn was observed by acquiring stereo images from an oblique angle using consumer-grade smart cameras. Two such cameras were mounted at an elevation of 10 m and acquired images for a period of two months during the growing period of 2014. The field experiment consisted of nine barley cultivars that were cultivated in multiple repetitions and nitrogen treatments. Manual plant height measurements were carried out at four dates during the observation period. The software packages Agisoft PhotoScan, VisualSfM with CMVS/PMVS2 and SURE are investigated. The point clouds are georeferenced through a set of ground control points. Where adequate results are reached, a statistical analysis is performed.
1. INTRODUCTION
Crop Surface Models (CSMs) as introduced by Hoffmeister et al. (2010) are 2.5D raster surfaces representing absolute plant canopy height. Using multiple CMSs generated from data ac-quired at multiple time steps, a crop surface monitoring is en-abled. This makes it possible to monitor crop growth over time and can be used for monitoring in-field crop growth variability which is useful in the context of high-throughput phenotyping. CSMs can be generated using different sensor types such as laser scanners (Tilly et al., 2013, 2014) or from overlapping red, green, blue (RGB) imagery both from aerially acquired nadir imagery (Bendig et al., 2013) and oblique imagery (Brocks and Bareth, 2014) using Structure-from-Motion (SfM) and dense 3D recon-struction techniques. Comparisons of different software pack-ages and algorithms for dense 3d reconstruction have been per-formed (Eltner and Schneider, 2015; Remondino et al., 2014; Grenzd¨orffer, 2014; Dall’Asta and Roncella, 2014; Brutto and Meli, 2012), but none for the specific scenario tested in this study. Here, we compare the suitability of several software packages for the generation of CSMs from oblique stereo imagery acquired from a terrestrial platform with converging image axes.
2. STUDY SITE
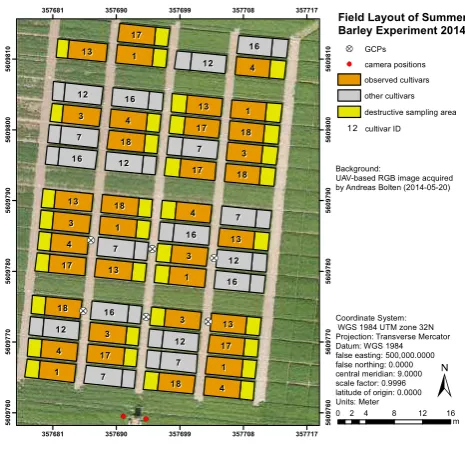
The study site was a summer barley field experiment at the Cam-pus Klein-Altendorf (N50°37′27′′, E6°59′16′′) of the
Univer-sity of Bonn’s Faculty of Agriculture The experiment was set-up by the CROP.SENSe.net (http://www.cropsense.uni-bonn.de) interdisciplinary research network that is working towards non-destructively analyzing and screening plant phenotype and crop status such as nutrients and stress. For this field experiment, nine barley cultivars were cultivated with two nitrogen treatments (40 kg N/ha and 80 kg N/ha) in three repetitions. Figure 1 shows an overview of the study site.
∗Corresponding author
3 Projection: Transverse Mercator Datum: WGS 1984 false easting: 500,000.0000 false northing: 0.0000 central meridian: 9.0000 scale factor: 0.9996 latitude of origin: 0.0000 Units: Meter
0 2 4 8 12 16 m Background:
UAV-based RGB image acquired by Andreas Bolten (2014-05-20)
Field Layout of Summer Barley Experiment 2014
camera positions observed cultivars other cultivars destructive sampling area cultivar ID
12 12
GCPs
Figure 1. Study site
The seeding density was 300 plants/m2and the row spacing was
3. METHODS AND DATA
3.1 Structure-from-Motion and Multi-View-Stereo
Structure-from-Motion (SfM) (Ullman, 1979) and Multi-View-Stereo (MVS) (Seitz et al., 2006) are techniques to derive 3D information from 2D red, green, blue (RGB) imagery that depict the same object from different points of view and are thus over-lapping. Specifically, SfM is used to derive internal and external camera orientation from a set of images, therefore reconstruct-ing the 3D geometry of a scene. This is realized by usreconstruct-ing algo-rithms such as the well-known Scale Invariant Feature Transform (SIFT) (Lowe, 1999, 2004). Using this approach, a sparse point cloud containing the detected feature points is generated. This, along with the scene geometry, i.e., the camera coordinates for each RGB image used as input, can then be used to generate a dense point cloud representing the objects pictured in the images. For this, MVS algorithms are used.
3.1.1 Agisoft Photoscan Agisoft Photoscan is a commercial
dense 3D reconstruction software packages that allows the user to generate spatial 3D data from 2D imagery. It uses SFM and dense 3D reconstruction algorithms and provides a graphical user interface that is easy to use. Due to its commercial black-box nature, the exact algorithms used are not known. According to the developers, it uses an approach similar to SIFT for detect-ing feature points and then estimates internal and external cam-era orientation using a greedy algorithm, refining the result us-ing a bundle adjustment (Semyonov, 2011; Triggs et al., 2000). Dense 3D reconstruction is performed using different algorithms such as MVS or pair-wise depth map computation, depending on user settings. Photoscan georeferences the generated point clouds through ground control points. The GCPs’ coordinates have to be entered and they need to be marked on the input images.
3.1.2 SURE SURE (Rothermel and Wenzel, 2012) is a
com-mercial software package for dense point cloud generation from an overlapping set of images and its orientation. A free version is available for research purposes. It generates up to one 3D point per pixel of input images, allowing a highly-detailed result. Be-cause it requires the images orientations as input, previous pro-cessing using other SfM software packages is required.
3.1.3 VisualSFM and PMVS/CMVS2 VisualSFM is a free
visual SfM system (Wu, 2013) that uses bundle adjustment (Wu et al., 2011) and SIFT (Wu, 2007) for 3D reconstruction using SfM. It integrates the dense 3D reconstruction software PMVS/ CMVS2 (Furukawa and Ponce, 2010; Furukawa et al., 2010) that uses MVS algorithms.
3.2 Data Acquisition
Oblique stereo imagery of the field experiment was acquired daily at three times throughout the growing period by using two Sam-sung Galaxy Camera EK-GC100 smart cameras. The cameras feature a 4.1˜86.1 mm focal length (23˜483 mm 35 mm equiva-lent) lens, a 1/2.3 ” BSI CMOS sensor with a maximum resolution of 16 megapixels (4608 x 3456), ISO settings from 100 to 3200, a shutter speed from 16 to 1/2000 s and an aperture from f/2.8 to 5.9 along with Wifi and mobile network connectivity. They were mounted at a height of 10 m and a horizontal distance of 3.6 m be-tween each other on a hydraulic hoisting platform. Image taking was automated by using a custom-developed Android application that acquired images three times daily at different exposure times. Details of the data acquisition application have been shown by Brocks and Bareth (2014). Images were acquired from May 02 until June 30, 2014, with some breaks due to technical issues with the power supply.
3.3 3D reconstruction
To be able to compare the different software packages, all image pairs acquired on the dates of the manual plant height measure-ments where processed using PhotoScan, SURE and VisualSfM with PMVS/CMVS2. The dates of the image acquisition were May 08, May 23, June 05 and June 17.
For PhotoScan, the following workflow was observed: After adding the image pair to a processing workspace, the ground control points were marked on the images and their coordinates entered. Then, the photos were aligned and the alignment was optimized using the default settings. Finally the dense point cloud was gen-erated with the ”high” quality setting and the gengen-erated georefer-enced dense point cloud was exported for analysis.
Using SURE, a different workflow was needed: Because SURE does not contain an SfM component, internal as well as exter-nal camera orientation parameters for all used images need to be provided by a different program. For this purpose, camera posi-tions and undistorted images were exported from Photoscan using the InPhoto format .prj. Then, for each image pair, with the pa-rameter for the minimum intersection angle between the cameras ”minangle” set to ”1” to ensure that most of the field would be covered by the resulting point cloud. With the default intersec-tion angle of 4 degree, large parts of the test field further from the cameras would not be covered by the generated dense point cloud. By using the camera orientation generated by PhotoScan, the resulting point clouds were correctly georeferenced.
For the VisualSfM and CMVS/PMVS2 workflow, first the im-age pairs were added in the VisualSfM GUI and then the ”match images” function was used to detect feature points. Then, the ”sparse reconstruction” function was used to create a sparse point cloud. In this step, VisualSfM runs a multicore bundle adjust-ment and the external camera parameters are reconstructed.. Fi-nally, for the dense point cloud reconstruction, CMVS/PMVS2 was run. As with SURE, the minimum intersection angle was set to 1 degree to ensure coverage of the whole field. To georeference the generated point cloud, several approaches were used: One integrated directly into VisualSfM and two external solutions. The integrated solution applies a transformation to the generated dense point cloud based on the X/Y coordinates of the GCPs in the input images. Because this this method did not produce sat-isfactory results, two other approaches external to the VisualSfM software were also used: The SfM-Georef software (James and Robson, 2012) works similar to the internal method: GCPs are defined, their coordinates entered and then marked on the input images used to create the point clouds. Then, using camera mod-els and orientations defined by the VisualSfM output, the GCPs’ 3D coordinates in the SfM coordinate system can be calculated and used to transform the point cloud to the coordinate system of the GCPs. The third approach uses the v.ply.rectify GRASS GIS add-on (Metz, 2012). This necessitated the manual detection of the GCPs in the dense point clouds generated by CMVS/PMVS2. Using their coordinates, a 3D orthogonal rectification of the point cloud is performed.
generated raster datasets. Zonal statistics including mean, min-imum and maxmin-imum elevation were then calculated for the ob-served plots. To eliminate border effects in this step, the actual plot borders were buffered by 0.3 m.
4. RESULTS
According to a visual inspection of the generated dense point clouds, Photoscan achieved the best results. Usable point clouds were generated for all sampling dates. For some of the dates, (May 23 morning, June 5 noon and evening), parts of the field were not covered. The generated point clouds contained no noise or other artifacts.
(a) Photoscan
(b) SURE
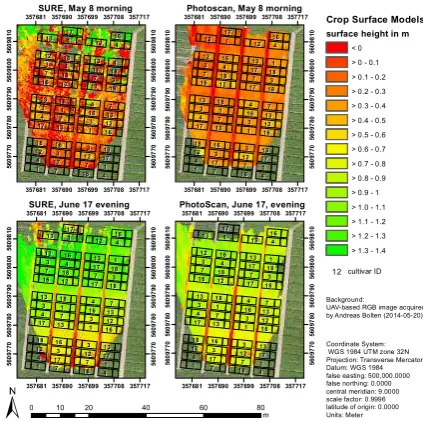
Figure 2. Top-down view of point clouds for the morning of May 08
SURE did not perform as good as Photoscan. For one acquisition date, no point cloud was generated at all, and for two other dates, there were large parts of the field where the point cloud obviously does not represent the crop surface correctly. Compared to the point clouds generated by Photoscan, the point clouds contained noise not seen in the Photoscan point clouds, especially along the borders of the point cloud and at distances of more than 40 m
(a) Horizontal view perpendicular to the footpaths
(b) Horizontal view along the direction of the footpaths
Figure 3. Two views of the whole point cloud for the morning of June 4 generated by SURE
3 Projection: Transverse Mercator Datum: WGS 1984 false easting: 500,000.0000 false northing: 0.0000 central meridian: 9.0000 scale factor: 0.9996 latitude of origin: 0.0000 Units: Meter Background: UAV-based RGB image acquired by Andreas Bolten (2014-05-20)
cultivar ID
Crop Surface Models
surface height in m
< 0
SURE, June 17 evening
SURE, May 8 morning Photoscan, May 8 morning
PhotoScan, June 17, evening
Figure 4. SURE and PhotoScan CSMs for two acquisition dates
to the cameras. Figure 3 shows one such point cloud from two points of view, illustrating the noise.
In Figure 4, the CSMs for the evening acquisition time of May 8 and June 17 generated by both SURE and PhotoScan are shown. The May 8 CSM clearly shows the effect the noise in the point cloud has on the generated CSM. In contrast, the June 17 CSMs show that SURE is also capable of satisfactory results with regard to noise and point density in the point cloud.
Figure 5. Top-down view of point cloud for the morning of May 08 generated by VisualSFM and CMVS/PMVS2
Table 1. Descriptive statistics of plot-wise mean heights of man-ual measurements and generated CSMs for plots with point den-sity greater than 100/m2
min (m)
max (m)
mean (m)
range (m)
std. [m]
Manual May 8 0.27 0.52 0.37 0.26 0.05
SURE May 8 -0.21 0.51 0.31 0.72 0.14
PhotoScan May 8 0.15 0.42 0.31 0.27 0.06
Manual May 23 0.51 0.63 0.58 0.12 0.03
SURE May 23 0.39 0.88 0.54 0.49 0.1
PhotoScan May 23 0.54 0.8 0.64 0.26 0.05
Manual June 5 0.68 0.83 0.76 0.14 0.03
SURE June 5 0.35 1.63 0.78 1.28 0.27
PhotoScan June 5 0.56 0.85 0.74 0.29 0.07 Manual June 17 0.68 0.83 0.76 0.14 0.03
SURE June 17 -0.2 1.31 0.93 1.5 0.32
PhotoScan June 17 0.71 0.97 0.86 0.26 0.07
do not contain considerable amounts of noise and are in that re-gard comparable to those produced by PhotoScan. A statistical analysis comparing the plot-wise heights with those generated by PhotoScan and SURE was not possible because of the aforemen-tioned incorrect geometry.
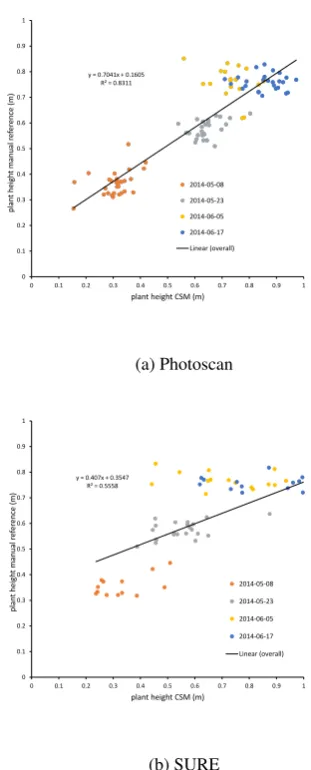
Because SURE generated usable dense point clouds for all dates only with the evening acquisition and we want to compare fairly with PhotoScan, we performed the statistical analysis for the CSMs generated for that acquisition time. Figure 6 shows the linear re-gressions of mean CSM-derived plant height and manually mea-sured plant height for the evening acquisition time for both SURE and Photoscan. For this regression, all plots with a mean point density higher than 100 perm2were considered. It can be clearly
seen that Photoscan performs better in deriving the plant heights with anr2 value of 0.83 compared to 0.56 for SURE. The root
mean square error (RMSE) for Photoscan equals 0.10 m, while the RMSE for SURE equals 0.21 m, again showing that Photo-Scan performed better. Table 1 shows descriptive statistics for the CSMs generated by SURE and PhotoScanfor the evening image acquisition date: The range and standard deviation of the plot-wise heights is much larger for the CSMs generated by SURE, while the values for the PhotoScan CSMs are much closer to those of the manual plant height measurements. This again shows that the results generated by PhotoScan are superior to those of SURE.
y = 0.7041x + 0.1605 R² = 0.8311
0 0.1 0.2 0.3 0.4 0.5 0.6 0.7 0.8 0.9 1
0 0.1 0.2 0.3 0.4 0.5 0.6 0.7 0.8 0.9 1
p
lan
t
h
e
ig
h
t
m
an
u
al
r
e
fe
re
n
ce
(
m
)
plant height CSM (m)
2014-05-08
2014-05-23
2014-06-05
2014-06-17
Linear (overall)
(a) Photoscan
y = 0.407x + 0.3547 R² = 0.5558
0 0.1 0.2 0.3 0.4 0.5 0.6 0.7 0.8 0.9 1
0 0.1 0.2 0.3 0.4 0.5 0.6 0.7 0.8 0.9 1
p
lan
t
h
e
ig
h
t
m
an
u
al
r
e
fe
re
n
ce
(
m
)
plant height CSM (m)
2014-05-08
2014-05-23
2014-06-05
2014-06-17
Linear (overall)
(b) SURE
Figure 6. Regressions of mean CSM-derived plant height and manually measured plant height, evening acquisition time
5. DISCUSSION AND CONCLUSION
This study aimed to evaluate several dense 3D reconstruction software packages for their suitability for crop canopy surface monitoring from an oblique angle using stereo imagery. Of the three tested software packages PhotoScan, SURE and VisualSfM with PMVS/CMVS2, PhotoScan provided the best results and is most suited for further investigation, despite its status as a com-mercial software package without access to the source code and the lack of knowledge regarding which algorithms are exactly used to process the data. The fact that PhotoScan clearly formed better than SURE is in contrast to the evaluation per-formed by Remondino et al. (2014) and most likely explained by the fact that in this study, only one stereo pair acquired at an oblique angle was used reconstruct the 3D scene geometry. This is a corner case not reflected by the test datasets used in that study.
While PhotoScan and SURE provided usable results, VisualSfM in combination with PMVS/CMVS2 did not. The distortion of the true geometry of the field in the results provided by Visu-alSfM with PMVS/ CMVS2 could be caused by the image align-ment algorithm used in VisualSfM not being able to deal correctly with this corner case. Another possibility is that the camera self-calibration implemented in PhotoScan performs better than the one from VisualSfM. Regarding noise and point density, the re-sults of PMVS/CMVS2 look promising, but further analysis in the context of this study was impossible due to the incorrect ge-ometry of the generated point cloud.
In summary, this study shows that from the tested software pack-ages, PhotoScan is best suited for crop height monitoring from oblique angles when using a single stereo image pair.
References
Bendig, J., Bolten, A. and Bareth, G., 2013. UAV-based Imaging for Multi-Temporal, very high Resolution Crop Surface Models to monitor Crop Growth Variability. Photogrammetrie -Fernerkundung - Geoinformation 2013(6), pp. 551–562.
Brocks, S. and Bareth, G., 2014. Evaluating the poten-tial of consumer-grade smart cameras for low-cost stereo-photogrammetric Crop-Surface Monitoring. ISPRS - Interna-tional Archives of the Photogrammetry, Remote Sensing and Spatial Information Sciences XL-7(October), pp. 43–49.
Brutto, M. L. and Meli, P., 2012. Computer Vision Tools for 3D Modelling in Archaeology. International Journal of Heritage in the Digital Era 1(0), pp. 1–6.
Dall’Asta, E. and Roncella, R., 2014. A comparison of semiglobal and local dense matching algorithms for surface reconstruction. ISPRS - International Archives of the Pho-togrammetry, Remote Sensing and Spatial Information Sci-ences XL-5(June), pp. 187–194.
Eltner, A. and Schneider, D., 2015. Analysis of Different Meth-ods for 3D Reconstruction of Natural Surfaces from Parallel-Axes UAV Images. The Photogrammetric Record 30(151), pp. 279–299.
Furukawa, Y. and Ponce, J., 2010. Accurate, Dense, and Robust Multiview Stereopsis. IEEE Transactions on Pattern Analysis and Machine Intelligence 32(8), pp. 1362–1376.
Furukawa, Y., Curless, B., Seitz, S. M. and Szeliski, R., 2010. Towards Internet-scale multi-view stereo. In: 2010 IEEE Computer Society Conference on Computer Vision and Pat-tern Recognition, IEEE, pp. 1434–1441.
Grenzd¨orffer, G. J., 2014. Crop height determination with UAS point clouds. ISPRS - International Archives of the Pho-togrammetry, Remote Sensing and Spatial Information Sci-ences XL-1(1), pp. 135–140.
Hoffmeister, D., Bolten, A., Curdt, C., Waldhoff, G. and Bareth, G., 2010. High resolution Crop Surface Models (CSM) and Crop Volume Models (CVM) on field level by terrestrial laser scanning. SPIE Proceedings 7840, pp. 78400E–78400E–6.
James, M. R. and Robson, S., 2012. Straightforward reconstruc-tion of 3D surfaces and topography with a camera: Accuracy and geoscience application. Journal of Geophysical Research 117(F3), pp. F03017.
Lowe, D. G., 1999. Object recognition from local scale-invariant features. Proceedings of the Seventh IEEE International Con-ference on Computer Vision pp. 1150–1157 vol.2.
Lowe, D. G., 2004. Distinctive Image Features from Scale-Invariant Keypoints. International Journal of Computer Vision 60(2), pp. 91–110.
Metz, M., 2012. v.ply.rectify - Imports PLY points, georeferences and exports them. https://grass.osgeo.org/grass70/ manuals/addons/v.ply.rectify.html.
Remondino, F., Spera, M. G., Nocerino, E., Menna, F. and Nex, F., 2014. State of the art in high density image matching. The Photogrammetric Record 29(146), pp. 144–166.
Rothermel, M. and Wenzel, K., 2012. SURE - Photogrammet-ric Surface Reconstruction from Imagery. Proceedings LC3D Workshop pp. 1–21.
Seitz, S., Curless, B., Diebel, J., Scharstein, D. and Szeliski, R., 2006. A Comparison and Evaluation of Multi-View Stereo Reconstruction Algorithms. In: 2006 IEEE Computer Society Conference on Computer Vision and Pattern Recognition -Volume 1 (CVPR’06), Vol. 1, IEEE, pp. 519–528.
Semyonov, D., 2011. Algorithms used in Photoscan.
http://www.agisoft.com/forum/index.php?topic= 89.msg323#msg323.
Tilly, N., Hoffmeister, D., Cao, Q., Huang, S., Lenz-Wiedemann, V., Miao, Y. and Bareth, G., 2014. Multitemporal crop surface models: accurate plant height measurement and biomass esti-mation with terrestrial laser scanning in paddy rice. Journal of Applied Remote Sensing 8(1), pp. 083671.
Tilly, N., Hoffmeister, D., Cao, Q., Lenz-Wiedemann, V., Miao, Y. and Bareth, G., 2013. Precise plant height monitoring and biomass estimation with Terrestrial Laser Scanning in paddy rice. ISPRS Annals of Photogrammetry, Remote Sensing and Spatial Information Sciences II-5/W2(November), pp. 295– 300.
Triggs, B., Mclauchlan, P. F., Hartley, R. I. and Fitzgibbon, A. W., 2000. Bundle Adjustment — A Modern Synthesis. In: B. Triggs, A. Zisserman and R. Szeliski (eds), Vision Algo-rithms: Theory and Practice, Lecture Notes in Computer Sci-ence, Vol. 1883, Springer Berlin Heidelberg, Berlin, Heidel-berg, pp. 298–372.
Ullman, S., 1979. The Interpretation of Structure from Motion. Proceedings of the Royal Society of London, B. 203(1153), pp. 405–426.
Wu, C., 2007. SiftGPU: A GPU implementation of Scale Invari-ant Feature Transform (SIFT).http://cs.unc.edu/~ccwu/
siftgpu/.
Wu, C., 2013. Towards Linear-Time Incremental Structure from Motion. In: 2013 International Conference on 3D Vision, IEEE, pp. 127–134.