THE LAND SURFACE TEMPERATURE IMPACT TO LAND COVER TYPES
I. Ibrahim a *, A. Abu Samah b, R. Fauzi b, N. M. Noor a
a Department of Urban and Regional Planning, Kuliyyah of Architecture and Environmental Design, International Islamic University Malaysia, Malaysia - [email protected], [email protected]
b Department of Geography, Faculty Arts and Social Sciences, University of Malaya, Malaysia – [email protected], [email protected]
ICWG III/VII
KEY WORDS: Land surface temperature, Land cover, Remote Sensing, Geographical Information System
ABSTRACT:
Land cover type is an important signature that is usually used to understand the interaction between the ground surfaces with the local temperature. Various land cover types such as high density built up areas, vegetation, bare land and water bodies are areas where heat signature are measured using remote sensing image. The aim of this study is to analyse the impact of land surface temperature on land cover types. The objectives are 1) to analyse the mean temperature for each land cover types and 2) to analyse the relationship of temperature variation within land cover types: built up area, green area, forest, water bodies and bare land. The method used in this research was supervised classification for land cover map and mono window algorithm for land surface temperature (LST) extraction. The statistical analysis of post hoc Tukey test was used on an image captured on five available images. A pixel-based change detection was applied to the temperature and land cover images. The result of post hoc Tukey test for the images showed that these land cover types: built up-green, built up-forest, built up-water bodies have caused significant difference in the temperature variation. However, built up-bare land did not show significant impact at p<0.05. These findings show that green areas appears to have a lower temperature difference, which is between 2° to 3° Celsius compared to urban areas. The findings also show that the average temperature and the built up percentage has a moderate correlation with R2 = 0.53. The environmental implications of these interactions can provide some insights for future land use planning in the region.
1. INTRODUCTION
It is essential to incorporate remote sensed data in the study of urban climate to obtain synoptic view required to understand the interaction between natural processes and human modification of those processes (Stefanov & Brazel, 2007). The specialty of remote sensing data is its richness of multi temporal spatial information where it yields particular insights towards particular environmental issues. The alteration of the land surface environment by activities such as construction and landscaping has lead to negative consequences to the energy balance in the affected areas.
The canyon geometry, air pollution, buildings and construction materials were hypothesised by Oke (1982) as the causes of UHI due to urbanisation and energy balance changes. This opinion was supported by Stathoupoulou and Cartalis (2007) who further highlighted that different construction materials reduce turbulent heat transfer and long wave radiative heat loss due to street canyon geometry. In addition, they also reduce latent heat loss by evaporation due to the replacement of natural green surfaces with dry surfaces and hence increase anthropogenic heat emissions into the urban atmosphere. UHI varies in line with the urban features, including surface roughness, shape and height of buildings, mean orientation of street canyon, view factors, topographic factors etc. as well as meteorological conditions (Landsberg, 1981; Oke, 1987). Some studies demonstrated that the UHI effect is always related to population (Oke, 1973) and the size of the urban area (Goggins, 2009; Oke, 1973). It has also
been claimed that the sky view factor also affects UHI intensity (Eliasson, 1990; Giridharan, Ganesan, & Lau, 2004; Yamashita, Sekine, Shoda, Yamashita, & Hara, 1986; Yang, Lau, & Qian, 2010). Heat island developments are also due to the construction materials of high heat capacity and low solar reflectivity (Voogt & Oke, 2003). It is important to mitigate anthropogenic heat emission as one of the pillars of UHI countermeasures as recognised by the Inter-Ministry Coordination Committee (2004).
With the increase of urbanisation, the excess heat from buildings, transportation, industrial and residential areas is trapped and the heat accelerates to higher temperatures in the urbanised areas. In the urban areas, natural land cover of vegetation has been replaced by concrete and asphalt. Saito, Ishihara and Katayama (2000) pointed out that the reduced density of vegetation in the urban environment has worsened the UHI problem. Due to this fact, the anthropogenic activities have changed the energy balance of the environment, whereby these urbanisation activities are able to increase sensible heat instead of latent heat, making the environment hotter. These physical activities are in contrast to activities in the rural areas, whereby the heat from solar radiation is absorbed by the vegetation and ponds by which evapotranspiration results to give a cooling effect in such areas which can help to control the temperature, keeping it lower in the rural areas.
Many studies were done on the object-based approach in order to understand the behaviour of temperatures and land cover (He, Liu The International Archives of the Photogrammetry, Remote Sensing and Spatial Information Sciences, Volume XLI-B3, 2016
et al., 2007; Binyan, Wenjie et al., 2008; Garcia-Cueto & Martinez; 2009). The data collection used by these researches were in situ measurement and remote sensing imageries. Analysis that were done included the correlation of coefficient between land covers and temperatures (Rajasekar & Weng, 2009; Wen, Hu, & Yang; 2008; Xian & Crane, 2006; Xiao et al., 2008; Chen et al.; 2006). Several studies concerning the temperatures of the major roads, observed to be the warmest in the city due to the impervious nature of roads, reduces any likelihood of cooling through evapotranspiration (Weng, 2001, Xiao et al., 2008, Hart & Sailor, 2009). Liu et al. (n.y) observed that the lowest evapotranspiration occurs in developed urban areas and the highest in open water bodies. Nonomura, Kitahara and Masuda (2009) found that one of the causative factors is the expansion of non-vegetated area even without population growth.
Another type of analysis is by analysing point pattern datasets or it can also be called as pixel-based change detection. Point data for remote sensing studies is important to demonstrate the pattern of such scenario to validate ground reading and spectral reflectance measurements for water content of agriculture fields (Jackson et al., 2004). Mainly, this type of change detection uses several statistical analysis in order to overcome the regression for prediction or comparison between images. One example is a post-hoc analysis, which is used to compare mean difference between groups. Several remote sensing studies have used this method (Giraldo, et al., 2009; Jalili, 2013; Baloye & Palamuleni, 2015). Meanwhile, some other studies used summary statistics such as descriptive, means and variances or more complex summaries of seasonality and environmental variability in order to gather and understand particular subjects (Cringoli et al., 2004).
In the local context, the earliest studies in this area was done by Sani (1986; 1990; Sani, 1976). Other researchers had also investigated the growth impact of surface temperature and Urban Heat Island (UHI) (Shaharuddin Ahmad & Noorazuan Md Hashim 2007, Asmala Ahmad & Noorazuan Hashim n.y.). In other studies, in situ measurement was applied by Kubota and Ossen (n.y.) and Siti Zakiah Mohammed (2004), climatology study by Wai, Camerlengo et al. (2005) and satellite imageries by Takeuchi and Noorazuan Hashim et al. (2010). In this research, the land cover mapping of 30 x 30 meter that matched the pixel size of a land surface temperature of 60 x 60 pixels size of five satellite images were applied. This study was aimed at exploring remote sensing data product for each pixel to produce predictions of how the temperature interacts with land cover types in the local setting. The objectives are: 1) to analyse the mean temperature for each land cover types and 2) to analyse the relationship of temperature variation within land cover types: urban area, green area, forest, water bodies and bare land.
2. METHODOLOGY
2.1 Study Area
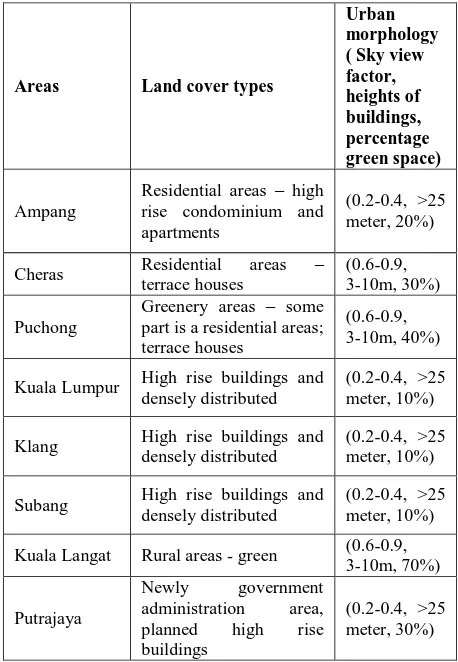
Eight random samples within Klang Valley area were selected in this study. The areas were selected due to the non-cloudy features at these particular areas. It was also selected by ensuring that the variability in these areas are different in terms of their urban morphology and land use types. This analysis were based on the eight spatial subsets of the Klang Valley area (Figure 1). The areas selected were Ampang, Cheras, Puchong, Kuala Lumpur, Klang, Subang, Kuala Langat and Putrajaya, as seen in the map in red polygon. Dataset used were those captured in the image taken on the 7th Feb 1989 image,12th Dec 1999 image, 31st May 2001 image and 2nd Mar 2006 image with land cover classifications of built up (purple), green (green), forest (dark
green), water bodies (blue) and bare land (grey). These sub regions were chosen based on spatial difference between land use types. Each of the sub-region covered a 400 x 400 metres of land cover.
Figure 1. The randomly sampled areas
Table 1 shows those selected areas along with their land use types and urban morphology. A spatial analysis was performed to finalise the location of the areas by delineating a polygon on top of the proposed samples. Each polygon was reviewed to ensure that every land cover type was included. It was also crucial to ensure that the delineated polygon areas were cloud free. Each of the pixel will be converted to points to demonstrate the comparison of difference between land cover types.
Table 1. Covered areas along with land cover types and urban morphology
Areas Land cover types
Urban rise condominium and apartments
(0.2-0.4, >25 meter, 20%)
Cheras Residential areas – terrace houses
(0.6-0.9, 3-10m, 30%)
Puchong
Greenery areas – some part is a residential areas; terrace houses The International Archives of the Photogrammetry, Remote Sensing and Spatial Information Sciences, Volume XLI-B3, 2016
2.2 LST
Further steps of the analysis was the calculation of land surface temperature by computing: (1) transmittance equation, (2) correction of the spectral emissivity, (3) mean atmospheric temperature and (4) land surface temperature by using the method developed by Qin and Karnieli (2001). The steps of calculation were discussed in a previous paper (Ibrahim, 2012).
2.3 Land Cover
The land cover map was produced by using the Supervised Classification by the iteration of clustering algorithm. Series of classes were produced to determine the signature of each class so each of the pixels can be compared to these signatures and labelled to most similar values digitally. The calculation will help to identify which cell location is attached to which clusters. The images were categorised into six classes including: (1) Built up areas, (2) Green land, (3) Forest land, (4) Water bodies, (5) Bare land. Originally, the supervised classification was used to classify to fifty clusters, according to the analyst experience in the study area.
The calibration of the land cover and land surface temperature is carried out to ensure that the appropriate accuracy is achieved. Accuracy assessment was critical for a land cover classification to ensure the accurateness of the classification. Overall accuracy and the Kappa statistics were derived from error matrices. Accuracy assessment was carried out for these images and the overall accuracy and overall Kappa coefficient as gathered was: 93.33%, 0.9204 (7th Feb 1989 image), 96.4%, 0.9580 (12th Dec 1999 image), 95.4%, 0.8299 (31st May 2001 image), 95%, 0.82 (2nd Mar 2006 image) and 97% (21st Jan 2009) respectively. This analysis shows that good accuracy of classification was achieved for the land cover classification. The land cover types were divided into five (5) categories of classification: built up areas, green areas, forest areas, water bodies and bare land. To add, greenery areas can also be recognised as agriculture area; including palm oil and paddy fields.
3. RESULT AND DISCUSSIONS
Descriptive statistical analysis mainly mean temperatures were used to summarise the data, while inferential statistics was used in the form of a one way analysis of variance (ANOVA) to evaluate the effect of land cover types on temperature. The fixed factor for the ANOVA was land cover with five categories: built up, green, forest, water bodies and bare land, while the dependent variable was temperature. The assumption of homogeneity of variance was performed using Levene’s Test, while Tukey HSD was used for the pair-wise post hoc test. Firstly, the statistical significance of land cover groups needed to be identified using the ANOVA table formulation for each dataset.
A report for the descriptive analysis was done where pixel for each image was calculated as indicated in Table 2. It shows that the 2006 image has a higher mean temperature for all land cover types compared to the other images. However, the variation of temperature sets were just about the same. Built up and bare land recorded almost the same mean temperatures and the highest temperature was observed in all the images. A consistent result was found in A-Du, Yun-Hao et al. (2006), Du, Wang et al. (2009) studies where it was observed that the high temperatures were due to commercial and industrial factories. The higher temperature of bare land was also due to the fact that most part of the bare land was comprised of areas where ongoing development was taking place and they had no vegetation cover.
Table 2. Mean temperatures for each images
Forest and water bodies recorded very similar mean temperatures, while the green sector had slightly higher mean temperatures than forest.
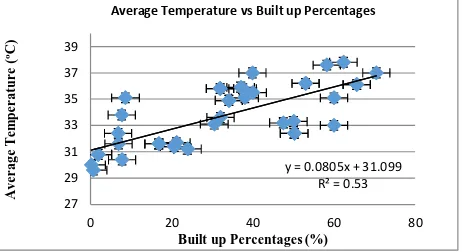
Figure 2. The correlation coefficient of the average temperature and the built up percentages
The increase of temperatures in built up area was driven by several factors such as human activities. In order to understand the linkage of the average temperature and built up percentage, a correlation coefficient analysis was undertaken on each sample area. This analysis was conducted by calculating each of the built up area in percentage according to the data of sample areas. The results form the analysis clearly revealed that the average temperature and the built up percentage has a moderate correlation of R2 = 0.53 (Fig. 2). This analysis has also indicated a positive relationship, whereby the higher the built up percentages, the higher was the average temperature. The result also showed that the average temperature influenced moderate reading, at 0.5304, while the rest (0.47) was due to by many factors that did not entirely correspond to urbanisation. The result also indicated that an increase of 5% in built up areas can increase temperatures to up to 0.4° Celsius.
To achieve second objective, the differences of the built up area with the other land cover types; green area, forest, water bodies and bare land was analysed. The difference between groups was represented in the ANOVA by mean square value between groups, while the variation within each group was represented by mean square value within the group category. There was a significant effect of temperature variation at the p value < .001 level for these particular variables: subjects in the built up area, green, forest and water bodies for all the images. However, all images showed that subjects in bare land was not significant due to p>.05. It is therefore assumed that the homogeneity of variance was met and only Tukey HSD information was presented in the analysis.
The output of post hoc test (Table 3) revealed the temperature variation with multiple comparisons among different pairs of land cover on mean temperature variation with the Tukey post
Average Temperature vs Built up Percentages
hoc test. The Tukey test showed that the water bodies were more significantly impacted by temperature compared to other pairings. These difference approached statistical significance (p=.000). It can be concluded hence that the differences between condition means of groups were not likely due to chance and it can be due to the independent variable.
Table 3. The post hoc test for the available images
Generally, 21st Jan 2009 images has the lowest difference among the land cover types, while 7th Feb 1989 showed the highest difference compared to other images. The difference of urban and other land cover types was calculated; which indicated that built up and water (4.4° Celsius) had the highest difference of mean temperature compared to the other land cover types, whereas built up and green showed the lowest temperature difference (2.5° Celsius).
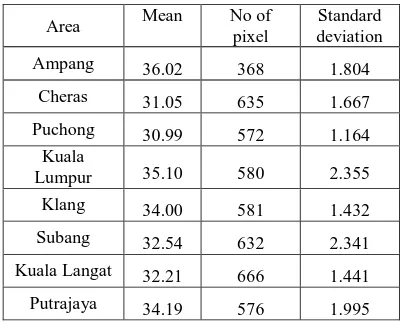
Further analysis show the mean of temperatures for the 2006 image (Table 4). This analysis used this image as it is a better image compared to the others due to the no clouds and good weather with a no amount of rainfall and relatively weak wind by referring to dataset provided by Meteorology Station.
Table 4. The mean temperatures for each sampled areas
This analysis show that Ampang and Kuala Lumpur has the highest mean temperature among others. These areas has a different urban morphology, Ampang is surrounded with a high rise and apartments of the residential areas, while a city centre of Kuala Lumpur is a high rise buildings and densely distributed. The percentage of green are also lower (10 to 20%). The average temperature of Kuala Langat is 31.05 ºC and this area is considered as a rural area as it is still has highly green percentage at 70%, which helps to moderate the temperature. The average temperature of Puchong (30.99 ºC) are almost the same as Kuala Langat as even though it was located in the urban areas but green percentage is 40%. The development of this area is started with
mines and by the time goes by, it was converted to residential area and extensive development of housing was occurred in recent years. However, the temperature in Puchong is moderate may be due to the sample area is located near to the forest area, namely as Ayer Hitam Forest Reserve.
It was identified that Cheras (33.63 ºC), Klang (34 ºC) and Subang (34.19 ºC) is having a small differences of mean temperature. However, Cheras is the old residential areas which contain terrace houses with 30 % of green. This is much different compared to land use types of Klang and Subang which is surrounded with high rise buildings and densely distributed. Putrajaya is an ad-hoc project for a newly government administration area is having a considerable mean temperature at 32.21 ºC. It might be due to the existing greenery and waterbodies surrounded by the tall buildings.
4. CONCLUSIONS
The result of one-way ANOVA indicated significant differences in temperature between built up, green, forest and water-body areas. The post hoc test results also showed that the difference between built up and green are the smallest, whereas the largest gap was found between built up and water bodies. In other words, the study’s results revealed a difference of temperature between built up and water bodies (4.4° Celsius) and between built up and green (2.5° Celsius). These findings indicate that water does help to mitigate temperature. It also show that the green area appears to have a lower temperature which was between 2° to 3° Celsius compared to the urban area. A great change in the thermal contrasts had occurred between the different materials on the ground, both terrain and vegetation. This result indicate that there is a need to conduct a further mitigation on urban planning using these land cover types. One possible mitigation is through the maintenance of connectivity using green corridors. The possibilities of restriction of land use conversion in any particular green area can also be adopted in the study area. Another possible mitigation is by adopting water bodies as a mechanism to moderate the temperature in the urban area. Hence, it is important that water bodies are preserved to not only benefit the communities that live in the city, but with the availability of water bodies, parks and trees can be planted as recreational areas which can also help to reduce the surrounding temperature.
ACKNOWLEDGEMENTS
This research was funded by the Research Initiative Grant Scheme (RIGS) grant no RIGS 15-025-0025 from the International Islamic University of Malaysia (IIUM). The authors express their gratitude for the support received under the research grant. The authors are also deeply grateful to the United States Geological Survey (USGS) for providing the satellite images.
REFERENCES
A-Du, G., Yun-Hao, C., Jing, L., Hui-Li, G., & Xiao-Juan, L. (2006). Spatial Distribution Patterns of the Urban Heat Island Based on Remote Sensing Images: a Case Study in Beijing, China. Geoscience and Remote Sensing Symposium, IGARSS 2006.
Asmala Ahmad, & Noorazuan Hashim. (n.y.). A remote sensing-GIS evaluation of urban growth-land surface temperature relationships in Selangor, Malaysia. GIS Development. Image date Built up
-green
Built up – forest
Built up-water 7th Feb 1989 3.1970212 3.7155477 5.6639775 12th Dec 1999 2.6922965 3.7308335 4.3715081 31st May
2001
3.8512781
5.0642039 5.0574798
2nd Mar 2006 3.1724010 3.8549802 5.6817823 21st Jan 2009 1.0820321 2.5495631 2.7190316 Mean 2.47695288 3.5467716 4.36826056
Area Mean No of
pixel
Standard deviation
Ampang 36.02 368 1.804
Cheras 31.05 635 1.667
Puchong 30.99 572 1.164
Kuala
Lumpur 35.10 580 2.355
Klang 34.00 581 1.432
Subang 32.54 632 2.341
Kuala Langat 32.21 666 1.441
Putrajaya 34.19 576 1.995
Baloye, D. O. and Palamuleni, L. G. (2015). A Comparative Land Use-Based Analysis of Noise Pollution Levels in Selected Urban Centers of Nigeria, Int. J. Environ. Res. Public Health 2015, 12, 12225-12246.
Binyan, Y., Wenjie, F., TaoXin, & XuXiru. (2008). Study on urban heat island of Beijing using ASTER data: A quantitative remote sensing perspective. IEEE International Geoscience & Remote Sensing Symposium.
Chen, X. L., Zhao, H. M., Li, P. X., & Yin, Z. Y. (2006). Remote sensing image-based analysis of the relationship between urban heat island and land use/cover changes. [doi: DOI: 10.1016/j.rse.2005.11.016]. Remote Sensing of Environment, 104(2), 133-146.
Cringoli, G. Taddeib, G., Rinaldia, L., Venezianoa, V., Musellaa, V. Casconea, C., Sibiliob, G., Malonec, J. B. (2004). Use of remote sensing and geographical information systems to identify environmental features that influence the distribution of paramphistomosis in sheep from the southern Italian Apennines Veterinary Parasitology, 122, 15–2.
Du, M., Wang, Q., & Cai, G. (2009). Temporal and spatial variations of Urban Heat Island effect in Beijing using ASTER and TM data. Urban Remote Sensing Joint Event.
Eliasson, I. (1990). Urban Geometry, surface temperature and air temperature. [doi: DOI: 10.1016/0378-7788(90)90125-3]. Energy and Buildings, 15(1-2), 141-145.
Garcia-Cueto, O. R., & Martinez, A. T. (2009). Urbanization effects upon the air temperature in Mexicali, B. C., México. Atmósfera, 22(4), 349-365.
Giraldo, M. A., Bosch, D., Madden, M., Usery, L., & Finn, M. (2009). Ground and surface temperature variability for remote sensing of soil moisture in heterogeneous landscape. Journal of Hidrology, 368, 214-223.
Giridharan, R., Ganesan, S., & Lau, S. S. Y. (2004). Daytime urban heat island effect in high-rise and high-density residential developments in Hong Kong. [doi: DOI: 10.1016/j.enbuild.2003.12.016]. Energy and Buildings, 36(6), 525-534.
Goggins, G. (2009). Impacts of city size and vegetation coverage on the urban heat island using Landsat satellite imagery. M.S. 1462620, Mississippi State University, United States -- Mississippi.
Hart, M. A., & Sailor, D. J. (2009). Quantifying the influence of land-use and surface characteristics on spatial variability in the urban heat island. Theor. Appl. Climatol., 95, 397-406.
He, J. F., Liu, J. Y., Zhuang, D. F., Zhang, W., & Liu, M. L. (2007). Assessing the effect of land use land cover change on the change of urban heat island intensity. Theor. Appl. Climatol., 90 (217-226).
Ibrahim, I., Abu Samah, A., Fauzi, R. (2012). Land surface temperature and biophysical factors in urban planning. Presented in the 27-28th Aug 2012 in ICEESD 2012: International Conference on Ecosystem, Environment and Sustainable Development, Kuala Lumpur, Malaysia. World Academy of Science, Engineering and Technology 68, 2012, pp. 1792-1797.
Inter-Ministry Coordination Committee. (2004). The policy framework to reduce urban heat island effects.
Jackson, T. J., Chen, D., Cosh, M., Li, F., Anderson, M., Walthall, C., Doriaswamy, P., Hunt, E.R., 2004. Vegetation water content mapping using Landsat data derived normalized difference water index for corn and soybeans. Remote Sensing of Environment 92 (4), 475–482.
Jalili, S. Y. (2013). The effect of land use on land surface temperature in the Netherlands. M.Sc, Lunds Universitet, Netherlands.
Kubota, T., & Ossen, D. R. (2009). Spatial characteristics of urban heat island in Johor Bahru City, Malaysia. Proceedings of the 3rd Symposium of South East Asian Technical University Consortium (SEATUC), University Technology Malaysia (UTM), Johor, Malaysia.
Landsberg, H. (1981). The Urban Heat Island. In Landsberg, H.(Ed.), International Geophysics (Vol. Volume 28, pp. 83-126): Academic Press.
Liu, W., Hong, Y., Khan, S. I., Huang, M., Vieux, B., Caliskan, S., & Grout, T. (n.y). Actual evapotranspiration estimation from remotely sensed data for different land cover types and urban development level.
Nonomura, A., Kitahara, M., & Masuda, T. (2009). Impact of land use and land cover changes on the ambient temperature in a middle scale city, Takamatsu, in Southwest Japan. Journal of Environmental Management, 90, 3297-3304.
Oke, T. R. (1973). City size and the urban heat island. [doi: DOI: 10.1016/0004-6981(73)90140-6]. Atmospheric Environment (1967), 7(8), 769-779.
Oke, T. R. (1982). The energetic basis of the urban heat island. Quarterly Journal of the Royal Meteorological Society, 108(455), 1-24.
Oke, T. R. (1987). Boundary layer climate: London - New York: Routledge.
Qin, Z., & Karnieli, A. (2001). A mono-window algorithm for retrieving land surface temperature from Landsat TM data and its application to the Israel-Egypt border region. International Journal of Remote Sensing(18), 3719-3746.
Rajasekar, U., & Weng, Q. (2009). Urban heat island monitoring and analysis using a non-parametric model: A case study of Indianapolis. [doi: DOI: 10.1016/j.isprsjprs.2008.05.002]. ISPRS Journal of Photogrammetry and Remote Sensing, 64(1), 86-96.
Saito, I., Ishihara, O., & Katayama, T. (2000). Study of effect of green areas on the thermal environment in an urban area. Journal of Energy and Buildings, 15, 443-446.
Sani, S. (1976). Current state of the environment within and around Kuala Lumpur-Petaling Jaya: a review. Akademika, 37-48.
Sani, S. (1986). The effects of urbanization on climate in Kuala Lumpur and the Klang Valley. In M. B. Sevcenko (Ed.), In Design for High-Intensity Development (pp. 66-74). Massachusetts.
Sani, S. (1990). Urban Climatology in Malaysia: An Overview. Energy and Buildings, 15, 105-117.
Shaharuddin Ahmad, & Noorazuan Md Hashim. (2007). Effects of Soil Moisture on Urban Heat Island Occurrences: Case of Selangor, Malaysia. Humanity & Social Sciences Journal, 2(2), 132-138.
Siti Zakiah Mohammed. (2004). The influence of urban heat towards pedestrian comfort and the potential use of plants and water as heat ameliorator in Kuala Lumpur City Centre area. M.Sc, Universiti Putra Malaysia.
Stathopoulou, M., & Cartalis, C. (2007). Study of the urban heat island of Athens, Greece during daytime and night-time. Urban Remote Sensing Joint Event.
Stefanov, W. L., & Brazel, A. J. (2007). Challenges in Characterizing and Mitigating Urban Heat Islands — A Role for Integrated Approaches Including Remote Sensing, Applied Remote Sensing for Urban Planning, Governance and Sustainability.
Takeuchi, W., Noorazuan Hashim, & Thet, K. M. (2010). Application of remote sensing and GIS for monitoring urban heat island in Kuala Lumpur Metropolitan area. MapAsia 2010 and ISG 2010, Kuala Lumpur, Malaysia.
Voogt, J. A., & Oke, T. R. (2003). Thermal remote sensing of urban climates. Remote Sensing of Environment, 86, 370-384.
Wai, N. M., Camerlengo, A., & Ahmad Khairi Abdul Wahab. (2005). A study of global warming in Malaysia. Jurnal Teknologi, 42(F), 1-10.
Wen, X., Hu, G., & Yang, X. (2008). An investigation of the relationship between land cover ratio and urban heat island. Image and Signal Processing, 2008. CISP '08.
Weng, Q. (2001). A remote sensing–GIS evaluation of urban expansion and its impact on surface temperature in the Zhujiang Delta, China. International Journal of Remote Sensing, 22(10), 1999-2014.
Xian, G., & Crane, M. (2006). An analysis of urban thermal characteristics and associated land cover in Tampa Bay and Las Vegas using Landsat satellite data. Remote Sensing of Environment, 104, 147-156.
Xiao, R., Weng, Q., Ouyang, Z., Li, W., Schienke, E., & Zhang, Z. (2008). Land surface temperature variation and major factors in Beijing, China. Photogrammetric Engineering and Remote Sensing, 74(4), 451.
Yamashita, S., Sekine, K., Shoda, M., Yamashita, K., & Hara, Y. (1986). On relationships between heat island and sky view factor in the cities of Tama River basin, Japan. [doi: DOI: 10.1016/0004-6981(86)90182-4]. Atmospheric Environment (1967), 20(4), 681-686.
Yang, F., Lau, S. S. Y., & Qian, F. (2010). Summertime heat island intensities in three high-rise housing quarters in inner-city Shanghai China: Building layout, density and greenery. [doi: DOI: 10.1016/j.buildenv.2009.05.010]. Building and Environment, 45(1), 115-134.