COMPACT HANDHELD FRINGE PROJECTION BASED UNDERWATER 3D-SCANNER
C. Bräuer-Burchardt a*, M. Heinze a, I. Schmidt a, P. Kühmstedt a, G. Notni a,b a
Fraunhofer Institute Applied Optics and Precision Engineering, Jena, Germany - (christian.braeuer-burchardt, matthias.heinze, ingo.schmidt, peter.kuehmstedt, gunther.notni)@iof.fraunhofer.de
b
Technical University Ilmenau, Germany – [email protected]
Commission V
KEY WORDS: Underwater 3D-scanner, fringe projection technique, underwater stereo camera calibration
ABSTRACT:
A new, fringe projection based compact handheld 3D scanner for the surface reconstruction of measurement objects under water is introduced. The weight of the scanner is about 10 kg and can be used in a water depth of maximal 40 metres. A measurement field of about 250 mm x 200 mm is covered under water, and the lateral resolution of the measured object points is about 150 µm. Larger measurement objects can be digitized in a unique geometric model by merging subsequently recorded datasets. The recording time for one 3D scan is a third of a second. The projection unit for the structured illumination of the scene as well as the computer for device control and measurement data analysis are included into the scanners housing. A display on the backside of the device realizes the graphical presentation of the current measurement data. It allows the user to evaluate the quality of the measurement result in real-time already during the recording of the measurement under water. For the calibration of the underwater scanner a combined method of air- and water-calibration was developed which needs only a few recorded underwater images of a plane surface and an object with known lengths. First measurement results obtained with the new scanner are presented.
* Corresponding author
1. INTRODUCTION
Underwater 3D recording is a photogrammetric application field for more than 40 years (Höhle 1971, Moore 1976) which gets more and more importance. Application fields are the documentation of sunken objects like boat parts or ship wrecks (Korduan at al. 2003), the documentation of archaeological sites (Roman et al. 2010), the surface measurement and inspection of industrial facilities such as pipeline systems (Tetlow et al. 1999) or the measurement of biological objects such as fishes (Harvey et al. 2003, Dunbrack 2006, Costa et al. 2006) or coral reefs (Bythell et al. 2001).
Although fringe projection is a standard technique in the industrial quality management, rapid prototyping, archaeology and cultural heritage preservation, underwater applications are still seldom. This is probably because of the quite small area which can be sufficiently strong illuminated by the fringe projector. However, only in the past few years first 3D-measurement systems based on fringe projection technique were developed.
Structured laser light has been used for underwater photogrammetry since the nineties of the past century. Different techniques based on laser projection have been introduced (Tetlow and Allwood 1994, Moore 2001, Tan et al. 2005, Narasimhan and Nayar 2005). Massot-Campos and Olivier-Codina recently introduced a laser-based structured light system for single-shot 3D reconstruction.
First experimentation using a stereo camera setup and fringe projection technique for structured illumination was performed by Bruno (Bruno et al. 2011). There the suitability of the
measurement principle for underwater 3D application is shown, and potential applications are discussed.
Zhang (Zhang et al. 2011) introduces the same time a setup using one camera and one projector for underwater 3D measurements. His contribution is the proof of the suitability of the measurement principle. Bianco (Bianco et al. 2013) compares passive photogrammetric methods with active structured light projection techniques for underwater 3D reconstruction, especially with respect to the reconstruction quality in dependence on the water turbidity.
A complete scanning device based on fringe projection technique which can be practicably used has not yet been introduced. Our scanner is the first one using this technique. Compared to classical photogrammetric underwater applications, the measurement field is very small (about 250 mm x 200 mm) and allows the measurement of only small objects or parts of larger ones. However, a precise measurement with a very dense point distribution is possible.
The measurement accuracy of underwater 3D reconstruction is usually considerable lower than in air measurements. This is due to a number of worse conditions. In water, usually considerable more light is necessary to illuminate the measurement object than in air. That’s why extensive structured light such as fringe projection has not been used so far for the underwater 3D reconstruction of larger objects. The different refraction of the vision rays at the interfaces between the different media air, glass (or acrylic), and water, different geometric conditions are present than in air. This must be considered at the calibration of the systems and the calculation of the 3D measurement data.
Sedlazeck and Koch give an extensive survey and error analysis for the usage of different camera models for underwater photogrammetry (Sedlazeck and Koch 2011a). Calibration techniques are proposed e.g. by Li (Li et al. 1996) or Shortis (Shortis et al. 2000). However, these methods are quite effortful. Additionally, the long term stability of such optical underwater systems might be low as reported by Harvey (Harvey and Shortis 1998). Hence, it is desired to find a simple and robust methodology for underwater use. A method which would be performed in air and could be applied under water would be most ideal. Works by Fryer (Fryer and Fraser 1996) and Lavest (Lavest at al. 2000, Lavest et al. 2003) deal with that topic and explain the change of the intrinsic camera parameters including distortion.
Several authors (Maas 1995, Li et al. 1996, Kwon and Casebolt 2006, Telem and Filin 2010, Sedlazeck and Koch 2011b) propose the consideration of the refraction in the camera modelling and present appropriate calibration procedures and first experimental results.
In this work, first, the technical development of the underwater scanning device is described. Then a new simple calibration method for the determination of the interface distance is introduced. Finally, experiments and measurement results are presented and discussed.
2. TECHNICAL DEVELOPMENT OF THE DEVICE
2.1 Development of the 3D scanning technique
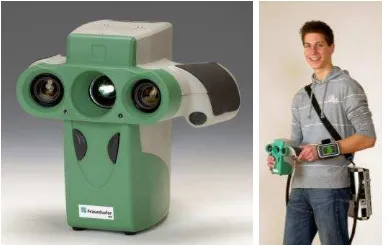
The starting point for the development of the inner parts of the scanner concerning design and frame size was the “kolibri Cordless” device (Munkelt et al. 2007) which is shown in Figure 1. However, certain functional groups had to be developed completely new because of the application field under water. This concerned a considerable more robust mechanics as well as different cameras and PC technique. First, the desired system parameters concerning measurement field size, spatial resolution, frame rate, measurement accuracy and application field were set (see Table 1).
Figure 1. Handheld 3D sensor system “kolibri Cordless” (left), separate control and analysis PC and wrist display (right)
The direct connection with the control and analysis PC and the display included into the underwater housing is a complete new principle. Hence, the connection between the scanner and an external PC is omitted, which should be otherwise carried in a backpack or external case. Hereby, a better handling at the underwater use is achieved. Indeed, the scanner itself becomes a bit heavier, but this will be no disadvantage in the underwater use. Neither upwelling nor sinking of the device should occur.
property desired parameter
Measurement volume (MV) 250 x 200 x 150 mm³
Working distance 500 mm
Camera resolution 1600 x 1200 pixel
Lateral resolution in the MV 150 µm
Noise of the 3D points 10 µm … 50 µm
Frame rate 60 Hz
Recording time per scan 350 ms
Maximal water depth 40 m
Sensor weight (without housing) about 2 kg
Sensor weight with housing about 10 kg
Table 1. Desired system parameters
The following criteria were important at the construction of the scanner:
Technical parameters (Table 1)
Simple handling at mounting into the housing Compactness of the scanner including housing Low weight of the scanner including housing Exhausting of the heat from the housing Good navigability under water
The main components of the scanner which should be connected compactly for the mounting into the housing are the projection unit including lens for the structured illumination of the scene, the both cameras including lenses for the scene observation, the control and analysis PC for data processing, the display, cooling elements for the heat removal, and mechanical elements for the connection of the principal parts.
The projection unit has the task to produce and project a sequence of fringes (Gray-code and sinusoidal fringes) onto the scene. Both cameras record this fringe image sequence synchronously. From these image sequences the so called phase images are calculated, which are used for the determination of the 3D data (see e.g. Schreiber and Notni 2000). The 3D calculation is performed on the PC, which also has the task to control the image recording and to realize the user interface shown on the display. The measurement results are also indicated on the display. Additional components are two laser pointers for checking the current measurement distance. Figure 2 shows two construction drawings of the scanner.
Figure 2. Construction drawing, two views The International Archives of the Photogrammetry, Remote Sensing and Spatial Information Sciences, Volume XL-5/W5, 2015
2.2 Development of the underwater housing
The underwater housing was developed by the 4h Jena engineering GmbH (4h Jena 2015). It was conceived for both fresh and salt water use. In order to sustain the water pressure a maximal diving depth of 40 m was set. The housing material is the synthetic material PA 2200. The optical windows for the cameras, the projector, and the laser beams were produced from sapphire glass, and the window for the display from polycarbonate. The plane windows for the cameras and the projector were tilted according to the directions of the optical axis in order to simplify the calibration procedure (see next section).
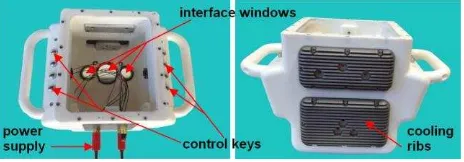
For the realization of a sufficient heat removal from the housing appropriate heat sinks and a base plate with cooling ribs were constructed. Additionally, a separable under water plug-in connector cable was realized for the power supply and the signal lines. In order to provide a correct handling also with diver gloves, separable inductive switching boards including control keys and interfaces to the scanner were developed (see Figure 3). Figure 4 shows a construction drawing and the scanner in the housing without back panel with the display.
Figure 3. Housing views
Figure 4. Housing views: construction draw, view from above (left), sensor inside housing without back-panel (right)
3. 3D SURFACE RECONSTRUCTION
3.1 Model
The principle in order to obtain 3D measurement points is triangulation of corresponding points in the two cameras as well known in photogrammetry (see e.g. Luhmann et al. 2006). However, because of the refraction of the rays at the interfaces between air, housing windows, and water, a simple transmission of the camera model would lead to considerable errors. Even if the parameters of the pinhole camera model are adapted to the underwater situation, the classical triangulation procedure would be erroneous without model extension. Hence, an extension of the typically used pinhole camera model is necessary.
However, there is one case, where the pinhole model could be applied in the same manner. This could be achieved if we
violate any refraction. This is obtained using spherical so called dome ports in the housing and placing the cameras exactly so, that the projection centre coincides with the centre point of the spheres fitted to the inner and outer dome port surface. Figure 5 illustrates this situation. In practical realizations of underwater cameras this principle has been applied, e.g. by Korduan (Korduan et al. 2003). However as reported by Bruno (Bruno et al. 2011), there occurred differences in the parameters of air and water calibration, probably due to deviations of the exact camera placement. Hence, additional correction parameters describing the distortion are necessary, probably depending on the object distance.
Figure 5. Ray directions using spherical dome ports
The second typical case of the housing interface is the use of plane glass (see Figure 6). Here we can observe refraction according to Snell’s law which should be considered in the procedure of calculation of the 3D measurement points. Several authors have proposed appropriate extensions of the camera model in order to regard the refraction effects, e.g. Li (Li et al. 1996), Kwon and Casebolt (Kwon and Casebolt 2006), or Telem and Filin (Telem and Filin 2011).
Figure 6. Ray directions with refraction effects using planar glass interface
An alternative is the initial usage of a different camera model, e.g. the ray-based model (Wolf et al. 2007, Bothe et al. 2010) or the raxel camera model (Grossberg and Nayar 2005).
Some Authors suggest using the pinhole camera model with adapted parameters obtained by calibration using underwater images (Fryer and Fraser 1986, Harvey and Shortis 1998, Costa et al. 2006).
3.2 Additional parameters
In contrast to the direct linear ray propagation, the directions of the rays from the object points in the water change by refraction before they reach the image plane. The change of the direction depends on the glass thickness, the orientation of the cameras optical axis concerning the glass surface, and the distance of the cameras projection centre to the housing interface.
In our modelling we assume a perpendicular orientation of the camera concerning the glass surface (see Figure 6). Hence, we have the additional parameters glass thickness th and interface distance d. These parameters have to be determined for both cameras. Additionally, the refraction indices of air na, water nw, and the window glass ng must be known. In the following we assume to know the refraction indices (na=1.0, nw=1.334,
ng=1.7) and the glass thickness th, which e.g. can be measured tactile using any precise measurement.
3.3 Corresponding point determination
The determination of corresponding points is realized using the fringe projection technique (Schreiber and Notni 2000).
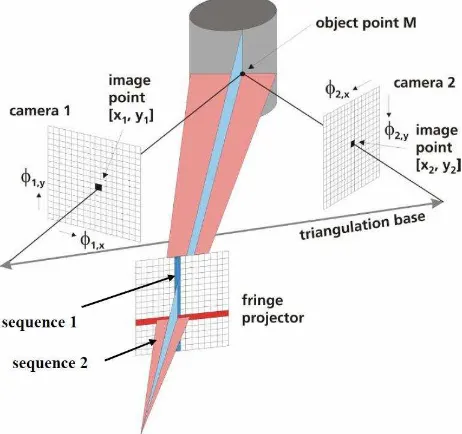
The projector generates subsequently two independent sinusoidal fringe sequences, rotated by 90° to each other (see Figure 7). As a result two pairs of phase values (φ1,x, φ1,y) and
(φ2,x, φ2,y) at each object point M observed by the cameras from
the different perspectives are obtained using a phase generation algorithm (see e.g. Creath 1986). These phase values are initially wrapped, i.e. same phase values repeat periodically over the image. Unwrapping can be obtained using the additional Gray-code sequence.
Starting from camera 1 with image co-ordinates [x1, y1] and phase values (φ1,x, φ1,y) the corresponding image point in camera
2 is searched. Image co-ordinates [x2, y2] in camera 2 are calculated with sub-pixel accuracy, based on the identical phase information (phase values (φ2,x, φ2,y)). The final results of this
procedure are pairs of image points resulting from the same object point, the homologous or corresponding points, respectively. On the basis of the identified homologous points the calculation of the 3D co-ordinates is done by the well-known triangulation technique.
However, phase values are only used for correspondence finding. Hence, it is not necessary to calibrate the projector.
Figure 7. Principle of phase correlation using fringe projection
Typically, a four-, six-, or eight-phase-shift algorithm (see Creath 1986) in addition to a Gray-code sequence is used for phase generation. Hence, one projected image sequence consists
of between 20 and 32 images, leading to a projection/recording time of about a third or a half second per scan. Unfortunately, epipolar geometry cannot be used in order to reduce the fringe code to one direction of projection because of the invalidity of the pinhole camera model.
3.4 Approaches for underwater calibration
The change of the intrinsic camera parameters for the underwater case starting from the air parameters are described by Fryer and Fraser (Fryer and Fraser 1986) and Lavest (Lavest et al. 2003). They propose an extension of the principal distance by factor nw/na and a reduction of the radial distortion Δr the scene best (i.e. with a minimal error in the calculation of the 3D points). This could be obtained either by performing a calibration using underwater image recordings (as proposed e.g. by Bryant (Bryant et al. 2000) or Bruno (Bruno et al. 2011) ) or performing an air calibration and transforming the intrinsic parameters and the distortion as proposed by Lavest (Lavest et al. 2003). Additionally, a translation of the projection centre can be estimated (see next section).
We applied the second option, but only for comparison to our calibration with extended camera model (see next section). The assumptions of changing principal distance and distortion are meaningful only, if the pinhole model is used as an approximation. In fact, the intrinsic parameters do not really change.
Consequently, our final approach is to use the parameters of the air calibration and describe the direction of the vision rays according to refraction and the additional parameters th and d. Hence, one task of the underwater calibration is to find the values for the additional parameters. The other one is the formulation of the correct calculation of 3D measurement points based on found corresponding image points in the two cameras.
Because we assume for simplification a perpendicular normal angle concerning the glass surface we obtain a shift l of the projection centre in direction of the optical axis and a scaling factor sf for the principal distance c in dependence on the radial distance r of the image points concerning the principal point:
Equations (2) and (3) are applied at calculation of the 3D points by triangulation using the known formulas of the pinhole The International Archives of the Photogrammetry, Remote Sensing and Spatial Information Sciences, Volume XL-5/W5, 2015
camera case. However, by extension of (2) and (3) we, in fact, obtain a ray-based camera model (RM).
3.5 Realization of the underwater calibration
The first step of our underwater calibration was the realization of an air calibration using a plane grid target (see Figure 7) providing a number of landmarks with known 3D co-ordinates (the grid plane was set to Z=0). In principle, any suitable calibration technique known from photogrammetry or fringe projection technique can be applied.
The indices of refraction for air na, water nw, and glass (acrylic) ng are assumed to be known. The next step is the determination
of the glass thickness. In our case we measured it tactile before mounting the underwater housing. If this would not be possible, e.g. the method proposed by Chang and Yang (Chang and Yang 2014) could be applied.
Figure 8. Grid pattern (left) and ceramic plane (right)
Finally, the interface distances d1 and d2 for both cameras had to be determined. In order to obtain this, the following algorithm A1 was applied:
Underwater recording of a plane surface (see Figure 8) in two different distances (minimum and maximum distance in the measurement volume)
Underwater recording of specimen with known (calibrated) length information (ball bar – see Figure 9) in two different positions
Definition of the error function T for the test statistic: minimal length error and flatness of the plane
Determination of the searched parameters by minimization of T
Figure 9. Specimen for calibration: calibrated ball bar
Minimization of T can be achieved by a systematic search in the parameter space of d1 and d2 with meaningful search interval limits and step-widths. Having only two parameters, systematic search may be considerable more effective than trying to formulate an optimization task, because of the trigonometric functions in the equations (2) and (3). Application of this algorithm leads to the searched parameters d1 and d2. First results of the underwater measurements are described in the next section.
4. EXPERIMENTS AND RESULTS
4.1 Calibration evaluation
First experiments with the new underwater scanner were performed in order to characterize the measurement accuracy of the device. This means the evaluation of the calibration quality in combination with the physical limits of the scanners hardware. In order to do this, we first performed air calibration. In order to show the advantages of the consideration of the refraction effects into the calibration, we additionally performed air calibration of the scanner inside the housing and an approximation of the underwater geometry using the pinhole model (PM).
The next step was the recording of the four calibration sequences according to A1 described in the previous section. The measurement objects were put into a rain barrel (see Figure 10), filled with fresh water. These four datasets were used to determine the interface distances d1 and d2. Afterwards, we made underwater measurements of the plane, the ball bar, and a pyramid stump (see Figure 10) in different position in the measurement volume according to the VDI/VDE suggestions (VDI/VDE 2008). These measurements were used to evaluate the quality of the calibration. The edge length of the pyramid stump was determined by air measurement for comparison.
Figure 10. Pyramid stump in the rain barrel
The quantities length deviation ld and flatness deviation fd were defined as follows:
calib
i meas i dist
dist
ld max (4)
fdjfdmax (5)
where disti meas
is the measured length and disti calib
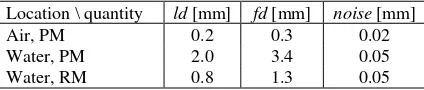
the calibrated length at measurement i, and fdj is the double maximal deviation of the measured ceramic plane from a fitted plane. At least seven measurements were performed in both cases (i, j = 1, …, 7). Additionally, noise was determined as standard deviation of the measured 3D points from a small locally fitted plane. Table 2 documents the obtained results.
Location \ quantity ld [mm] fd [mm] noise [mm]
Air, PM 0.2 0.3 0.02
Water, PM 2.0 3.4 0.05
Water, RM 0.8 1.3 0.05
Table 2. Results for the calibration evaluation The International Archives of the Photogrammetry, Remote Sensing and Spatial Information Sciences, Volume XL-5/W5, 2015
4.2 Test measurements in a water basin
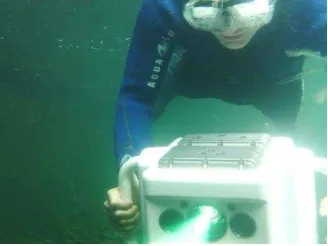
The next task was the application of the scanner in a water basin. It was handled by a diver as can be seen in Figure 11. The first measurement objects were a pipe (Figure 12) and stones (Figure 13).
Figure 11. Underwater use of the scanner
Figure 12. Underwater measurement of a pipe (left), color coded 3D representation of the measurement result (right)
Figure 13. Example underwater measurement stones with several 3D representations and identification of the same
objects in different scans
5. SUMMARY, DISCUSSION, AND OUTLOOK
A new fringe projection based 3D underwater scanner for diving depths up to 40 m was introduced which covers a measurement field of 250 mm x 200 mm and can record up to three 3D scans per second. The lateral resolution of the measured object points is about 150 µm. Larger measurement objects can be digitized in a unique geometric model by merging subsequently recorded datasets.
The described device is one of the first complete underwater 3D scanners based on fringe projection technique. The comparison to other systems (e.g. Bruno et al. 2011, Zhang et al. 2011, Bianco et al. 2013) based on fringe projection technique is difficult, because their systems were laboratory setups and the projector was not included in the camera housing. However, our
scanner has a smaller measurement field. Measurement accuracy is difficult to compare, but seems to be similar.
The reported relative measurement accuracies of other photogrammetric systems, (e.g. Li et al. 1996 or Telem and Filin 2010) has the same magnitude. The main differences between photogrammetric and systems based on structured light projection are the measurement volume (photogrammetry: possibly large – structured light: small) and the measurement point density (photogrammetry: low – structured light: dense).
Future work should be addressed to different items. First, more experiments must be performed in order to get a more robust characterization of the scanner. Second, several methods for housing parameter calibration described by other authors (Sedlazeck and Koch 2011b, Chen and Yang 2014) should be implemented and compared to our approach. This includes the determination of the interface normal, although it could be neglected for our present scanner. The third focus of our future work is addressed to experiments concerning the dependence of the measurement accuracy on the water quality (different levels of turbidity, comparison between fresh and salt water).
ACKNOWLEDGEMENTS
This work was supported by the state Thuringia and the European Union (EFRE) under grant label TNA VIII-1/2012.
REFERENCES
4h Jena, 2015. http://www.4h-jena.de/ (12.03.2015)
Bianco, G., Gallo, A., Bruno, F., Muzzupappa, M., 2013. A comparative analysis between active and passive techniques for underwater 3D reconstruction of close-range objects, Sensors 2013, 13, 11007-11031
Bothe, T., Li, W., Schulte, M., von Kopylow, C., Bergmann, R.B., Jüptner, W., 2010. Vision ray calibration for the quantitative geometric description of general imaging and projection optics in metrology, Applied Optics, Vol. 49, No 30, 5851-5860
Bruno, F., Bianco, G., Muzzupappa, M., Barone, S., Razionale, A.V., 2011. Experimentation of structured light and stereo vision for underwater 3D reconstruction, ISPRS Journal of Photogrammetry and Remote Sensing 66, 508–518
Bryant M., Wettergreen, D., Abdallah, S., Zelinsky, A., 2000. Robust camera calibration for an autonomous underwater vehicle, In: Australian Conference on Robotics and Automation, ACRA 2000
Bythell, J.C., Pan, P., Lee, J., 2001. Three-dimensional morphometric measurements of reef corals using underwater photogrammetry techniques, Springer Coral Reefs, 20, 193-199
Chen X., Yang, Y.H., 2014. Two view camera housing parameters calibration for multi-layer flat refractive interface, CVPR 2014,
Costa, C. Loy, A., Cataudella, S., Davis, D. Scardi, M., 2006. Extracting fish size using dual underwater cameras, Aquacultural Engineering 35, 218–227
Creath, K., 1986. Comparison of phase-measurement algo- rithms. Surface characterization and testing, Proc SPIE 680, 19–28
Drap, P., 2012. Underwater Photogrammetry for Archaeology. In: Carneiro Da Silva, D. (Ed.): Special Applications of Photogrammetry, InTech publ., ISBN 978-953-51-0548-0, 2012, 111-136
Dunbrack, R. L., 2006. In situ measurement of fish body length using perspective-based remote stereo-video, Fisheries Research 82, 327–331
Fryer, J.G., Fraser, C.S., 1986. On the calibration of under- water cameras. The Photogrammetric Record 12(67), 73-85
Gracias, N., Santos-Victor, J., 2000. Underwater Video Mosaics as Visual Navigation Maps. CVIU 79, 66–91
Grossberg, M.D., Nayar, S.K., 2005. The raxel imaging model and ray-based calibration, IJCV 61(2), 119-137
Harvey, E., Cappo, M., Shortis, M., Robson, S., Buchanan, J., Speare, P., 2003. The accuracy and precision of underwater measurements of length and maximum body depth of southern bluefin tuna (Thunnus maccoyii) with a stereo–video camera system. Fisheries Research 63, 315–326
Harvey, E.S., Shortis, M.R., 1998. Calibration stability of an underwater stereo-video system. Implications for measurement accuracy and precision, Marine Technol. Soc. Journ. 32, 3-17
Höhle, J., 1971. Zur Theorie und Praxis der Unterwasser-Photogrammetrie, In: Deutsche Geodätische Kommission, Reihe C, Dissertationen, Bayerische Akademie der Wissenschaften München
Korduan, P., Förster, T., Obst, R., 2003. Unterwasser-Photogrammetrie zur 3D-Rekonstruktion des Schiffswracks "Darßer Kogge", in: Photogrammetrie Fernerkundung Geoinformation, Nr. 5, 373 – 381
Kwon, Y.H., Casebolt J.B., 2006. Effects of light refraction on the accuracy of camera ca-libration and reconstruction in underwater motion analysis, Sports Biomech. 5, 315–340
Lavest J.M., Rives, G., Lapreste, J.T., 2000. Underwater camera calibration, Proc ECCV 2000, 654–668
Lavest J.M., Rives, G., Lapreste, J.T. (2003): Dry camera calibration for underwater applications. Machine Vision and Applications 2003, 13: 245–253
Li, R., Tao, C., Curran, T., Smith, R., 1996. Digital underwater photogrammetric system for large scale underwater spatial information acquisition, Marine Geodesy, 20: 163-173
Luhmann, T., Robson, S., Kyle, S., Harley, I., 2006. Close range photogrammetry. Wiley Whittles Publishing
Maas, H.G., 1995. New developments in multimedia photo- grammetry. In: Optical 3-D Measurement Techniques III. (Eds.: A. Grün, H. Kahmen), Wichmann Verlag, Karlsruhe
Massot-Campos, M., Oliver-Codina,G., 2014. Underwater laser-based structured light system for one-shot 3D reconstruction. 5th Martech Int Workshop on Marine Technology, Girona, Spain
Moore, E.J., 1976. Underwater photogrammetry. Photogram-metric Record 8(48): 748-163
Moore, K.D., 2001. Intercalibration method for underwater three-dimensional mapping laser line scan systems, Applied Optics, Vol. 40, No. 33, 5991 - 6004
Munkelt, C., Bräuer-Burchardt, C., Kühmstedt, P., Schmidt, I., Notni, G., 2007. Cordless hand-held optical 3D sensor, Proc. SPIE Vol. 6618, pp. 66180D-1-8
Narasimhan, S.G., Nayar, S.K., 2005. Structured Light Methods for Underwater Imaging: Light Stripe Scanning and Photometric Stereo, OCEANS 2005, Proc of MTS/IEEE, vol. 3, 2610-2617
Roman, C., Inglis, G., Rutter, J., 2010. Application of structured light imaging for high resolution mapping of underwater archaeological sites, OCEANS 2010, Sydney, 1–9
Schreiber, W., Notni, G., 2000. Theory and arrangements of self-calibrating whole-body three-dimensional measurement systems using fringe projection techniques. Optical Engineering 39, 159-69
Sedlazeck, A., Koch, R., 2011a. Perspective and non-perspective camera models in underwater imaging - overview and error analysis. In: Theoretical Foundations of Computer Vision, vol. 7474 of Springer LNCS, 212–242
Sedlazeck, A., Koch, R., 2011b. Calibration of housing parameters for underwater stereo-camera rigs. In: Hoey, J., McKenna, S., Trucco, E. 2011. Proc BMVC, 118.1-118.11
Shortis, M. R., Miller, S., Harvey, E. S., Robson, S., 2000. An analysis of the calibration stability and measurement accuracy of an underwater stereo-video system used for shellfish surveys, Geomatics Research Australasia, 73, 1-24
Tan, C.S., Seet, G., Sluzek, A., He, D.M., 2005. A novel application of range-gated underwater laser imaging system (ULIS) in near-target turbid medium, Optics and Lasers in Engineering 43, 995–1009
Telem, G., Filin, S., 2010. Photogrammetric modeling of underwater environments, ISPRS Journal of Photogrammetry and Remote Sensing 65(5), 433
Tetlow, S., Allwood, R.L., 1994. The use of a laser stripe illu- minator for enhanced underwater viewing, Proc SPIE 2258, 547-555
Tetlow, S., Spours, J., 1999. Three-dimensional measurement of underwater work sites using structured laser light. Meas. Sci. Technol. 10 (1999) 1162–1167
VDI/VDE, 2008. VDI/VDE 2634. Optical 3D-measuring systems. VDI/VDE guidelines, Parts 1-3
Yau, T., Gong, M., Yang, Y.H., 2013. Underwater camera calibration using wavelength triangulation. Proc CVPR 2013, 2499-2506
Zhang, Q., Wang, Q., Hou, Z., Liu, Y., Su, X., 2011. Three-dimensional shape measurement for an underwater object based on two-dimensional grating pattern projection, Optics & Laser Technology 43, 801–805