3D MODELING FOR UNDERWATER ARCHAEOLOGICAL DOCUMENTATION:
METRIC VERIFICATIONS
D’Amelio S., Maggio V., Villa B.
DICAM Departement of Civil, Environmental, Aerospace, Materials Engineering of University of Palermo [email protected]
Commission V
KEY WORDS: 3DModeling, Underwater Archaeology, Photogrammetry, Laser Scanner, Autodesk123DCatch.
ABSTRACT:
The survey in underwater environment has always presented considerable difficulties both operative and technical and this has sometimes made it difficult to use the techniques of survey commonly used for the documentation of Cultural Heritage in dry environment. The work of study concerns the evaluation in terms of capability and accuracy of the Autodesk123DCatch software for the reconstruction of a three-dimensional model of an object in underwater context. The subjects of the study are models generated from sets of photographs and sets of frames extracted from video sequence. The study is based on comparative method, using a reference model, obtained with laser scanner technique.
1. INTRODUCTION
The documentation of underwater cultural heritage is a main step for the study and the conservation of finds and for the preliminary project of conservation intervention. Underwater finds, especially those most fragile, as wooden elements of wrecks or of theirs loaded wares, subsequently to their discovery and excavation have to be surveyed in a short time before an appropriate project of recovering and conservation. The survey in underwater environment had ever presented many difficulties both operative and technical, and that not allowed the use of the survey techniques applied, commonly, to the documentation of cultural heritage in dry environment.
Today in the field of documentation of Cultural Heritage are witnessing a remarkable development of techniques of 3D Modeling, which allow obtaining rapidly, and almost automatically, three-dimensional models from digital images. These techniques are based on algorithms derived from the field of Compter Vision and are able to accelerate the process of generation of 3D metric data. (Barazzetti et al, 2010, 2011). The algorithms applied are referred to the Structure for Motion (SfM) technique, that allows to obtain automatically both the orientation of photograms that the generation of 3D model, without the use of external targets (Remondino ,2010).
Low-cost Photogrammetric Softwares (i.e. Agisoft PhotScan) and free web-sources softwares (i.e. ARC3D, Autodesk123D Catch, Hyp3D) are based on these algorithms, and are able to generate automatically 3D model from sets of captures obtained with not calibrated cameras. Recent studies are oriented to the verification and reliability of the results obtained from the use of web-service software in the context of the documentation of architectural and archaeological heritage (Fratus de Balestrini, Guerra, 2010).
Given the robustness of the algorithms used, it’s possible to process large amounts of frames in the processing of the autocorrelations of the homologous points and the orientation of the entire sets of photo, even under extreme conditions for application of traditional photogrammetric techniques, with disturbing elements such as falls of light, variable shadows, optical distortions, variable distance from the subject, variation of the focal distance, etc. In relation to the flexibility of the approach it can be used for wide range of scenes and objects (Alshawabkeh et al., 2011).
In recent years in the field of underwater archaeological documentation it’s interesting the implementations of automation processes in the techniques of close-range photogrammetry (Canciani et al., 2002), with the use of coded targets for the calibration of the camera. Other recent studies are based on automatic image-based techniques that investigates the potential and limitations of this technique on set of digital photos (Skarlatos et al. 2012).
2. MAIN GOALS AND METHOD APPLYED 2.1 Main goals
The main goals research regard the evaluation in terms of reliability and metric accuracy of the 3D models generated by the free web-sources software Autodesk123DCatch of an free-morphing object, an amphora, placed on the seabed, the typical archaeological context of the discovery of an isolated finding. The 3D models are generated from different sets of photographs, at different resolution, and from sets of frames extracted from the video of the same scene. For each generated models the software did not associate any type of data near the quality of the process. For this reason, the evaluation is carried out with a comparative method: the 3D models, oriented and scaled meshes, are compared directly with a reference surface at high resolution obtained with a laser-scanner survey. Object of the test is an amphora 40cm high and with a maximum distance between the handles of 33cm.
2.2 Method of research
In order to obtain an assessment of the reliability and accuracy of the software, we carry out a set of captures and video recording around the subject. At base of the amphora, on seabed, is placed a metric reference, a metal square frame, of side of 60cm length, with a graduated scale and a target for each vertex.
We carry out four tests, (two for sets of photos and two for sets of video-frames). Regarding the processing of the photos, for both the tests we used the same set of photos but we change the resolution of pictures). For the tests with video-frames, we maintain the same resolution (video resolution) for both tests, but we change the number of frames. Before starting the
processing, we need to extract each frame (as single picture) from video recording.
The meshes generated, scaled and oriented, are compared directly with software Geomagic Qualify able to manage, from time to time, the comparison between the meshes and to display the values and the graphics of maximum and minimum deviation between the surface obtained and the surface of reference.
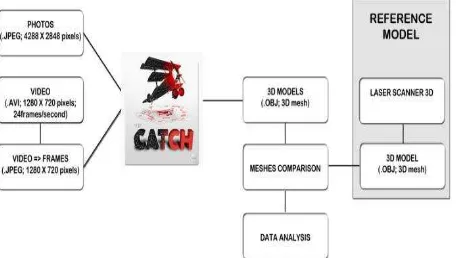
Figure 1. The workflow of the project of research.
3. THE PROJECT DESCRIPTION 3.1 Acquisitions data
3.1.1 Laser scanner process: The reference model is generated through 3D scans, acquired with the triangulation laser-scanner NextEngine3DScanner. The “wide” mode used can reach the accuracy of 0.4 mm maximum. The point clouds are oriented through the use of software NextEngineStudioCORE, applying the alignment process both manually and automatically. The software also allows the generation of a textured mesh exportable in OBJ. format.
3.1.2 Photogrammetric process: For the acquisitions of photos and video, we used a SRL NikonD90 camera equipped with optical zoom 18-55mm Nikkor. The maximum resolution of its sensor is 12Mpx (4288x2848 pixels). The camera is equipped with underwater housing dedicated for operation with up to 60m deep. We used a wide focal length of 18mm (near 24mm in dry environment), starting from the consideration of having to operate at close distance, of about 1m, from the subject and in order to be able to have a complete vision of this and of the metric reference into each frame. The set of pictures consists of 30 captures carried around to the object with a convergence angle of the optical axis of about 12 ° between consecutive captures and with a tilt of 45 ° with respect to the seabed. For the acquisition, we used the highest resolution (4200x2848 pixels) and saved pictures in .JPEG format. The video-recording is carried around the subject, as the above mentioned captures, at the same focal length (18mm) and at the maximum resolution of 1280 x 720 pixels and a frequency of 24 frames/second.
3.2 Data Processing
3.2.1 Laser Scanner process: In order to be able to have a reference model for the phase of the direct comparison to carry out with the software GoemagicQualify, it’s necessary the decimation of the number of faces of the triangular mesh obtained. The decimation process is set by imposing the priority of curvature which allows to maintain a good detail of parts of the surface particularly articulated. At the end of the decimation process the new mesh has a number of faces (triangles)of the same order of the meshes to compare, without a sensitive loss of accuracy.
3.2.2 Photogrammetric process: The workflow of the software free web-sources Autodesk123DCatch can be summarized as follows:
• upload of the images on the processing server; • processing by the remote server for the reconstruction
of the 3D model; • download of the mesh .
After initial upload of images, it’s possible to insert the homologous points on the frames manually, in the process of orientation of the frames, and also to set the metric references or values relative to the camera. However, we decide to leave all the parameters as of default. In our case, since the frames are uploaded in ordered sequence and with good coverage of the image between successive frames, it’s not necessary to insert homologous points manually and the system not detect any problem of processing of different groups of frames.
For the first test, the set of 30 photographs maintains the full resolution (4288x2848 pixels) of the .JPEG files. For the second test, the same set is processed at the resolution of 1270x850 pixels, that is the closest resolution to that of video frames (1270x720pixel).
Before the processing of the video frames, we convert the video from .AVI format to .JPEG format, creating an image file for each frame. The number of frames generated for the video recording of 53 seconds is almost 1300.
For the third test, we select a set of 30 frames (one in 36 frames), that is the same number in the previous tests. In the latest test, we increase the number of frames up to 252 (one in 7 frames).
For every test, we generate two triangular meshes, with setting “mobile” mode (low quality), for the first, and the “maximum” mode (high quality), for the second.
3.3 Analisys and critical evaluation of data
To obtain the comparison with the software Geomagic Qualify between each mesh, generated with Autodesk 123DCatch, with the reference model, we need, in the first time, apply the process of alignment of the meshes at the same reference system. The software allows you to process a report of deviation values max and min, average distance and standard deviation obtained by the comparison of the accuracy of each mesh with the reference model.
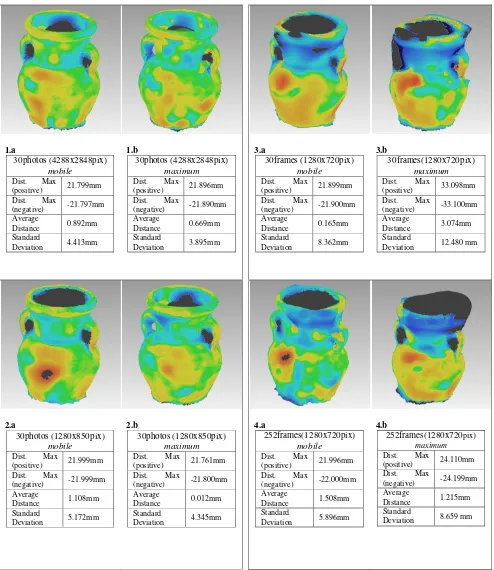
At the end of the comparison process we obtain the values for each processing and the graphical representation of the values of the deviation according to a chromatic scale, having values of maximum deviation of ± 25mm and a unit value of ± 0.50mm. Values greater than the maximum deviation are excluded from the calculation because in all cases these regard the not visible areas of the handles and to the inner part of the neck of the amphora.
1.a 1.b 30photos (4288x2848pix)
mobile Dist. Max
(positive) 21.799mm Dist. Max
(negative) -21.797mm Average
Distance 0.892mm Standard
Deviation 4.413mm
30photos (4288x2848pix)
maximum Dist. Max
(positive) 21.896mm Dist. Max
(negative) -21.890mm Average
Distance 0.669mm Standard
Deviation 3.895mm
2.a 2.b
30photos (1280x850pix)
mobile Dist. Max
(positive) 21.999mm Dist. Max
(negative) -21.999mm Average
Distance 1.108mm Standard
Deviation 5.172mm
30photos (1280x850pix)
maximum Dist. Max
(positive) 21.761mm Dist. Max
(negative) -21.800mm Average
Distance 0.012mm Standard
Deviation 4.345mm
3.a 3.b
30frames (1280x720pix)
mobile Dist. Max
(positive) 21.899mm Dist. Max
(negative) -21.900mm Average
Distance 0.165mm Standard
Deviation 8.362mm
30frames(1280x720pix)
maximum Dist. Max
(positive) 33.098mm Dist. Max
(negative) -33.100mm Average
Distance 3.074mm Standard
Deviation 12.480 mm
4.a 4.b
252frames(1280x720pix)
mobile Dist. Max
(positive) 21.996mm Dist. Max
(negative) -22.000mm Average
Distance 1.508mm Standard
Deviation 5.896mm
252frames(1280x720pix)
maximum
Dist. Max
(positive) 24.110mm Dist. Max
(negative) -24.199mm Average
Distance 1.215mm Standard
Deviation 8.659 mm
Table 1. Graphical representation of the values of the deviation according chromatic scale and relative value table of maximum distance (positive and negative), average distance, standard deviation.
The study of the data is oriented, in a first time, to the comparison between the values, obtained for each test, then we carry out an evaluation in terms of a real usefulness of the models obtained for the purpose of the underwater archaeological documentation.
According to the values of deviation, shown in Table 1, there is the highest accuracy using full-resolution photos (1.a and 1b) and a decrease of the value of maximum deviation for 1 .b of 20% than 1.a, so an increase of accuracy applying the “maximum” mode.
An analysis of cases 2.a and 2.b shows an increase in the standard deviation but always near to the corresponding cases 1.a and 1.b (+ 10% approx), and a concordant increase in precision in the transition from “mobile” mode to that “maximum”.
For the cases 3.a and 3.b of the sets of frames extracted from the video, it occurs that, although the resolution of frames is 1280x720pixels, very close to that of the cases 2.a and 2.b (1280x850pixels), and there is the same number of frames (30), in comparing the cases 2.a and 3.a there is an increase of almost 45% of the value of average deviation. Also occurs that the 13% of the vertices of the mesh generated in 3.a are more distant in the value of fixed maximum deviation and are automatically excluded from the calculation.
This suggests that a decrease of accuracy dependent mainly on the quality of video-frames, in fact the images present a panning effect. This disturb becomes critical when we apply the “maximum” mode (case 3.b): a standard deviation value of 3.b greater than 50% percent compared to that of 3.a.
For cases 4.a and 4.b, the number of frames processed is 252 (more than eight times that of 3.a and 3.b). The number of vertices of the mesh excluded from the calculation is 14% for 4.a case and 16% for 4.b case.
With the increasing of eight times the number of frames respect to the cases 3.a and 3.b (from 30 to 252) we improved the accuracy with a reduction of the value of standard deviation of about -30%. As for the cases 3.a and 3.b we have a loss of accuracy of the mesh obtained with “maximum” mode respect to the other obtained with “mobile” mode.
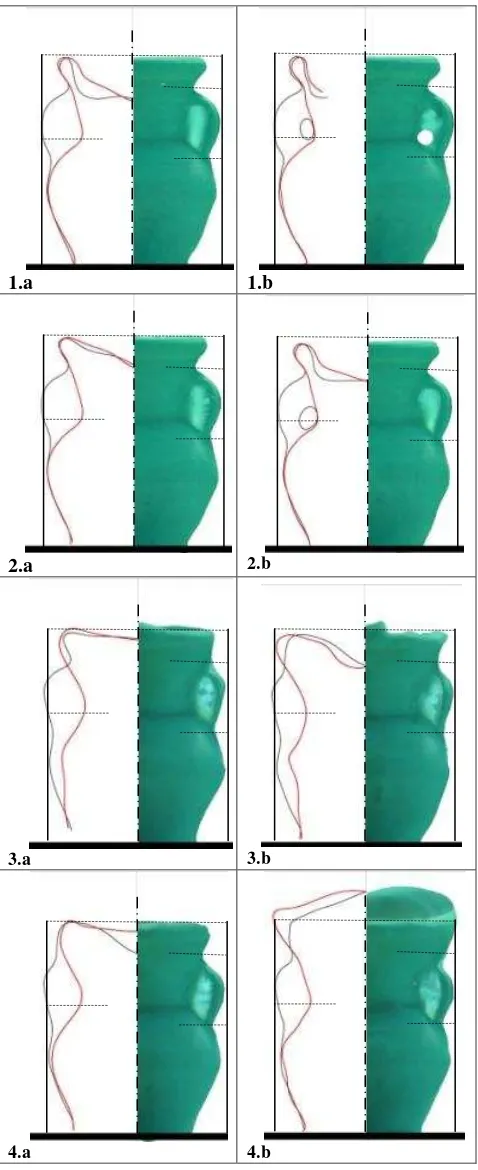
We carry out another type of study about the real usefulness for practical aspects of the archaeological documentation. In particular we propose the study of the profiles of 3D models obtained for each test to evaluate if these are able to describe geometrically in order to allow an identification and a first classification of the archaeological find. For this purpose, we create two profiles for each model trough the sections of the 3d mesh with a pair of orthogonal planes having the axis coincident with that of symmetry of the geometry of the amphora.
The first of the two planes, which intersect the two handles of the amphora, allow to obtain a longitudinal section. In the following diagrams are shown on the left side, respect to the axis of symmetry, two half-sections (the longitudinal section, represented by the black line, and the perpendicular represented by the red line), while the right side is presented a front view of the model with texture. For each diagram we overlap the metric references, dashed lines, of the reference model and these represent some of the geometric elements necessary for the identification of an amphora type: total height, shoulder height, points of attack on the handles.
1.a
1.b
2.a
2.b3.a 3.b
4.a 4.b
Table 2. Graphical representations of sections and 3D textured surfaces, with metric reference of the geometric
elements measured on the reference model.
An analysis of the diagrams in Table 2 shows a geometric correspondence of the characteristic elements taken as reference, and this even in models with worse accuracy (3.be 4.b). Despite the strong deformation of the models obtained, for these models we should obtain roughly the size of the object and the identification of different parts of the same, and its spatial position.
4. CONCLUSIONS
As shown above, and relatively to the metric data obtained, we state that the software Autodesk123DCatch is capable of processing three-dimensional models of the object through the use of photos, obtaining a level of accuracy sufficient for the geometrical characterization of the object (1.a, 1.b, 2.a, 2.b cases). In cases in which is used the frames of the video, we obtained a deterioration of the metric accuracy, sometimes resulting in a substantial deformation of the model respect to the reference model (3.b, 4.b cases).
The loss of surface quality certainly does not allow the geometric description as clear as in the previous cases, but still allows you to be able to identify the maximum sizes of the object and its fundamental parts (handles, neck, shoulder). This aspect is an important factor as it allows however to be able to identify the type of the object (amphora) and its spatial position, that with the metric dimensions, allow to obtain a clearer description of the archaeological context and provides useful information in any excavation and /or recovery project. A general evaluation may be made in respect of the potential of the technique used. It allows to obtain a considerable amount of metric data relating to an underwater context not reachable trough any other survey technique currently employed in the field of marine archeology, to this is added the shortness of time for the capture phase and the processing phase. Also the ease of realization the entire process from capture phase to the phase of processing with the software, which reduces the intervention of the user, allows its use by not specialized users.
Despite the relatively low value of accuracy of the models obtained from the frame-video, it can be seen that in any case the system can generate the metric data from video sequences, and this opens up an important possibility of application with the use of archival material. The video documentation is usually more available, as always used in the investigation of underwater archaeological study as well as that of the photographic documentation. For this latter we can use sets of picture employed for pthoto-mosaic project of the area, in fact the overlapping of the image between consecutive picture is at least 60%, and this allows a good configuration for the software Autodesk123DCatch.
REFERENCES
Alshawabkeh Y., Douglas K., Matarya M., Khrisat B., (2011). “Combined Photogrammetric Techniques and Computer Vision: 2D-3D Recording of Gharissa, Jordan”, Journal of Architectural Conservation, Volume 17, 2, 77-92.
Barazzetti, L., Remondino, F., Scaioni, M., (2010), “Orientation and 3D modelling from markerless terrestrial images: combining accuracy with automation”, The Photogrammetric Record, 25,132, 356–381.
Barazzetti, L., Binda, L., Scaioni, M., Taranto, P. (2011), “Photogrammetric survey of complex geometries with low-cost software: Application to the “G1” temple in Myson, Vietnam”, Journal of Cultural Heritage, 12,3, 253-262.
Canciani, M., Gambogi, P., Romano, G., Cannata, G., and Drap, P. (2002), “Low cost digital photogrammetry for underwater archaeological site survey and artefact insertion. The case study of the Dolia Wreck in Secche della Meloria, Livorno, Italia”, International Archives of Photogrammetry, Remote Sensing and Spatial Information Sciences, 34.5/W12, 95-100.
Doneus M., Verhoeven, G., Fera, M. Briese, Ch., Kucera, M., Neubauer, W., (2011) “From deposit to point cloud – a study of low-cost computer vision approaches for the straightforward documentation of archaeological excavations”, XXIIIrd International CIPA Symposium, Prague, 12-16 September 2011.
Fratus de Balestrini, E., Guerra, F., (2010) “New instruments for survey: on line softwares for 3D reconstruction from images” The International Archives of the photogrammetry, Remote sensing and Spatial Information Science, Vol. XXXVIII-5/W16, 545-552.
Moons, T., 1997. Report on the Joint ISPRS Commission III/IV Workshop “3D Reconstruction and Modelling of Topographic Objects”, Stuttgart, Germany http://www.radig.informatik.tu-muenchen.de/ISPRS/WG-III4-IV2-Report.html (28 Sep. 1999).
Remondino, F., El-Hakim, S. (2006), “Image-based 3D modelling: a review”, The Photogrammetric Record, 21,115, 269-291.
Remondino, F., Rizzi, A. (2010), “Reality-based 3D documentation of natural and cultural heritages sites – techniques, problems, and examples”, Applied Geomatics, 2,3, 85-100.
Skarlatos D., Demestiha S., Kiparissi S.(2012), “An ‘Open’Method for 3D Modelling and Mapping in Underwater Archaeological Sites”, International Journal of Heritage in the Digital Era, 1,1,1-24.
Snavely, N., Seitz, S. M., Szeliski, R. (2007), Modeling the World from Internet Photo Collection, International Journal of Computer Vision, 80,2, 189-210.
Smith, J., (1987)a. Close range photogrammetry for analyzing distressed trees. Photogrammetria, 42(1), pp. 47-56.
Smith, J., (1987), b. Economic printing of color orthophotos. Report KRL-01234, Kennedy Research Laboratories, Arlington, VA, USA.
Smith, J., (1989). Space Data from Earth Sciences. Elsevier, Amsterdam, pp. 321-332.
Smith, J., (2000). Remote sensing to predict volcano outbursts. In: The International Archives of the Photogrammetry, Remote Sensing and Spatial Information Sciences, Kyoto, Japan, Vol. XXVII, Part B1, pp. 456-469.
Vergauwen, M., Van Gool, L. (2006), “Web-based 3D reconstruction service”, Machine Vision and Application, 17, 411-426.