USING SMOS PASSIVE MICROWAVE DATA TO DEVELOP SMAP FREEZE/THAW
ALGORITHMS ADAPTED FOR THE CANADIAN SUBARCTIC
P. Kalantaria, M. Berniera, K.C. McDonalb, and J. Poulina
a: INRS, Centre Eau Terre Environnement
b: CUNY Environmental Crossroads Initiative and CREST Institute
KEY WORDS: Passive Microwave, Freeze-Thaw, Frozen Soil, SMOS, Remote Sensing
ABSTRACT:
Seasonal terrestrial Freeze/Thaw cycle in Northern Quebec Tundra (Nunavik) was determined and evaluated with passive microwave observations. SMOS time series data were analyzed to examine seasonal variations of soil freezing, and to assess the impact of land cover on the Freeze/Thaw cycle. Furthermore, the soil freezing maps derived from SMOS observations were compared to field survey data in the region near Umiujaq. The objective is to develop algorithms to follow the seasonal cycle of freezing and thawing of the soil adapted to Canadian subarctic, a territory with a high complexity of land cover (vegetation, soil, and water bodies). Field data shows that soil freezing and thawing dates vary much spatially at the local scale in the Boreal Forest and the Tundra. The results showed a satisfactory pixel by pixel mapping for the daily soil state monitoring with a > 80% success rate with in situ data for the HH and VV polarizations, and for different land cover. The average accuracies are 80% and 84% for the soil freeze period, and soil thaw period respectively. The comparison is limited because of the small number of validation pixels.
1. INTRODUCTION
This study was conducted in the context of the NASA SMAP (Soil Moisture Active and Passive) mission to be
launched on January 31st 2015, which includes both a
Radiometer and a Synthetic Aperture Radar (SAR) operating at the L-band (1.20-1.41 GHz). This band is promising for Freeze/Thaw (F/T) monitoring. This wavelength (21 cm) penetrates well through the atmosphere, and hence the instrument probes the earth surface emissivity. SMAP have the capability to make coincident measurements of surface emission and backscatter at the L-band, and this frequency has the ability to sense the soil conditions through moderate land cover. The SMAP radiometer provides brightness
temperature (Tb) measurement at low resolution (~40 km)
from the top ~5 cm in regions having vegetation water
contents (VWC) up to ~5 kg m–2. SAR backscattering is
measured at higher resolution (~1 to 3 km). So, the radar and radiometer measurements could be combined to derive soil moisture estimates with intermediate accuracy and resolution (~9 km). The accuracy, resolution, and global coverage of the SMAP mission allow for a systematic updating of frozen ground maps and for monitoring the seasonal soil F/T cycle (Entekhabi 2014). Microwave sensors are well adapted tools to monitor the soil F/T cycle over the Boreal and Arctic regions (Kim et al. 2011; McDonald et al. 2004).
The seasonal Freeze/Thaw (F/T) cycle plays an important role in the Boreal and Arctic regions where structure, condition and distribution of vegetation are strongly regulated by environmental factors such as soil moisture and nutrient availability, permafrost, growing season length and disturbance (Lagacé, Bernier, and Gauthier 2002; Smith, Saatchi, and Randerson 2004). In these seasonally frozen environments, the growing season is determined primarily by the length of the non-frozen period. Variations in both timing of spring thaw and growing season length have a major impact on the atmospheric-terrestrial carbon exchange in Boreal regions (Frolking et al. 1996; Randerson et al. 1999; McDonald et al. 2004; Kim et al. 2011).
Microwave sensors are well adapted tools to monitor the F/T cycle over the Boreal and Arctic regions (McDonald et al. 2004; Kim et al. 2011). The frozen soil mapping can be improved by using SMAP instruments. The radiometric accuracy, the better spatial resolution, and the global coverage of SMAP will allow for a systematic updating of frozen ground maps and for monitoring the seasonal F/T cycle at a regional scale.
The main objective of this study is to develop and validate algorithms to monitor F/T over the Tundra and the Boreal Forest using available time series of passive microwave L-band data. For that purpose, data from the Soil Moisture and Ocean Salinity (SMOS) mission
The International Archives of the Photogrammetry, Remote Sensing and Spatial Information Sciences, Volume XL-1/W5, 2015 International Conference on Sensors & Models in Remote Sensing & Photogrammetry, 23–25 Nov 2015, Kish Island, Iran
This contribution has been peer-reviewed.
launched in November 2nd 2009 was used. SMOS carries a single payload, an L-Band 2D interferometric radiometer operating at 1.4 GHz or ~21 cm wavelength. Also, SMOS retrieves soil moisture over a much higher range of vegetation conditions at a spatial resolution of ~40 km with a sensing depth of ~5 cm (Kerr et al. 2001; Kerr et al. 2012). The daily SMOS data used in this project cover a period of 24 months from January 2011 to the end of December 2012.
2. STUDY ARIA and IN-SITU DATA
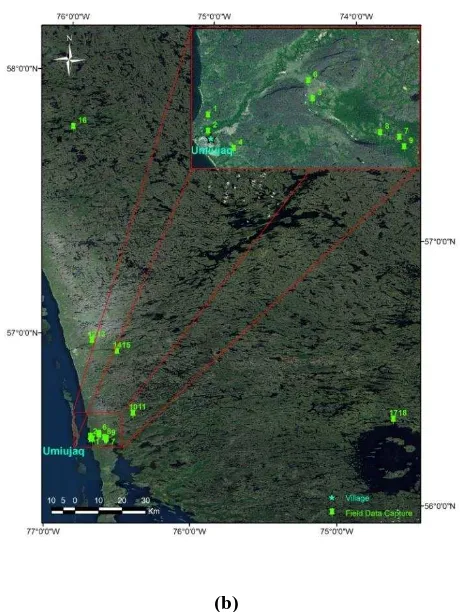
Study area located in Northern Quebec (Nunavik, Eastern Canada). It is a zone of discontinuous permafrost situated at the tree line (Figure 1-a). This region covers an area of approximately 507 000 km² and includes numerous lakes and large rivers. The experimental site is located near Umiujaq (56.55°N, 76.55°O) in Nunavik (Figure 1-b).This site has been the subject of more than 20 years of studies by the CEN. Meteorological data were obtained from two stations, one from Environment Canada and one from the Centre of Northern Studies (CEN). Furthermore, additional soil data (temperature and water content) sensors were installed near the surface of the soil in 17 stations (green dots) for diverse environments of Tundra and Taiga.
(a)
(b)
Figure 1: Map of: (a) Nunavik general land cover and location of the main villages. (b) Soil data sensors location in Umiujaq, Nunavik, Quebec.
Source: GeoGratis Adapted (http://geogratis.cgdi.gc.ca/
3. METHODS
To classify daily F/T state dynamics from SMOS Tb, the
seasonal threshold approach (STA) was adapted with the study area where we can find many lakes and rivers. The approach has capability of resolving daily F/T dynamics state and examination of the temporal progressing of the remote sensing F/T states (Kim et al. 2011).
The procedure for the selected method involves three steps. As Environment Canada has given us access to the raw data from SMOS, it was first necessary to carry out
pre-treatment to extract the Tb values of all SMOS data
for the period of 2011-01 to 2012-12. Then, extractions of data for the study area (Nunavik), format conversion, and filtering of data by the angle of incidence (39.5 and 40.5 degrees) have been done. In second step, the methodology proposed by Kim et al. (2011) has been implemented. In the last step, the accuracy of the soil freezing maps is compared with field survey data (Ts <= 0 considered frozen ground). The Agreement Factor derived from comparison of SMOS soil F/T results with daily in-situ data showed low values, which seems not to be acceptable (agreement factor varies between 36 and 64%) (Kalantari et al. 2014). The low agreement factor could be related to lack of data on soil type as well as
The International Archives of the Photogrammetry, Remote Sensing and Spatial Information Sciences, Volume XL-1/W5, 2015 International Conference on Sensors & Models in Remote Sensing & Photogrammetry, 23–25 Nov 2015, Kish Island, Iran
This contribution has been peer-reviewed.
many lakes and rivers in the region. By introducing new parameter such as lakes and ponds present in a given SMOS pixel, it is believed that more realistic estimations could be obtained.
Since water bodies causes a decrease in the Tb value of a
given pixel. Then, to eliminate error induced by water, the weighting factor (ai = P * MLRi) of the "lakes and
reservoirs" category for each pixel i was introduced in the Kim’s algorithm (2011). The slope of the linear
regression of Tb vs. water percentage (P) of the category
of the lakes and reservoirs (MLR) on the analyzed image is
always negative even in the presence of ice. The estimated slope can be used for all pixels, but must be
recalculated for each day. Then, the corrected Tb (eq.1)
was calculated per day, pixel by pixel.
Tbp = Tbp - ai (1)
Daily dynamic classification of the soil F/T state was carried out by implementing the STA approach. This approach uses a seasonal and spatial scale factor
normalization for Tb values of each day in pixel (x) and
time (t) (ΔTbp (x, t)). In this study, by using the corrected
Tb (eq.1), the approach has been adapted to the study area
(eq.2).
(2)
Tbp (x, t) (°K): corrected Tb time series derived from
SMOS sensor at pixel (x), temps (t), and polarization (p)
FrozRef(x) (ThawRef(x)) (°K): daily Tb average
values, by pixel where temperature less (more) than 0 by NNR ((NCEP- NCAR) Reanalysis)
ThawRef(x) (°K) ): daily Tb average values, by pixel
where temperature more than 0 by NNR
Then a dynamic threshold (th) was estimated pixel by
pixel using last-square linear regression of ΔTbp(x, t)
vs. NRR surface temperature that is independent variable. The dynamic threshold levels for frozen and non-frozen landscape conditions in each EASE-grid
cell were determined where ΔTbp(x, t) corresponded to
an NNR air temperature equal 0 °C. In other words:
th = T(x,t) where ΔTbp(x, t) corresponded to an T
s-NNR=0
Then, the SMOS landscape F/T status can be defined such that:
Frozen if : ΔTbp(x, t) <= th
Non-frozen if : ΔTbp(x, t) > th
The output is a dimensionless DEM binary state variable designated by zero (0) for frozen and one (1) for non-frozen conditions for each pixel
4. RESULTS
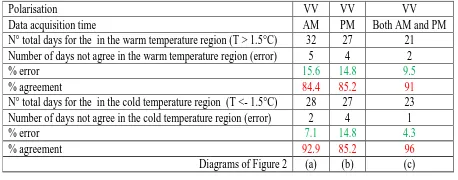
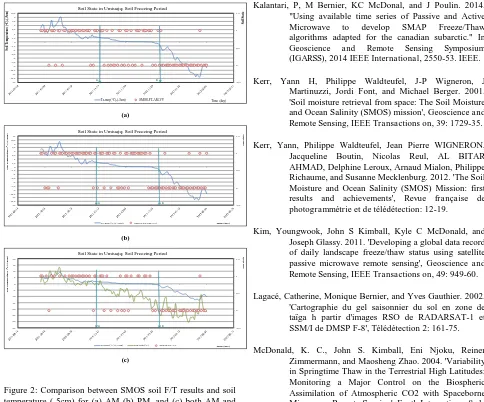
As it was mentioned above, Kim et al. (2011) developed their algorithm based on SSM/I data. Here, to verify the applicability of the algorithm for monitoring of seasonal soil freezing using SMOS images (L band), results were compared with in-situ data obtained from registering stations. Assigning two temperature limits of +1.5° (warm region) and -1.5°C (cold region) for comparison between the data measurements (blue line) and soil SMOS F/T (red small circle) results are shown in Figure 2. One can find on the diagram 2 (a) that the result of the comparison between the soil SMOS-FT-AM and the average of soil temperature. Only 5 point out of 32 (15.6%) are not in agreement with the warm temperature region, for cold region it is 2 points out of 28 (7.1%). The diagram 2 (b) shows the result for the SMOS data registered on PM time. There are only 4 points out of 27 (14.8 %) which are not in agreement with region (warm and cold temperature). Finally, according to the diagram 2 (c), the agreement between the two sets of data compared to is 91% for the warm temperature region (2 point out of 21), and 96% (1 points out of 23) for cold region. Table 1 also lists the soil F/T results derived from SMOS data for VV polarization (SMOS-FT-VV) for all the data acquisition time, and they are in good accordance with in-situ measured temperature.
Table 1: Comparison between SMOS soil F/T results and soil temperature (-5cm) for (a) AM (b) PM, and (c) both AM and PM, for a chosen period of freezing (2011-10-01 to 2012-02-01) in Umiujaq
Polarisation VV VV VV
Data acquisition time AM PM Both AM and PM N° total days for the in the warm temperature region (T > 1.5°C) 32 27 21 Number of days not agree in the warm temperature region (error) 5 4 2
% error 15.6 14.8 9.5
% agreement 84.4 85.2 91
N° total days for the in the cold temperature region (T <- 1.5°C) 28 27 23 Number of days not agree in the cold temperature region (error) 2 4 1
% error 7.1 14.8 4.3
% agreement 92.9 85.2 96
Diagrams of Figure 2 (a) (b) (c)
The results showed a satisfactory mapping pixel by pixel for the daily monitoring of the soil state (F/T) with a success rate exceeding 80% with in situ data for the HH and VV polarizations, and for different territories. The comparison is limited by the small number of validation pixels (1 site = 1 pixel). Another limitation is related to the presence of mixed pixels as the presence of open water that influences the results of soil freezing. The delay between the soil freezing and the water freezing, and also this delay in the thawing period cause errors. A passive microwave sensor with a finer spatial resolution
The International Archives of the Photogrammetry, Remote Sensing and Spatial Information Sciences, Volume XL-1/W5, 2015 International Conference on Sensors & Models in Remote Sensing & Photogrammetry, 23–25 Nov 2015, Kish Island, Iran
This contribution has been peer-reviewed.
(active microwave) would be more appropriate to solve Soil State in Umiuajq; Soil Freezing Period
Ts-moy(°C)-(-5cm) SMOS-FT-AM-VV
Soil State in Umiuajq; Soil Freezing Period
Ts-moy(°C)-(-5cm) SMOS-FT-PM-VV)
Soil State in Umiuajq; Soil Freezing Period
Ts-moy(°C)-(-5cm) Tair-min(°C) SMOS-FT-VV
A B
Figure 2: Comparison between SMOS soil F/T results and soil temperature (-5cm) for (a) AM (b) PM, and (c) both AM and PM, for a chosen period of freezing (2011-10-01 to 2012-02-01) in Umiujaq
5. CONCLUSION
The joint use of passive and active microwave data in the SMAP mission would improve the identification of the soil freezing state on the study area and achieve a better spatial resolution product. It is planned to further expand the measurement stations network of the soil freezing state in Nunavik, to improve the calibration and validation of algorithms of the SMAP mission launched in January 2015.
REFERENCES
Entekhabi, D. 2014. 'Coauthors (2014), SMAP Handbook', JPL Publication, JPL 400, 1567.
Frolking, S, M.L. Goulden, S.C. Wofsy, S.M. Fan, D.J. Sutton, J.W. Munger, A.M. Bazzaz, B.C. Daube, P.M. Crill, and J.D. Aber. 1996. 'Modelling temporal variability
in the carbon balance of a spruce/moss boreal forest', Global Change Biology, 2: 343-66.
Kalantari, P, M Bernier, KC McDonal, and J Poulin. 2014. "Using available time series of Passive and Active Microwave to develop SMAP Freeze/Thaw algorithms adapted for the canadian subarctic." In Geoscience and Remote Sensing Symposium (IGARSS), 2014 IEEE International, 2550-53. IEEE. Kerr, Yann H, Philippe Waldteufel, J-P Wigneron, J
Martinuzzi, Jordi Font, and Michael Berger. 2001. 'Soil moisture retrieval from space: The Soil Moisture and Ocean Salinity (SMOS) mission', Geoscience and Remote Sensing, IEEE Transactions on, 39: 1729-35. Kerr, Yann, Philippe Waldteufel, Jean Pierre WIGNERON,
Jacqueline Boutin, Nicolas Reul, AL BITAR AHMAD, Delphine Leroux, Arnaud Mialon, Philippe Richaume, and Susanne Mecklenburg. 2012. 'The Soil Moisture and Ocean Salinity (SMOS) Mission: first results and achievements', Revue française de photogrammétrie et de télédétection: 12-19.
Kim, Youngwook, John S Kimball, Kyle C McDonald, and Joseph Glassy. 2011. 'Developing a global data record of daily landscape freeze/thaw status using satellite passive microwave remote sensing', Geoscience and Remote Sensing, IEEE Transactions on, 49: 949-60. Lagacé, Catherine, Monique Bernier, and Yves Gauthier. 2002.
'Cartographie du gel saisonnier du sol en zone de taïga h partir d'images RSO de RADARSAT-1 et SSM/I de DMSP F-8', Télédétection 2: 161-75. McDonald, K. C., John S. Kimball, Eni Njoku, Reiner
Zimmermann, and Maosheng Zhao. 2004. 'Variability in Springtime Thaw in the Terrestrial High Latitudes: Monitoring a Major Control on the Biospheric Assimilation of Atmospheric CO2 with Spaceborne Microwave Remote Sensing', Earth Interactions, 8: 1-23.
Randerson, JT, CB Field, IY Fung, and PP Tans. 1999. 'Increases in early season ecosystem uptake explain recent changes in the seasonal cycle of atmospheric CO2 at high northern latitudes', Geophysical Research Letters, 26: 2765-68.
Smith, Nicole V, Sassan S Saatchi, and James T Randerson. 2004. 'Trends in high northern latitude soil freeze and thaw cycles from 1988 to 2002', Journal of Geophysical Research: Atmospheres (1984–2012), 109.
The International Archives of the Photogrammetry, Remote Sensing and Spatial Information Sciences, Volume XL-1/W5, 2015 International Conference on Sensors & Models in Remote Sensing & Photogrammetry, 23–25 Nov 2015, Kish Island, Iran
This contribution has been peer-reviewed.