ROBOTIC MAPPING OF CULTURAL HERITAGE SITES
Dorit Borrmann, Robin Heß, HamidReza Houshiar, Daniel Eck, Klaus Schilling, and Andreas N¨uchter
Informatics VII – Robotics and Telematics, Julius-Maximilians University W¨urzburg, Germany [email protected]
Commission V, WG V/4
KEY WORDS:laser scanning, 3D modeling, multi-sensors
ABSTRACT:
In archaeological studies the use of new technologies has moved into focus in the past years creating new challenges such as the processing of the massive amounts of data. In this paper we present steps and processes for smart 3D modelling of environments by use of the mobile robot Irma3D. A robot that is equipped with multiple sensors, most importantly a photo camera and a laser scanner, enables the automation of most of the processes, including data acquisition and registration. The robot was tested in two scenarios, Ostia Antica and the W¨urzburg Residence. The paper describes the steps for creating 3D color reconstructions of these renown cultural heritage sites.
1 INTRODUCTION
Archaeology is a historical science of high social interest. It stud-ies the human being and its legacy, such as buildings, tools and art. Cultural heritage sites can be found all over the world and they tell us the story of humanity in different areas of the world. Remote sensing has become state of the art in modeling archaeo-logical sites. This way of digitization of entire buildings or areas gives as a unique opportunity to preserve the current state of pre-historic buildings and to join forces of experts all over the world. Collecting the data is tedious work. It includes finding the best position for a laser scan, moving the equipment to the position and georeferencing of the scanning position. Letting a robotic system take over this work reduces the time spent in the field by 75 % and decreases the impact to the sites. We present the robot Irma3D, that was designed to create in a tele-operated fash-ion digital 3D models of environments. This paper describes the setup and the capabilities of the robot and the steps to create these 3D models automatically from multiple sensor sources. The en-tire process is demonstrated by means of experiments carried out at cultural heritage sites.
The robot was tested in two scenarios, Ostia Antica and the W¨urz-burg Residence Palace. In this paper we describe the data collec-tion with the robot Irma3D in these two renowned historic sites, the post-processing needed to create a full 3D color model and
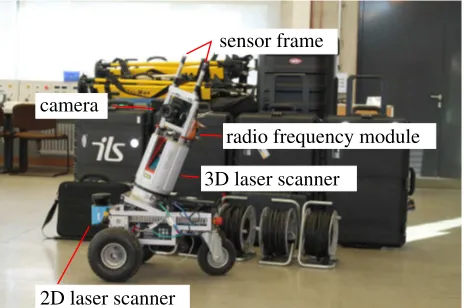
radio frequency module
camera
3D laser scanner
sensor frame
2D laser scanner
Figure 1: The Irma3D robot with the setup used in the Residence.
present the resulting models from a garden house in Ostia Antica (http://youtu.be/sf-gq5xlaIc), the White Hall (http:// youtu.be/_wPug_So_iE) and the Imperial Hall (http://youtu. be/jKVxlLvu7Pk) at the W¨urzburg Residence. The results can interactively be viewed in a 3D viewer or with an Oculus Rift (cf. Bruder et al. (2014)).
2 EXPERIMENTAL SETUP
In this section we explain the setup for robotic mapping of cul-tural heritage sites. First, we describe the environments where measurements were to be taken. Second, the hardware used in both scenarios is presented.
2.1 Cultural Heritage Sites
The robot was tested in two scenarios, Ostia Antica and the W¨urz-burg Residence. Ostia Antica is a large archeological site, close to the modern suburb of Ostia (Rome). Due to the exceptionally well preserved state of the city, Ostia is of immense interest for the study of the Roman empire. According to archeologically unverified tradition Ostia was founded during the second half of the 7th century B.C. at the mouth of the Tiber river. This region was said to be strategically important for Rome due to the there existing salt marshes. Supported by evidence is the settlement at the mouth of the Tiber as early as the beginning of the 4th century B.C. Initially only a military camp meant to defeat Rome towards the sea Ostia grew to be an autonomous harbor city of about 50 hectares with a population of approximately 50,000 in the second half of the 2nd century A.D. In the following began the decline of the city. Large parts of the town were abandoned following historical events. The last inhabitants left the city after raids of the Saracen pirates from the sea around the 9th century A.D. (Ostia Antica, 2014).
The Residence Palace in W¨urzburg Germany is a baroque palace in the city center of W¨urzburg, Germany and was labeled a UN-ESCO World Cultural Heritage site in 1981. Being built from 1720 to 1744 with the interior finished in 1780 it is now one of Europe’s most renowned baroque castles. It was laboriously re-constructed after being heavily damaged during World War II. Not destroyed during the war remained the large unsupported trough vault above the main stair-case designed by architect Bal-thasar Neumann, the Garden hall with ceiling paintings by Jo-hann Zick, the white hall with the impressive stucco work by Antonio Bossi and the Imperial hall with frescos by Giovanni Battista Tiepolo. With its large colorful paintings by the Vene-tian painter Giovanni Battista Tiepolo and fine stucco work by stuccoist Antonio Giuseppe Bossi in many of the almost 400 rooms the W¨urzburg Residence is a unique example of baroque style (W¨urzburg Residence, 2014).
Experiments were carried out in both the White hall and the Impe-rial hall, two large halls with impressive 3D structure. Together with the colorful paintings in the Imperial hall the environment can only be captured by the combination of two technologies, e.g., laser scanning and photography.
2.2 HARDWARE
The data was acquired with the mobile robot Irma3D (Intelli-gent Robot for Mapping Applications in 3D). Irma3D is a small, battery-powered, light weight three wheeled vehicle. It consists of a modified Volksbot RT 3 chassis with two front wheels. Each is actuated by an individual 150 W DC Maxon motor. The mo-tors are powerful enough to move the robot at a maximum veloc-ity of 2.2 m/s. The third wheel is in the back of the chassis and is swivel-mounted and thus completely passive as it follows the directions of the front wheels. The high-powered electrical two-wheel drive is equipped with rotary encoders to measure two-wheel rotations. This information is used to provide pose estimates of the robot via odometry. The pose estimates are improved using data from the Xsens MTi IMU device that is also attached to the robotic platform. For obstacle avoidance when moving au-tonomously a Sick LMS 100 2D laser scanner is added to the front of the robot. This sensor can also be used to improve the localization of the robot. The central sensor of Irma3D is the 3D laser scanner VZ-400 by RIEGL Measurement GmbH. The scan-ner is mounted on top of the Volksbot RT 3 chassis. Attached to the top of the scanner is a Canon 1000D DSLR camera. After a 3D scan has been acquired the camera is used to acquire color information for the point cloud.
In the W¨urzburg Residence an iSpace sensor frame is also mounted on top of the laser scanner. iSpace is a high-precision position and tracking system from Nikon Metrology (2014). The opti-cal laser based system consists of several transmitters. These are mounted on a wall or on tripods to cover the experimental area both indoors and outdoors. The rotating head of each transmit-ter emits two perpendicular fan-shaped laser beams at a unique distinguishable frequency near 40 Hz. The vertical opening an-gle of the laser beams is limited to 40 degrees and the detectable range lies between 2 to 55 meters. Several sensor frames can be located within the system. A sensor frame consists of at least one detector, a photo diode with a horizontal opening angle of 360 degrees and a vertical opening angle of 90 degrees. A small ra-dio frequency module transmits the sensor data wirelessly to the base station of the iSpace system, a PC running the iSpace control software. A sensor frame with one detector is sufficient to acquire 3D position information. To measure also the rotation and to in-crease the accuracy of the position data the sensor frame used on the robot has a total of four detectors. The iSpace system differs
from other position and tracking systems as the transmitters do not actively observe the position of the sensor frames. Instead, each sensor frame receives the laser data from the transmitters and sends the information on to the control PC. The control PC calculates the elevation and azimuth angles between all detec-tors for a sensor frame and each visible transmitter based on the received data defining a straight line between transmitter and de-tector. Given the relative transformation between the transmitters the length of the lines is calculated using triangulation. To deter-mine the position of the transmitters a calibration procedure us-ing a few hundred points from a special sensor frame is applied. An optimization process calculates the position of all transmit-ters in a self-defined coordinate system. In typical environments the iSpace system is able to perform measurements at a sampling rate of 40 Hz with a maximum error of [±0.25]mm. In practice environmental factors such as size, reflection of the surface and occlusions of the transmitters have to be taken into consideration.
3 ROBOTIC MAPPING
Scanning a large interconnected area consisting of many rooms requires a large number of scanning positions if one wants to cover the area completely without holes. In terrestrial laser scan-ning this is done by manually moving the laser scanner. To de-termine the exact position of the laser scanner for each position special targets are commonly placed in the environment whose positions are measured with a total station. Afterwards, the posi-tion of the scanner is either determined by placing another target on the tripod at the position where the scan is to be taken or by identifying the targets directly in the laser scan. This procedure is time-consuming and has to be repeated for each scanning posi-tion. The idea of using a robot for scan acquisition is to eliminate this time and thus reduce the data acquisition time. In this section we describe the methods used for creating precise 3D models of the collected data, i.e., the registration and calibration methods for bringing all the data from the various sensors into one com-mon coordinate system automatically.
3.1 Sequential scan matching
To collect data at several locations the robot is moved to a scan-ning location and stops there for data collection. In robotics re-search methods have evolved over the past years that are specifi-cally designed to register point clouds collected by a mobile robot automatically. Commonly used for this task is the Iterative Clos-est Point (ICP) algorithm (Besl and McKay, 1992). The algo-rithm takes advantage of the fact that robots usually have a rough estimate of their current pose (position and orientation). For the robot used in this paper this pose estimate is calculated from the movements measured with the rotary wheel encoders and the IMU device. Starting from such initial pose estimates the algo-rithm calculates effectively the correct transformation between two point clouds by means of minimizing distances between cor-responding points. Corcor-responding points are chosen based on Euclidean distances. The algorithm is described in Algorithm 1.
Given a registered point cloudM and a point cloudDwith an initial pose estimate the ICP first tries to find for each pointdi
Algorithm 1The ICP algorithm Require: point cloudsMandD
1: find point correspondences
2: minimize for rotationRand translationt
EICP(R,t) = 1
In practise this procedure is adopted as follows. Using the first scanning position as reference thenth scan is always registered against the(n−1)th scan. This way all scans are sequentially transformed into the same coordinate system.
3.2 Global optimization
When applying the sequential procedure small local errors for the registration of each pair add up, possibly leading to larger errors for long sequences. To overcome this issue a global optimiza-tion was proposed by Borrmann et al. (2008). Given a graph of corresponding scans point pairs are determined for each scan pair (j, k)and the new error functionEoptrequires finding transfor-mations for all scans simultaneously:
Eopt=
Methods to minimizeEoptare presented in (N¨uchter et al., 2010). The implementation used in this publication is freely available
fromThe 3D Toolkit(3DTK) (Andreas N¨uchter et al., 2014).
3.3 Acquiring initial pose estimates
ICP and the global optimization rely on initial pose estimates to determine the correct transformation between laser scans. Dif-ferent methods to acquire pose estimates are described in the fol-lowing.
3.3.1 Odometry On mobile robots pose estimates are com-monly attained from odometry. Odometry for wheeled robots such as Irma3D is based on calculating the distance traveled by the robot based on wheel rotations. For this purpose the relation between the countcof the wheel encoders and the wheel rotations are related to each other using a factorf. Knowing the diameter
dof the tires the distance traveled by one wheel is calculated as ∆s=π·d·f·c. Considering the distanceBbetween the two
The quality of these measurements depends highly on the behav-ior of the robot on the ground. If the floor is slippery and the wheels spin uncontrolled the estimates lack precision. To in-crease the precision of the position estimates the xSens IMU is attached to the robot and thus the measured accelerations are in-tegrated into the position estimates. This is especially helpful for rotations.
Odometry works sufficiently when short distances are covered and the robot follows smooth trajectories. With increasing path lengths, many rotations and frequent stops along the trajectory errors sum up.
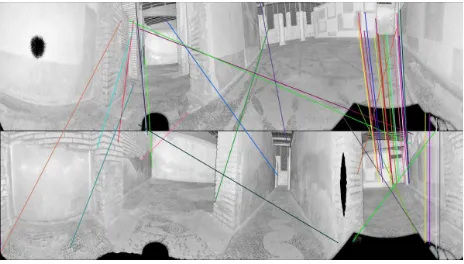
Figure 2: Illustration of a scan pair with Mercator projection and matched features from the garden house in Ostia Antica.
3.3.2 Feature-based registration If no pose estimates were acquired during data collection the remaining option is to deter-mine them directly from the data. Apart from range information modern laser scanners often capture the amount of light that is returned to the sensor. This information, known as reflectance value, can be used to detect features in the data. In terrestrial laser scanning it is common practice to attach high reflective markers to the environment and detect them in the data to register the laser scans. This procedure takes a lot of time to place the markers in good positions, find them in the data and register the data. Often times the exact positions of the markers are also measured using a tachymeter extending the time needed in the field even further. As an additional disadvantage the markers will be visible in the data thus adulterating the scene and the mapping. Alternative methods use natural features rather than manually attached markers. Con-ditioned by the buildup of the laser scanning platform the points are captured as range, reflectance and spherical coordinates. This facilitates the generation of a panorama image using the spheri-cal coordinates and the reflectance information. The 3D data is thus projected onto an image. Different projection methods are evaluated by Houshiar et al. (2012).
The panorama generation enables the use of image based feature matching methods. These methods analyze the image and create a description of areas with high changes in intensity. The most common features are SIFT (Scale invariant feature transform) features. They also show superior performance for feature-based point cloud registration (Houshiar et al., 2012). As the SIFT fea-ture detector works in gray-scale images the panorama images from reflectance values of laser scans are ideally suited for fea-ture matching. For the automatic registration of point clouds us-ing these panorama images correspondus-ing features are detected in the panorama images of scan pairs. Feature correspondences found in two reflectance panoramas are used to calculate pairwise transformation matrices of the point clouds with a RANSAC-like (Fischler and Bolles, 1981) approach. For this purpose the algorithm identifies the feature in one image that is the closest to the sampled feature from the other image based on a comparison of their descriptors (see Figure 2). Several algorithms such as the
k−nearest neighbor (KNN) search and the radius KNN search are possible solutions to this problem. The ratio nearest search as presented by Lowe (2004) has shown the most promising re-sults. The registration proceeds by testing a subset of 3 point pair matches and examining the two triangles that are defined by these points. The algorithm translates the triangles so that their centroids lie at the center of the common reference frame. The orientation that minimizes the error between the points is then computed by the closed form solution proposed by Horn (1987).
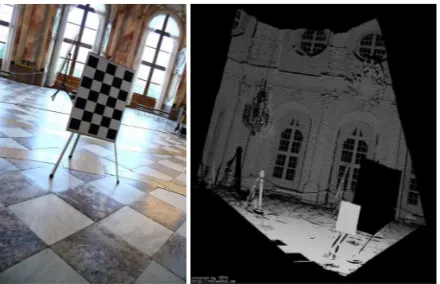
Figure 3: The calibration board seen from Irma3D in the W¨urzburg Residence as photo (left) and point cloud (right).
more detail is depicted. At the same time, however, the process-ing time for the registration increases. Therefore image size op-timization can be carried out by calculating the optimized size of the image based on the aspect ratio of the projection to reduce the extra distortion introduced by fitting a panorama image to a fixed size image (Houshiar et al., 2013).
3.4 Camera and laser scanner co-calibration
The sensors on Irma3D used for reconstruction of the environ-ment are the Riegl VZ-400 laser scanner from terrestrial laser scanning and the Canon EOS-1000 DSLR camera. The laser scanner acquires data with a field of view of360◦
×100◦
. The camera is equipped with a Canon EF-S 18-55 mm IS II zoom lens. Thus it has a much smaller opening angle. To achieve the full horizontal field of view the scanner head rotates around the vertical scanner axis when acquiring the data. We take advantage of this feature when acquiring image data. Since the camera is mounted on top of the scanner, it is also rotated. We acquire sev-eral images during one scanning process to cover the full360◦
. To avoid blurring and the problems that come from the necessity of synchronization we refrain from taking the images while scan-ning. Instead we perform a full 360◦
rotation for scanning and ro-tate back with stops at the image positions. A further advantage of this strategy is that the camera can be connected with regular USB cables because the cable is unwound after each rotation.
To join the data from the laser scanner and the camera automat-ically the two sensors have to be co-calibrated. This process is described in detail by Borrmann et al. (2012). Each sensor perceives the world in its own local coordinate system and to join the perceived information we need the specific parameters of these coordinate systems. Laser scanners are calibrated to ac-quire precise geometric coordinates. A camera has unique pa-rameters that define how a point(x, y, z)in world coordinates is projected onto the image plane. These intrinsic camera parame-ters are calculated through a process known as geometric camera calibration. Intrinsic camera calibration is typically done using a chessboard pattern because the corners are reliably detected in the images. For determining the transformation between the cam-era and the scanner coordinate system, i.e., extrinsic calibration, we attach the calibration pattern onto a board that is mounted on a tripod (cf. 3). This way the board can easily be positioned at different locations and hangs almost freely in the air facilitating the the detection of the calibration board in the point cloud data. The RANSAC algorithm (Fischler and Bolles, 1981) or the Ran-domized Hough Transform (Borrmann et al., 2011) are common methods for plane detection in point clouds. The search area is easily reduced with a simple thresholding technique leaving the board as the most prominent plane in the data. In the Residence,
the scanner was tilted when mounted onto the robot. On the one hand this enables free view of the ceiling. On the other hand, it makes removal of the floor more difficult as the scanner coordi-nate system is not aligned to the floor anymore and the distance between the board and the floor is small. This is easily overcome by searching for the two most prominent planes and removing the floor from the search results. To calculate the exact pose (posi-tion and orienta(posi-tion) of the board a plane model is generated by subsampling points on a plane with the dimensions of the calibra-tion board. This model is transformed towards the center of the detected plane facing the same direction as the plane. The model is then fitted perfectly to the data using the ICP algorithm (see Section 3.1). Since the positions of the chessboard corners on the board are known, their exact positions in 3D space can be calcu-lated from the pose of the board.
The precise transformation between scanner and camera is de-termined by acquiring several pairs of data and evaluating the reprojection error of each individual transformation. The thus calculated transformation is directly used to project the scanned points onto the camera image and color the points according to the pixel color. Due to the different fields of view of the sensors, they each perceive slightly different parts of the world. A region that is visible from one sensor might be occluded for the other sensor. When mapping the color information to the point cloud this causes wrong correspondences and therefore faulty assigned values. To solve this problem a ray tracing procedure was imple-mented that checks whether a point in the point cloud can be seen by the camera. We connect the pointPand the camera position
Cwith a straight lineP Cand select all points with a distance less than a thresholdttoP C, i.e., all pointsOifor which ible from the camera and is therefore discarded. The threshold
taccounts for small inaccuracies in the calibration. To speed up the checking procedure the points are organized in akD-tree data structure. With a quick check those voxels are immediately dis-carded that are not traversed by the ray and therefore all the points within are ignored.
3.5 Calibration of sensors for localization
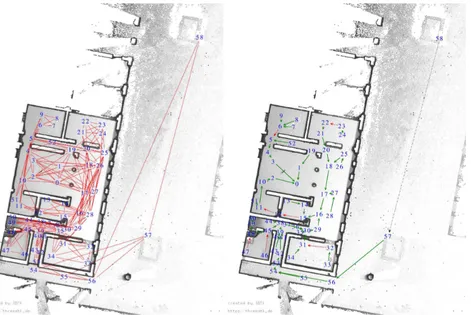
Figure 4: Floor plan of the garden house in Ostia Antica generated as an orthogonal projection of the 3D model without the protection roof. The scan positions are marked. Left: The red lines show the graph used during the global optimization of the model reconstruction. Right: The arrows indicate how the scans were registered with the feature-based registration. Green arrows with solid lines indicate the scans that were registered with the standard settings. Red dashed lines mark those pairs where a modification of the parameters was necessary. The outdoor scan pair connected with a black dotted line was not registrable at all.
system at the time the scan was taken. Additionally, the pose of the sensor frame is also recorded. In the following poses will be treated as transformation matricesT, consisting of the rotation
Rand the translation t. Repeating this procedure forn scans givesnpairs of poses for the Riegl laser scannerTr,i and the
sensor frameTm,i. From these poses the transformationTm→r between the coordinate systems is calculated as:
Tm→r,i=Tr,iT
−1
m,i. (7)
To reduce noise the averageTm→rover all transformation matri-cesTm→r,iis calculated. Afterwards, for each new scan position the position of the laser scanner in the iSpace coordinate system is calculated as:
Tr,i=Tm→rTm,i. (8)
4 EXPERIMENTAL RESULTS 4.1 Ostia Antica
Scanning took place over the course of5days. A total of59scans were acquired. Every morning scanner and camera were recali-brated to avoid inaccuracies caused by the transport. Also, the exposure time of the camera had to be adjusted according to the lighting conditions. The number of scans acquired per day are listed in Table 1. The first day was mainly used to prepare the environment for data collection. Especially the floor had to be cleaned from dust to allow for perceiving the floor mosaics. The first scans in the afternoon of day 1 were taken to check the func-tionality of all components. On day 2 the full day was reserved
Table 1: Work progress in Ostia Antica
Day 1 Day 2 Day 3 Day 4 Day 5
# scans 6 16 16 15 6
for scanning and the number of scans could be increased. On day 3 a technical defect caused a break in the data acquisition phase but the defect could be resolved and the scanning resumed. At the end of day 4 the planned parts of the garden house had been cap-tured. Day 5 was left to take some additional scans in areas that were hard to access and from the outside to complete the model.
A floor plan was created from a 2D orthogonal projection of the final model without the protection roof and is depicted in Fig-ure 4. The scan positions are marked in the floor plan. The robot coordinate system is defined by the position of the robot at the start of the robot control program. Thus, for every run the co-ordinate system is different. We tried to overcome this issue by starting the robot at the same position every day. However, the in-accurate starting position in combination with the long and curvy robot path to the first scan of the run often lead to large errors in the pose estimates causing the odometry based mapping algo-rithms to fail. The discontinuity of the path also caused problems for the sequential ICP algorithm as subsequent scans often have no overlap. Therefore, the poses were manually improved and scan pairs for matching with sufficient overlap manually chosen to create a coarse registration. Afterwards, the global optimiza-tion was applied to create the final model using the graph shown in Figure 4.
reg-Figure 5: Irma3D at the garden house in Ostia Antica.
istration process further. The floor plan was used to determine which scans should have correspondences. In Figure 4 the arrows point towards the scan each scan was registered to. Green arrows with solid lines mark the scan pairs that were successfully regis-tered with the standard parameters. Red dashed lines mark those pairs where a modification of the parameters was necessary. The registration failed for only one scan pair, the two outdoor scans which had a distance of approximately 50 m between them and therefore very little resemblance in the panorama images. Images showing the final reconstruction are shown in Figure 6
4.2 W ¨urzburg Residence
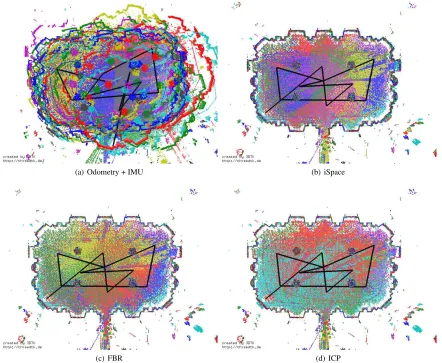
To evaluate the methods further experiments were carried out in the W¨urzburg Residence. The iSpace system was used to measure the robot position with high precision. The localization system was set up using six transmitters that were placed in the Imperial Hall as depicted in Figure 7. The robot was manually driven to 11 scanning positions. At each scanning position the position of the robot was recorded using the iSpace system. Figure 8 shows a top view of the resulting models. The scanning positions are connected by black lines. The points are color-coded based on the scanning position. Several observations can be made. First, it is obvious that the position estimates from odometry contain very large errors. Thanks to the fact that the environments consists of a single large hall it is still possible to correct the model using point-based registration. In more complex environments such as the garden house, however, the approach is likely to fail. Second, feature-based registration leads to really good results. In fact, when comparing the maps generated with iSpace measurements and FBR, the walls appear thinner for FBR, suggesting that the positions are more accurate. Third, point-based registration fur-ther improves the map quality. This can be seen by having a close look at the color distribution in the maps. Close to the individual scanning positions the density of the color of that scan becomes higher, while in the other maps the distribution is more random. This effect is the same, when comparing the results with start es-timates from different methods.
Figure 10 explains the inaccuracies in the position estimates from the iSpace system. Shown are the uncertainties in estimating the position of the robot’s sensor frame for each scanning position as calculated by the system. The high uncertainties come most likely from the reflections caused by the windows and the chan-deliers. This makes clear, that registration based solely on the iSpace system does not yield the required accuracy. A further disadvantage of the method are the transmitters that act as ob-stacles during the data acquisition. In combination with the time needed for setup this makes the system infeasible for the purpose.
The effectiveness of the ray tracing procedure is demonstrated with an examplary scan of the Imperial Hall in Figure 7(b)+(c). Especially behind the tripods and the chandeliers a lot of errors
(a)
(b)
(c)
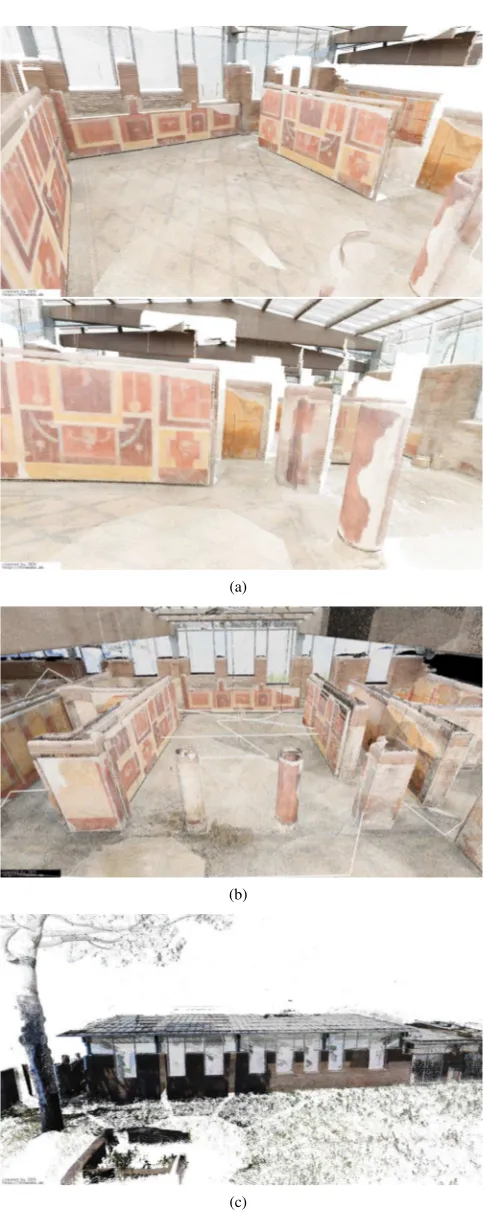
Figure 6: The model of the garden house in Ostia Antica. (a) two views of the data acquired on the first day. (b) The complete model with data from all days. The white lines mark the scanning sequence. (c) Outside view of the complete model.
(a) Irma3D (b) No raytracing (c) Raytracing
Figure 7: (a) Irma3D in the Imperial Hall of the W¨urzburg Residence during calibration. In the background is one of the transmitters for the iSpace localization system and a box with two reflective markers for the calibration procedure. (b) + (c) One scan from the Imperial Hall colored with the information from the photos without (a) and with (b) correction from using raytracing. It is obvious that the raytracing methods removes wrongly colored points.
(a) Odometry + IMU (b) iSpace
(c) FBR (d) ICP
Figure 8: Floor plan of the Imperial Hall at the W¨urzburg Residence. The reconstruction of the garden house in Ostia Antica. The black lines connect the scan positions. Poses from (a) Odometry + IMU, (b) the iSpace system, (c) feature-based registration, (d) the registration with the global ICP using FBR as initial pose estimates.
5 CONCLUSIONS AND OUTLOOK
The 3D reconstruction of cultural heritage sites is tedious work. The acquisition and registration of data from multiple data sources requires skilled personal and a lot of time to create a complete vir-tual 3D environment. In this paper we outlined steps for 3D mod-elling of environments by use of the mobile robot Irma3D. The robot collects simultaneously color images and 3D laser scans.
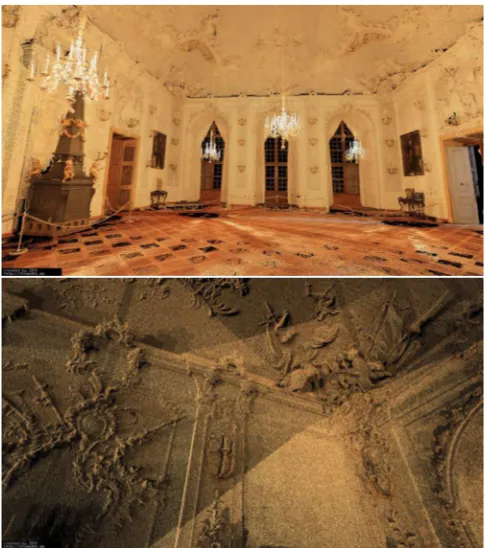
Figure 9: Reconstruction of the Imperial Hall in the W¨urzburg Residence. Visible in the hall are four of the six transmitters from the iSpace localization system.
0 2 4 6 8 10 12 14
0 2 4 6 8 10
positional uncertainty
scan no. iSpace measurements
Figure 10: Uncertainties of the pose estimates from the iSpace localization system.
Figure 11: Reconstruction of the White Hall in the W¨urzburg Residence. In the close-up view the impressive stucco work is clearly visible.
6 ACKNOWLEDGEMENTS
We are grateful to the Soprintendenza Speciale per i Beni Arche-ologici di Roma - Sede di Ostia (A. Pellegrino) and Universit`a Sapienza di Roma (S. Falzone) for the work permit and the co-ordination at Ostia Antica and to the Bayerische Verwaltung der staatlichen Schl¨osser, G¨arten und Seen for access to the W¨urzburg Residence. We would like to thank Jan Elseberg, Norbert Zim-mermann and Irmengard Mayer for their help with the experi-ments in Ostia Antica.
References
Andreas N ¨uchter et al., 2014. 3DTK – The 3D Toolkit. Webpage.http: //www.threedtk.de.
Besl, P. J. and McKay, N. D., 1992. A Method for Registration of 3-D Shapes. IEEE Transactions on Pattern Analysis and Machine Intelligence 14(2), pp. 239 – 256.
Borrmann, D., Afzal, H., Elseberg, J. and N ¨uchter, A., 2012. Mutual Calibration for 3D Thermal Mapping. In: Proceedings of the 10th Sym-posium on Robot Control (SYROCO), Dubrovnik, Croatia.
Borrmann, D., Elseberg, J., Lingemann, K. and N ¨uchter, A., 2011. The 3D Hough Transform for Plane Detection in Point Clouds – A Review and a new Accumulator Design. 3D Research.
Borrmann, D., Elseberg, J., Lingemann, K., N ¨uchter, A. and Hertzberg, J., 2008. Globally consistent 3d mapping with scan matching. Robotics and Autonomous Systems 56(2), pp. 130 – 142.
Bruder, G., Steinicke, F. and N ¨uchter, A., 2014. Immersive Point Cloud Virtual Environments. In: Proceedings of IEEE Symposium on 3D User Interfaces 3DUI Proceedings of IEEE Symposium on 3D User Interfaces (3DUI ’14), pp. 161–162. Poster.
Elseberg, J., Borrmann, D. and N ¨uchter, A., 2012. Automatic and Full Calibration of Mobile Laser Scanning Systems. In: Proceedings of the 13th International Symposium of Experimental Robotics (ISER ’12), Vol. 79, Springer Tracts in Advanced Robotics, Quebec City, Canada.
Fischler, M. A. and Bolles, R. C., 1981. Random Sample Consensus: A Paradigm for Model Fitting with Applications to Image Analysis and Automated Cartography. Communications of the ACM 24, pp. 381 – 395.
Horn, B. K. P., 1987. Closed–form Solution of Absolute Orientation using Unit Quaternions. Journal of the Optical Society of America A 4(4), pp. 629 – 642.
Houshiar, H., Elseberg, J., Borrmann, D. and N ¨uchter, A., 2012. A Study of Projections for Key Point Based Registration of Panoramic Terrestrial 3D Laser Scans. Journal of Geo-spatial Information Science.
Houshiar, H., Elseberg, J., Borrmann, D. and N ¨uchter, A., 2013. Panorama based point cloud reduction and registration. In: Proceedings of the 16th IEEE International Conference on Advanced Robotics (ICAR ’13), Montevideo, Urugauy.
Lowe, D. G., 2004. Distinctive Image Features from Scale-invariant Key-points. International Journal of Computer Vision.
Nikon Metrology, 2014. iSpace – Portable Metrology System User Man-ual and Startup Guide. Webpage.http://www.nikonmetrology.com.
N ¨uchter, A., Elseberg, J., Schneider, P. and Paulus, D., 2010. Study of Parameterizations for the Rigid Body Transformations of The Scan Reg-istration Problem. Journal Computer Vision and Image Understanding (CVIU) 114(8), pp. 963–980.
Ostia Antica, 2014. SOPRINTENDENZA SPECIALE PER I BENI ARCHEOLOGICI DI ROMA – SEDE DI OSTIA. Webpage. http: //www.ostiaantica.beniculturali.it.