THE TRANSFORMATION FROM GREEN TO CONCRETE CITIES; A REMOTE SENSING
PERSPECTIVE
F.N. Karanja a, *, S. Matara a
a
Department of Geospatial and Space Technology, University of Nairobi, Kenya - (faithkaranja, matara)@uonbi.ac.ke
Commission VI, WG VI/4
KEY WORDS: Green Cities, Concrete Cities, Remote Sensing, Google Earth, GeoEye, Transformation Analysis
ABSTRACT:
Cities especially in developing countries have been experiencing dramatic transformation as a result of rapid urbanization. For instance, the rate of urbanization in Kenya since independence in 1963 is estimated at 5%. The urban population has risen from 8% at independence to the current figure of 34% (2012). With this trend it is projected that about 50% of the population will be urbanized by the year 2030. The consequence of this is that, cities that were originally regarded as green are gradually being transformed into concrete. This transformation involves largely direct changes in land-use, where areas originally covered by vegetation are now built up. Urban authorities are under increased pressure to cope with the complex dynamics of the demands of the growing population. This paper explores the contribution of Remote Sensing in transformation analysis by proposing a three dimensional approach that endeavours to address the questions regarding to why, what and how. The „why‟ refers to the drivers of transformation, „what‟ the consequences thereof whereas „how‟ focuses on the options the authorities can explore in dealing with the challenges brought about by these changes. Temporal GeoEye images from Google Earth for five epochs namely 2002, 2004, 2007, 2008 and 2012 have been used to show the transformation trend from green to concrete. Upper Hill Area in Nairobi in Kenya has been used to demonstrate this concept and the results obtained have revealed a consistent increase in areas under concrete. Indeed the rate of increase in table 2 shows that there has been additional area under concrete between 2002 and 2004 of 0.39, 2004 and 2007 of 1.15, 2007 and 2008 of 0.74 and, 2008 and 2012 of 1.56.
* Corresponding author.
1. INTRODUCTION
1.1 Background
Most countries in the world continue to register rapid growth in the urban areas (UN, 2012). However, ill prepared authorities are often faced with serious challenges as a result of this growth. This manifests itself as a disconnect between what is planned and the reality on the ground. The major challenges associated with urban growth include inadequate housing, infrastructure and services; environmental degradation; high rates of unemployment; increasing incidences of poverty and inequality. This problem is exacerbated by lack of appropriate information highlighting the magnitude of the problem as well as a co-ordination framework of the concerned government departments and other actors. The complex nature of urban areas requires an innovative approach if they are to be managed efficiently. Evidently, the success of such an approach will be pegged on two key factors mainly information reliability and cost effectiveness. Further, the transformation from green to concrete cities is a spatial problem and Remote Sensing lends itself as a vital source of data. Several studies have demonstrated the value of using remote sensing for instance (Blaschke, 2010, Matkav et.al., 2005). This paper focuses on the use of Remote Sensing, with specific emphasis on Google Earth products namely the GeoEye.
1.2 Use of open source data from Google Earth
In order to address the cost dimension of data, use of open source high spatial resolution satellite data specifically GeoEye sourced from Google Earth is explored. Google Earth has successfully been applied in many studies for instance disaster and crisis-management (Voigt, et. al., 2007), investigating the influence of land use on urbanization (Jusuf, et. al., 2009), the use of crowd sourcing to improve global land cover (Fritz, et. al., 2009), validation of remote sensing derived products like the European forest cover map (Pekkarinen, 2009) among others. In this study, the advantage of using Google Earth lies in the fact that historical data is also available useful for transformation trend analysis.
2. TRANSFORMATION DIMENSIONS
2.1 The Process of Transformation
The transformation process from green to concrete areas starts from change drivers (why), consequences (what) and then how to deal with the challenges (how) as shown in figure 1. Possible drivers of change include demography, prevailing economic environment for instance demand for land, good political climate that serves as an incentive for growth as well as a good environment for business. With these forces in place, they in turn lead to consequences for instance demand for housing, infrastructure and utility services, high rates of unemployment and environmental degradation. In order for the government of the day to deal with these challenges, a participatory approach is International Archives of the Photogrammetry, Remote Sensing and Spatial Information Sciences,
Volume XL-1/W1, ISPRS Hannover Workshop 2013, 21 – 24 May 2013, Hannover, Germany
necessary. This is due to the fact that transformation of this magnitude tends to affect people differently and their views need to be considered.
Figure 1. Transformation Dimensions
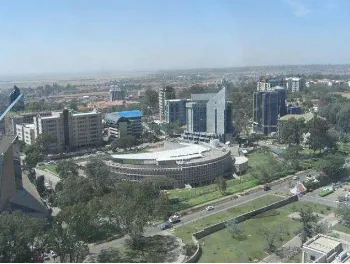
For the purpose of this study, green areas are those not built and are largely covered by vegetation, whereas concrete areas are those covered by buildings, pavements and paved car parks. The drivers of transformation have been occasioned by congestion being experienced in the Central Business District. As a result many businesses are in search of areas outside the Central Business District where they can relocate and establish their headquarters. The factors being considered is availability and affordability of land as well as facilities. Within the context of this study Upper Hill is one such area that has attracted many blue-chip and multi-national companies. The consequence thereof is that it is slowly becoming a commercial hub housing several regional and local companies like Standard Chartered Bank, Equity Bank, The World Bank, Coca-Cola, City Bank, Pricewater Coopers, IFC among others. Figure 2 shows a panoramic view of Upper Hill.
Figure 2. Panoramic View of Upper Hill Area
The role of Remote Sensing in this study is to provide both visual and quantitative information to help explain the transformation process.
3. METHODS
This section describes the methods adopted in this study. A description of the area of study is given, data sources, data processing and the results.
3.1 Study Area
To demonstrate this concept an area in Upper Hill, Nairobi County, Kenya has been selected. The rationale for the choice of this particular area has been informed by the rapid urbanization being experienced as well as availability of data. The rapid growth is largely being influenced by big companies seeking large floor space away from the Central Business District leading to construction of commercial projects. It is approximately 4 km from the Central Business District. The
legal framework for this growth is found in the Hill Areas Zoning Plan which covers the Upper Hill and Community Areas outside the Central Business District. The main thrust of this policy document is to decongest the CBD by transferring new office space to Upper Hill, formerly characterized by low density, high income residential neighbourhood. However, the challenge in the implementation has been in lack of expansion of roads and support infrastructure not incorporated in the plan.
The area is about 5.2Km2. Figure 3 shows the study area.
Figure 3. Study Area
3.2 Data Collection
Both spatial and non-spatial data are employed in this study. Google Earth provides the temporal spatial information in form of GeoEye images for the years 2002, 2004, 2007, 2008 and 2012. The idea is to demonstrate the use of public domain resources to understand some of the complex dynamics taking place around us. Most local government institutions particularly in developing countries operate under very tight budgets and hence the need to use innovative approaches to provide indicators that would support and inform decisions.
3.3 Data Processing
Information extraction entailed visual image interpretation of those areas that are green and concrete followed by on-screen digitizing for the base year 2002. The 2002 GeoEye image formed the baseline data and enabled comparisons to be performed. For the subsequent years namely, 2004, 2007, 2008 and 2012, the areas under concrete were. The digitized datasets were saved as KML files and exported to ARCGIS for transformation analysis.
3.4 Results
3.4.1 Areas under concrete
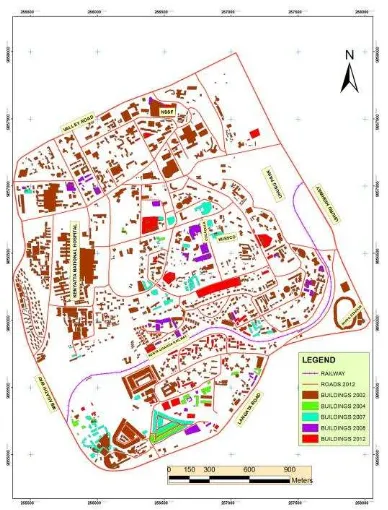
The total area covered in this study is 5.2Km2 and figure 4 shows a cumulative map of areas under concrete for the years 2002, 2004, 2007, 2008 and 2012. The year 2002 shows areas that were under concrete and hence forms the point of reference for the transformation analysis. It should be noted that, although this is a cumulative map of areas under concrete, some areas that were already built in 2002 have also been transformed in subsequent years through change of user especially from residential to commercial. Figure 5 shows an example of a House in Upper Hill on sale to pave way for such developments. This is in line with what is currently happening in the area being the newly found commercial hub within the vicinity of the Central Business District.
International Archives of the Photogrammetry, Remote Sensing and Spatial Information Sciences, Volume XL-1/W1, ISPRS Hannover Workshop 2013, 21 – 24 May 2013, Hannover, Germany
Figure 4. Cumulative Area under concrete for the years 2002, 2004, 2007, 2008, and 2012.
The year 2002 formed the base year for the study area. The objective was to investigate the transformation to concrete areas from 2002 to 2012 using Google Earth sources specifically the GeoEye. It is evident from the map, that there has been sustained increase in areas under concrete in subsequent years. Using visual interpretation, the concentration of areas built in the year 2004 was mainly towards the south of the study area whereas for the year 2007 construction was mainly in the middle and to the south as well. In the year 2008, construction was distributed throughout the study area and this is also valid for the year 2012.
Figure 5. Typical Residential House on Sale
3.4.2 Quantitative Transformation Assessment
A comparison between green and concrete areas is contained in table 1.
Table 1. Comparison of Green and Concrete Areas
Year Green Areas m2
% Green Areas
Concrete Areas m2
% Concrete
Areas 2002 4474080.00 86.04 725920.00 13.96 2004 4448383.70 85.65 751616.33 14.35 2007 4387771.30 84.50 812228.76 15.50 2008 4349316.50 83.76 850683.56 16.24 2012 4267485.30 82.20 932514.77 17.80
The quantitative results presented in table 1 are in agreement with the graphical results shown in figure 4 where green areas have consistently reduced and are being transferred into concrete areas.
The transformation from green areas to concrete specifically between 2002-2004, 2004-2007, 2007-2008, 2008-2012 and 2002-2012 is illustrated in Table 2 and figure 6. Table 2 summarizes quantitatively the areas under concrete for the five epochs, whereas figure 6 shows the same changes graphically.
Table 2.Area under concrete Year Total Area
Under Concrete m2
% Area Under Concrete
Rate of Increase %
2002 725920.00 13.96 -
2004 751616.33 14.35 0.39
2007 812228.76 15.50 1.15
2008 850683.56 16.24 0.74
2012 932514.77 17.80 1.56
From table 2, it is imperative that the area under concrete has continued to increase from the year 2002 to 2012. This is also demonstrated by figure 5. Indeed the rate of increase in table 2 shows that there has been additional area under concrete between 2002 and 2004 of 0.39, 2004 and 2007 of 1.15, 2007 and 2008 of 0.74 and, 2008 and 2012 of 1.56. Notably, between 2007 and 2008, one year difference recorded a transformation of 0.74. During this time, a number of constructions had been initiated in the area and this could explain this high increase compared to other years.
Figure 6. Areas under Concrete
This figure shows a steady increase in areas under concrete from the year 2002 and 2012.
International Archives of the Photogrammetry, Remote Sensing and Spatial Information Sciences, Volume XL-1/W1, ISPRS Hannover Workshop 2013, 21 – 24 May 2013, Hannover, Germany
3.5 Discussions of the Results
From the study it is evident that the area under concrete has steadily increased. Upper Hill area was initially zoned as a residential area comprising mainly of bungalows and Servant Quarters on quarter acre plots meant to house Government officers. Most of these bungalows were built in the 1960‟s and 1970‟s and historically it was a residential neighborhood in Nairobi during the colonial times. An increase in demand for office space by many multinational companies e.g. Coca-Cola, setting up base in Nairobi the economic hub for East and and had vegetation have now been cleared and houses built. Within the area of study there is an area that is still residential but the single units that existed originally have now been replaced by flats.
With these developments taking place, the basic infrastructure like piped water supply, sewer systems, roads and electricity are under constraint. This therefore means that the city council should expand these services because the population in the study area has increased.
Another very pertinent issue is the contribution to climate change (urban heat islands). This is an area that was initially heavily under vegetation with quite a number of trees that acted as a carbon sink, but the demand for land has resulted in felling of these trees and being replaced by concrete. Further, the carbon dioxide emitters mainly motor vehicles have increased in number in the study area due to the large number of offices. This definitely has an impact on the climate because there is much CO2 being emitted to the atmosphere. There is therefore need for planning authorities to come up with regulations that will ensure that a certain percentage of land remains under vegetation cover (trees) to check this rapid transformation.
3.6 Conclusions
This study has demonstrated that, it is possible to use available and free data source in this case Google Earth images to monitor the transformation rate of urban areas. The availability of historical images enables rate of change to be established. Spatial information is very important in not only showing the transformation but also the distribution of this transformation. For instance, in the year 2004 the transformation was mainly concentrated towards the south of the study area whereas for the year 2007 this was in the middle and to the south as well. However, it is important to ensure that the transformation does not take place at the expense of other factors like environmental concerns especially where the demand for land for purposes of office space is driven purely by market prices. It is also evident that areas originally covered by vegetation or small units like bungalows have been the target of transformation. Indeed, the current view of Upper Hill reveals a well and neatly organized array of high rise buildings belonging largely to blue chip local and multinational companies. The dynamics of this transformation into a prime office location is not without its challenges. Service availability is not aligned to the growth rate and demand.
Acknowledgement
The authors would like to acknowledge the support from the University of Nairobi, especially Department of Geospatial and Space Technology in doing this study.
References
Blaschke, T., 2010. Object based image analysis for remote sensing. ISPRS Journal of Photogrammetry and Remote Sensing, 65 (1), 2–16.
Ehrlich, D., Zeug, G., Gallego, J., Gerhardinger, A., Pesaresi, M. (2009): Quantifying the built-up stock from VHR optical satellite imagery for assessing disaster risk. ISPRS Journal of Photogrammetry and Remote Sensing.
Fritz, S., I. McCallum, C. Schill, C. Perger, R. Grillmayer, F. Achard, Kraxner, F. and Obersteiner, M. “Geo-Wiki. Org: The Use of Crowd sourcing to Improve Global Land Cover,”
Maktav, D., Erbek, F.S., and Jürgens, C., 2005. Remote sensing of urban areas. International Journal of Remote Sensing, 26 (4), 655–659.
Omwenga M. 2008. Urban Growth and Sprawl –Case Study of Nairobi, Kenya, World Urban Forum 4 03-09 November 2008, Nanjing China
Mashagbah, A. A, Al-Adamant, R. and Al-Amoush H. GIS and Remote Sensing to investigate Urban Growth in Mafrag City/Jordan between 1987 and 2010.
Nairobi City Council. "The Beautification of Nairobi City Project". nairobicity.org. Accessed, January, 2013
Netzband, M., Stefanov, W.,L., Redman, C. (2007): Applied Remote Sensing for Urban Planning, Governance and Sustainability. Springer, p. 310. ISBN-10: 3642064930
Pekkarinen, A., Reithmaier, L. and Strobl, P., “Pan-Euro- pean Forest/Non-Forest Mapping with Landsat ETM+ and CORINE Land Cover 2000 Data,” ISPRS Journal of Photogrammetry and Remote Sensing, Vol. 64, No. 2, 2009, pp. 171-183.
UN, 2011: Department of Economic and Social Affairs, Population Division (2012): World Urbanization Prospects: The 2011 Revision. New York
Voigt, S., Kemper,T., Riedlinger, R., Scholte, K. K. and Mehl, H. “Satellite Image Analysis for Disaster and Crisis -Management Support,” IEEE Transactions on Geo- science and Remote Sensing, Vol. 45, No. 6, 2007, pp. 1520-1528. ber 2012
International Archives of the Photogrammetry, Remote Sensing and Spatial Information Sciences, Volume XL-1/W1, ISPRS Hannover Workshop 2013, 21 – 24 May 2013, Hannover, Germany