A DIMENSION REDUCTION-BASED METHOD FOR CLASSIFICATION OF
HYPERSPECTRAL AND LIDAR DATA
B. Abbasi, H. Arefi, B. Bigdeli
Department of Geomatics and Surveying Eng., University of Tehran, Tehran, Iran, (abbasi.bahar, hossein.arefi, bigdeli)@ut.ac.ir
KEY WORDS: Hyperspectral Image, Lidar Data, Dimension Reduction, SVM Classification, Fusion
ABSTRACT:
The existence of various natural objects such as grass, trees, and rivers along with artificial manmade features such as buildings and roads, make it difficult to classify ground objects. Consequently using single data or simple classification approach cannot improve classification results in object identification. Also, using of a variety of data from different sensors; increase the accuracy of spatial and spectral information. In this paper, we proposed a classification algorithm on joint use of hyperspectral and Lidar (Light Detection and Ranging) data based on dimension reduction. First, some feature extraction techniques are applied to achieve more information from Lidar and hyperspectral data. Also Principal component analysis (PCA) and Minimum Noise Fraction (MNF) have been utilized to reduce the dimension of spectral features. The number of 30 features containing the most information of the hyperspectral images is considered for both PCA and MNF. In addition, Normalized Difference Vegetation Index (NDVI) has been measured to highlight the vegetation. Furthermore, the extracted features from Lidar data calculated based on relation between every pixel of data and surrounding pixels in local neighbourhood windows. The extracted features are based on the Grey Level Co-occurrence Matrix (GLCM) matrix. In second step, classification is operated in all features which obtained by MNF, PCA, NDVI and GLCM and trained by class samples. After this step, two classification maps are obtained by SVM classifier with MNF+NDVI+GLCM features and PCA+NDVI+GLCM features, respectively. Finally, the classified images are fused together to create final classification map by decision fusion based majority voting strategy.
1. INTRODUCTION
Nowadays, there are different image processing algorithms which allow us to measure diverse aspects of objects on the ground such as spectral information using hyperspectral data, height information using Lidar data and so on. Limitation of different sensors cause single sensor cannot be sufficient for a reliable classification but many problems can be solved by joint use of multiple sources of data. Recent advances in remote sensing lead to various data availability from different sensors in specific areas. In particular, the spectral information is provided from hyperspectral image and also height information is provided by Lidar data on the ground. Lidar systems produce more 3D detailed information from the earth and hyperspectral images have high spectral resolution which leads to an increase in object identification with similar spectral range on the ground. Therefore fusion of these data creates data with high spectral and spatial resolution that can identify objects (artificially and naturally) on the ground and improves classification accuracy.
The main objective of image fusion is to produce a fused image that provides the most detailed and reliable information which can be employed for image classification, object detection and target recognition. Generally, data fusion is developed in four levels: signal, pixel, features and decision level (Esteban et al, 2004; Pohl and Van Jenderen, 1998). In the signal level, the signals that recorded from objects by sensors are combined together to create signal with more information. Fusions in pixel level increase the information of each pixel in the combination of data from multiple source images. In feature level fusion different types of features are extracted from multiple data sources and then, by using the proper techniques these features are fused. Decision level fusion indicates a level of integration in which the input data is processed separately for information extraction then this information can be merged by using some
rules at the level of decision. Integration in decision level is the appropriate level to merge data from sensors with different natures. In 2013, Zhao et al. used integration of Lidar and hyperspectral data for classification with support vector machine (SVM). Firstly, they used PCA method for dimension reduction of hyperspectral bands, also they extracted features from Lidar data by using GLCM and provide features vector. In the next step, SVM-based classification was applied on these features and finally, they fused these classifiers with each other (Zhao et al, 2013). Simental et al. used fusion of Lidar and hyperspectral for separation of vegetation classes, since that the Lidar can be useful in identification of shrubs and trees (Simental et al, 2003). Lemp fused Lidar and hyperspectral data for classification of urban areas. He applied Lidar data for segmentation and hyperspectral data for classification (Lemp and Weidner, 2005). Dalponte et al. also used combination of Lidar and hyperspectral data for classification of rainforest areas. They employed a new method of classification based on use of diverse classifiers that was able to integrate several sensors information correctly (Dalponte et al, 2008).
This paper proposes a classification system for fusion of hyperspectral and Lidar data. After application of feature extraction and dimension reduction on data set, SVM-based classification system is utilized on different sets of extracted features. Finally a decision fusion strategy based on Majority Voting method try to fuse identified classes.
2. PROPOSED METHOD
In this paper, a SVM-based classification algorithm on joint use of hyperspectral and Lidar data is introduced. First, some feature extraction techniques are applied to achieve more information from Lidar and hyperspectral data. In this step, MNF and PCA have been utilized to reduce the dimension of the spectral features, respectively. Meanwhile, the NDVI has The International Archives of the Photogrammetry, Remote Sensing and Spatial Information Sciences, Volume XL-1/W5, 2015
International Conference on Sensors & Models in Remote Sensing & Photogrammetry, 23–25 Nov 2015, Kish Island, Iran
This contribution has been peer-reviewed.
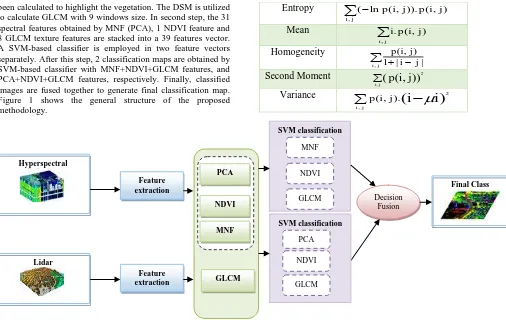
been calculated to highlight the vegetation. The DSM is utilized to calculate GLCM with 9 windows size. In second step, the 31 spectral features obtained by MNF (PCA), 1 NDVI feature and 8 GLCM texture features are stacked into a 39 features vector. A SVM-based classifier is employed in two feature vectors separately. After this step, 2 classification maps are obtained by SVM-based classifier with MNF+NDVI+GLCM features, and PCA+NDVI+GLCM features, respectively. Finally, classified images are fused together to generate final classification map. Figure 1 shows the general structure of the proposed methodology.
2.1 Dimension Reduction on Hyperspectral Image
Dimensionality reduction is an important step in most hyperspectral applications. PCA and MNF have been utilized to reduce the dimension of spectral features which can decrease the computational complexity during the classification process. 30 features containing the most information of the hyperspectral images are kept for both PCA and MNF. In addition, NDVI has been measured to highlight the vegetation.
2.2 Feature Extraction from Lidar Data
Extraction of good features from Lidar data is one of the important aims in classification process. Feature descriptors can be calculated based on the grey value relationship between every pixel of data and its surrounding pixels in a local window or in the global image. The extracted features are based on the GLCM matrix. GLCM matrix can be generated by calculating how often a pixel with intensity value i occurs horizontally adjacent to a pixel with the value j. In this way, the pixels information is considered in the GLCM matrix (Haralick et al, 1973). The features on Lidar data are represented in Table 1.
Table 1. Different types of features on Lidar data Feature’s Name Formulation
Support Vector Machine is a popular method in remote sensing data analysis due to its ability to deal with small training data. SVM is a supervised classification method which utilizes training data to allocate unknown objects to known classes. This method has been operated in all features which obtained by two groups of feature namely MNF, PCA, NDVI and GLCM. These features are trained by class samples which has been generated by IEEE 2013 contest. Generally, four types of kernel exist for the SVM classifier: Linear, Polynomial, Radial Basis Function (RBF) and Sigmoid. Here, we consider the RBF kernel because it works well in most cases. This kernel is displayed mathematically as follows:
0 controlled parameter, as its correct definition significantly increases the accuracy of the SVM solution. Gamma parameter has been considered 0.006.
2.4 Fusion of Classifiers
In this step, two classification maps are generated by SVM classifier with MNF+NDVI+GLCM features and PCA+NDVI+GLCM features, respectively. Results of each classifier are fused together to improve single classifier results. Generally, two types of classifier fusion methods exist: crisp
Figure 1. Flowchart of proposed method for fusion of hyperspectral and Lidar data PCA
NDVI
MNF
The International Archives of the Photogrammetry, Remote Sensing and Spatial Information Sciences, Volume XL-1/W5, 2015 International Conference on Sensors & Models in Remote Sensing & Photogrammetry, 23–25 Nov 2015, Kish Island, Iran
This contribution has been peer-reviewed.
The label outputs of the classifiers are given as c-dimensional
binary vectors d d T C i l
c i
i ,..., ] {0,1} , 1,...,
[ ,1 , where 1
,j i d if
i
D labels x in w , and 0 otherwise. The plurality vote will j
result in an ensemble decision for class
w
k if
L
i j i c
j L
i k
i d
d
1 , 1 1
, max
(2)
According to above equation, the majority vote give an accurate class label if at least [L/2]+1 classifiers give correct answers. If the classifiers in the ensemble are not identical accuracy, then it is reasonable to attempt to give the more component classifiers more power in making the final decision. The label outputs can be represented as degrees of support for the classes in the following way:
otherwise 0
in w x labels D if 1
{ i j
,j i
d (3)
The discriminant function for class j
w obtained through
weighted voting is:
j i L
i i j x bd
g ,
1 )
(
(4)
Where b is a coefficient for classifier i i
D (Kuncheva, 2004).
3. EXPRIMENTAL AND RESULTS
3.1 Datasets
The proposed approach was applied on two datasets. A hyperspectral image and a Lidar derived Digital Surface Model (DSM), both with spatial resolution of 2.5m. The hyperspectral image consists of 144 spectral bands with wavelength from 380 nm to 1050 nm. The data was acquired by the NSF-funded Centre for Airborne Laser Mapping (NCALM) over the University of Houston campus and the neighbouring urban areas. Two datasets are shown in Figure 2.
(a)
(b)
Figure 2.data sets: a) Hyperspectral Image, b) Lidar derived DSM
3.2 Extracted Features from Lidar and Hyperspectral Images
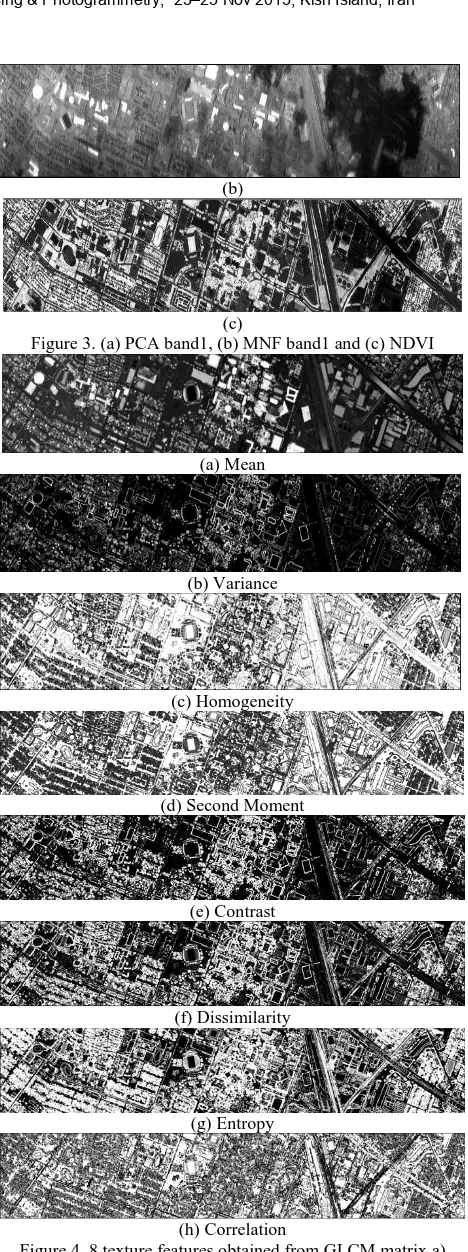
The extracted features from Lidar and hyperspectral images are represented in Figures 3 and 4. In Figure 3, first band of PCA, first band of MNF and NDVI are shown. In Figure 4, 8 texture features extracted from Lidar data based on GLCM matrix are shown.
(a)
(b)
(c)
Figure 3. (a) PCA band1, (b) MNF band1 and (c) NDVI
(a) Mean
(b) Variance
(c) Homogeneity
(d) Second Moment
(e) Contrast
(f) Dissimilarity
(g) Entropy
(h) Correlation
Figure 4. 8 texture features obtained from GLCM matrix a) Mean, b) Variance, c) Homogeneity, d) Second Moment, e)
Contrast, f) Dissimilarity, g) Entropy, h) Correlation
3.3 Fusion of SVM-based Classifiers
SVM-based classification is operated in all features which obtained by MNF, PCA, NDVI and GLCM and trained by class samples. After this step, 2 classification maps are obtained by SVM classifier with MNF+NDVI+GLCM features and The International Archives of the Photogrammetry, Remote Sensing and Spatial Information Sciences, Volume XL-1/W5, 2015
International Conference on Sensors & Models in Remote Sensing & Photogrammetry, 23–25 Nov 2015, Kish Island, Iran
This contribution has been peer-reviewed.
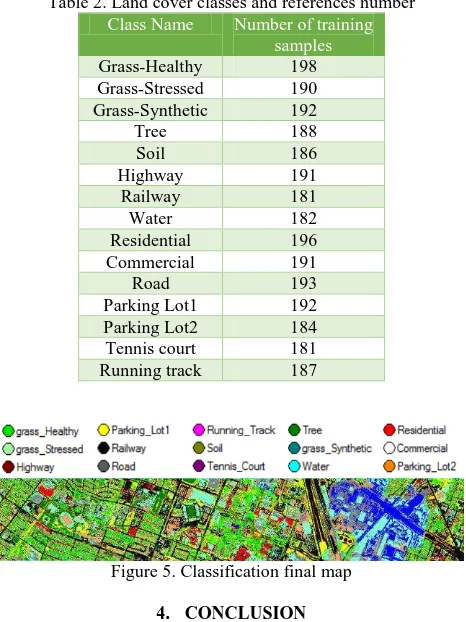
PCA+NDVI+GLCM features, respectively. This classification is obtained in 15 classes, these classes are shown in Table 2. The final classification map acquired by fusing the classification maps of two groups by majority voting. The classification results by use of our proposed method clearly demonstrate higher classification accuracy. The final classification map is shown in Figure 5
.
Table 2. Land cover classes and references number
Class Name Number of training
samples
Grass-Healthy 198
Grass-Stressed 190
Grass-Synthetic 192
Tree 188
Soil 186
Highway 191
Railway 181
Water 182
Residential 196
Commercial 191
Road 193
Parking Lot1 192
Parking Lot2 184
Tennis court 181
Running track 187
Figure 5. Classification final map
4. CONCLUSION
In this paper, the performance of the proposed method for fusion of hyperspectral and Lidar data was assessed. In first step, some features have been extracted on both datasets. Hyperspectral image has been used for spectral information and Lidar data is used to provide more detailed information from height features. In second step, SVM-based classifiers were applied on both integration of feature vectors from PCA, MNF, NDVI and GLCM. Finally, a decision fusion method based on majority voting was applied to fuse outputs of classifiers of two datasets.
Fusion of hyperspectral and Lidar data in decision level is a main aim of our proposed method. Fusion of classifiers on two datasets improve classification accuracy based on the results of our proposed method. The overall accuracy (OA) and kappa coefficient of this strategy are shown in Table 3. Based on these results, proposed classifier fusion on hyperspectral and Lidar data improve the classification accuracy.
Table 3. Results of final fusion method Overall Accuracy 88%
Kappa 0. 8668
ACKNOWLEDGEMENTS
The authors would like to thank the Hyperspectral Image Analysis group and the NSF-funded Centre for Airborne Laser
Mapping (NCALM) at the University of Houston for providing the data sets used in this study and the IEEE GRSS Data Fusion Technical Committee for organising the 2013 Data Fusion Contest.
REFERENCES
Esteban, J., Starr, A., Willetts, R., Hannah, P. and Bryanston-Cross, P. (2004), “A review of data fusion models and architectures: Towards engineering guidelines,” Journal of Neural Computing and application, 14(4), pp. 273-281.
Pohl, C. and Van Jenderen, J.L. (1998), “Review article Multisensor image fusion in remote sensing: concepts, methods and applications,” International Journal of Remote Sensing, 19(5), pp. 823-854.
Zhao, B., Zhong, Y., Zhao, J. and Zhang L. (2013), Outcome of the “Best Classification Challenge” of the 2013 IEEE GRSS Data Fusion Contest
Simental E., Ragsdale D. J., Bosch E., Dodge R., Jr., and R. Pazak,“Hyperspectral dimension reduction and elevation data for supervised image classification,” in Proc. 14th ASPRS Conf., Anchorage, AK, May 3-9, 2003.
Lemp D. and Weidner U., “Improvements of roof surface classification using hyperspectral and laser scanning data,” in Proc. ISPRS Joint Conf.: 3rd Int. Symp. Remote Sens. Data Fusion Over Urban Areas (URBAN), 5th Int. Symp. Remote Sens. Urban Areas (URS), Tempe, AZ, Mar. 14–16, 2005.
Dalponte M., Bruzzone L., Gianelle D., “Fusion of Hyperspectral and LIDAR Remote Sensing Data for Classification of Complex Forest Areas,” IEEE Trans. Geosci. Remote Sens., vol. 46, no. 5, pp. 1416–1427, May 2008.
Haralick, R., Shanmugam, K., Dinstein, I. (1973). “Textural Features for Image Classification”, IEEE Trans. on Systems, Man and Cybernetics, SMC–3(6), pp.610–621.
Kuncheva, L, 2004. Combining Pattern Classifiers methods and algorithms. A john Wiley&sons, INC. publication, Hoboken, New jersey. Canada.
Bigdeli B., Samadzadegan F. and Reinartz P., “Classifier Fusion of Hyperspectral and Lidar Remote Sensing Data for Improvement of Land Cover Classification”. International Archives of the Photogrammetry, Remote Sensing and Spatial Information Sciences, Volume XL-1/W3, 2013 SMPR 2013, 5 – 8 October 2013, Tehran, Iran.
Abbasi B., Arefi H., Bigdeli B., Motagh M., Roessner S., “Fusion of Hyperspectral and Lidar Data Based On Dimension Reduction and Maximum Likelihood”. The International Archives of the Photogrammetry, Remote Sensing and Spatial Information Sciences, Volume XL-7/W3, 2015, 36th International Symposium on Remote Sensing of Environment, 11–15 May 2015, Berlin, Germany.
Abbasi B., Arefi H., Bigdeli B., Roessner S., “Automatic Generation of Training Data for Hyperspectral Image Classification Using Support Vector Machine”. The International Archives of the Photogrammetry, Remote Sensing and Spatial Information Sciences, Volume XL-7/W3, 2015. 36th International Symposium on Remote Sensing of Environment, 11–15 May 2015, Berlin, Germany.
The International Archives of the Photogrammetry, Remote Sensing and Spatial Information Sciences, Volume XL-1/W5, 2015 International Conference on Sensors & Models in Remote Sensing & Photogrammetry, 23–25 Nov 2015, Kish Island, Iran
This contribution has been peer-reviewed.