MAPPING OF THE LAND COVER SPATIOTEMPORAL CHARACTERISTICS IN
NORTHERN RUSSIA CAUSED BY CLIMATE CHANGE
E. Panidi a, V. Tsepelev b, *, N. Torlopova c, A. Bobkov d
a Department of Cartography and Geoinformatics, Saint-Petersburg State University, Russia - [email protected], [email protected] b Meteorological Department, Russian State Hydrometeorological University, Saint-Petersburg, Russia - [email protected]
c Institute of Biology, Komi Scientific Center, Ural Branch, Russian Academy of Sciences, Syktyvkar, Russia d Department of Physical Geography and Landscape Design, Saint-Petersburg State University, Russia
KEY WORDS: Climate Change, Dynamics of Vegetation, Growing Seasons, Vegetation Indexes, NDVI, NDWI
ABSTRACT:
The study is devoted to the investigation of regional climate change in Northern Russia. Due to sparseness of the meteorological observation network in northern regions, we investigate the application capabilities of remotely sensed vegetation cover as indicator of climate change at the regional scale. In previous studies, we identified statistically significant relationship between the increase of surface air temperature and increase of the shrub vegetation productivity. We verified this relationship using ground observation data collected at the meteorological stations and Normalised Difference Vegetation Index (NDVI) data produced from Terra/MODIS satellite imagery. Additionally, we designed the technique of growing seasons separation for detailed investigation of the land cover (shrub cover) dynamics. Growing seasons are the periods when the temperature exceeds +5°C and +10°C. These periods determine the vegetation productivity conditions (i.e., conditions that allow growth of the phytomass). We have discovered that the trend signs for the surface air temperature and NDVI coincide on planes and river floodplains.
On the current stage of the study, we are working on the automated mapping technique, which allows to estimate the direction and magnitude of the climate change in Northern Russia. This technique will make it possible to extrapolate identified relationship between land cover and climate onto territories with sparse network of meteorological stations. We have produced the gridded maps of NDVI and NDWI for the test area in European part of Northern Russia covered with the shrub vegetation. Basing on these maps, we may determine the frames of growing seasons for each grid cell. It will help us to obtain gridded maps of the NDVI linear trend for growing seasons on cell-by-cell basis. The trend maps can be used as indicative maps for estimation of the climate change on the studied areas.
* Corresponding author
1. INTRODUCTION
Surface air temperature reanalysis data is widely used in many studies for climate monitoring. These data can differ significantly from actual observations in the Northern part of European Russia due to low density of the meteorological observation network. In addition, closely located geographic objects and territories that have significantly different temperature cycle may be not separated using reanalysis data, due to low spatial resolution. Reanalysis data allow to produce climate trend maps that reflect correctly only the sign of the trend, which is averaged over large areas. At the same time, trends for local areas can have the opposite sign.
Observation data with a high spatial density are required for detailed mapping of climate change. In the case of sparse ground observation network, the satellite-based remote sensing allows to produce initial data with appropriate spatial resolution. Particularly, the vegetation indexes data allow to estimate the temperature trends due to the relationships between the vegetation cover and climate. The trends obtained for vegetation indexes must be verified and then can be used to estimate the temperature trends on areas with sparse ground observations.
Number of studies have shown strong relationship between the vegetation indices dynamics and dynamics of the surface air temperature in the boreal zone of the Northern regions of
Russia (Delbart N.J-P. et al., 2005; Sekhon N.S. et al., 2010). Previous stages of our study (Bobkov A. et al., 2015; Tsepelev V. et al., 2015) demonstrated that this relationship appears more clearly for shrub vegetation cover during the spring and summer growing seasons. Obtained result was verified at the ground test plots. We concluded that the remotely sensed Normalized Difference Vegetation Index (NDVI), monitored for territories covered by shrub vegetation, can be used as an indicator of climate change.
On the current phase of the study we designed the basic approach to design of technique for automated mapping of the climate change in the Northern part of European Russia. Main purpose of this mapping is to clarify and visualize the direction of climate change on local areas. For this purpose, it is necessary also to estimate the determination correctness of the climate change sign.
We carried out a comparison of the NDVI trends at the ground test area, and the trends of air surface temperature computed using reanalysis data and ground observation data at the meteorological station.
2. METHODS AND DATA
2.1 Study Area
The ground test area is located in the middle taiga zone on the The International Archives of the Photogrammetry, Remote Sensing and Spatial Information Sciences, Volume XLI-B8, 2016
territory of Komi Republic (north-west of Russia), close to the Syktyvkar city. Approximate coordinates of the test area are the 50°50' of East longitude and 61°39' of North latitude. Also, the Syktyvkar meteorological station is located at 50°78' of East longitude and 61°68' of North latitude.
2.2 Meteorological data
We used observation data (daily averaged surface air temperature values and daily precipitation sums), which were collected at the Syktyvkar meteorological station (Bobkov A., 2015) and the reanalysis data (Kalnay E. et al., 1996). The daily averaged values were used for computation of 16-day averaged values.
2.3 Remote Sensing Data
In current study, we used the Terra/MODIS satellite imagery to produce gridded maps of the vegetation indexes. Namely, the Version 6 of MOD13Q1 (Didan K., 2015) product that incorporates NDVI 16-day averaged coverages; and the Version 6 of MOD9A1 (Vermote E., 2015) that incorporates the reflectance data needed for Normalized Difference Water Index (NDWI) computation (Gao, 1996).
Since the data of the ground meteorological observations could be unavailable and the reanalysis data bring substantial biases, then the problem of allocation of the growing season frames becomes difficult. To supply climate change mapping, we need to solve this problem having no ground observation data or having only sparse observations. In addition, there is a need of automated technique for allocation of the growing season frames, due to the large number of analyzed datasets in general case.
To solve the problem we can apply the NDWI. NDWI application for identification of the growing season frames was investigated in the number of studies (Delbart N. J-P. et al., enhanced by canopy scattering (Gao, 1996).
Different publications mention three different SWIR spectral bands as applicable for the NDWI computation, which are 1.24 μm, 1.64 μm and 2.13 μm (Sekhon N.S. et al., 2010). In our studies, we used original NDWI equation, which was described by Gao (Gao, 1996): corresponding spectral bands represented in reflectance units. We produced the NDWI gridded maps for 2000-2015 using the MOD09A1 dataset. This dataset incorporates the reflectance values for 1.24 μm spectral band in the second channel and for 0.84 μm spectral band in the fifth channel.
3. DATA PROCESSING
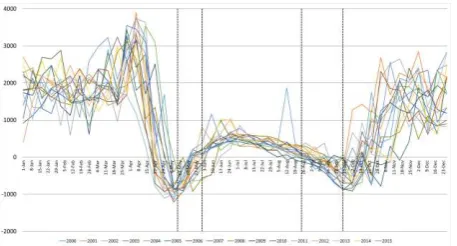
Computation technique for allocation of the beginning date of spring growing season proposed in the publications of Delbart and Sekhon (Delbart N.J-P. et al., 2005; Sekhon N.S. et al., 2010). As it shown in Delbart’s paper, the NDWI values begin to decrease with the beginning of snowmelt. Consequently, NDWI begins to increase when the leaves begin to grow after the snowmelt ending, i.e. when the summer growing season begins. These dynamics is shown on the Fig. 1.
Figure 1. 2000-2015 graphs of NDWI values averaged for shrub vegetation cover in the 10 km window centered on the Syktyvkar meteorological station. Vertical lines are the average
frames of the growing seasons computed using the ground observation data of the Syktyvkar meteorological station
We modified the abovementioned technique to provide allocation of all growing season frames (spring, summer and autumn). The data collected for our test area show that the time of NDWI transition up through the zero corresponds with the moment of daily averaged surface air temperature transition through +10°C, i.e. the beginning of the summer growing establish the consequence of growing season frames allocation as follows:
The beginning of the spring season (temperature transition up through +5°C) corresponds to the spring minimum of the NDWI graph
The ending of spring season and beginning of summer season (temperature transition up through +10°C) corresponds to the spring transition of the NDWI graph through the zero
The ending of summer and beginning of autumn season (temperature transition down through +10°C) The International Archives of the Photogrammetry, Remote Sensing and Spatial Information Sciences, Volume XLI-B8, 2016
corresponds to the autumn transition of the NDWI graph through the zero
The ending of the autumn season (temperature transition down through +5°C) corresponds to the autumn minimum of the NDWI graph
3.1 Trends
To allocate the frames of growing seasons, we used the analysis of the surface air temperature annual cycle monitored at the meteorological station (Fig. 2), NDWI annual cycle (Fig. 3) and reanalysis data (Fig. 4).
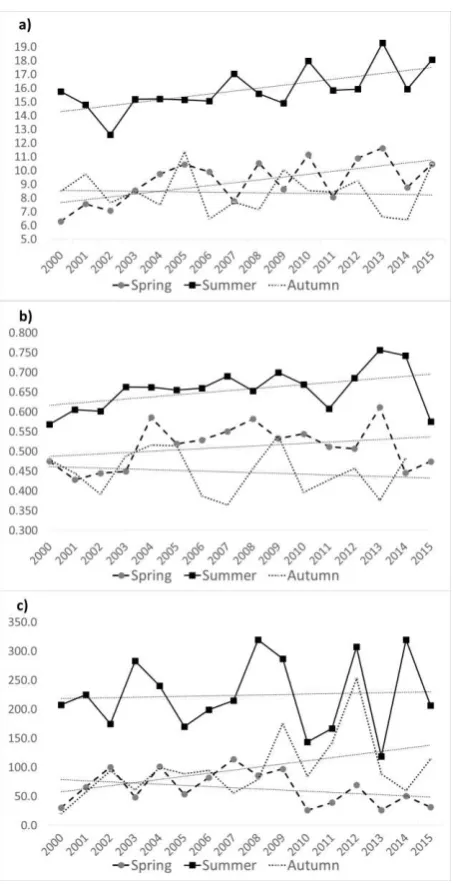
Figure 2. Trend graphs of the averaged surface air temperature (a), NDVI (b) and precipitation sums (c) for the 2000-2015 period. The trends produced for the Syktyvkar meteorological
station data using allocation of the growing season frames based on the surface air temperature observation at the
Syktyvkar station
Currently, we have used Version 6 of the MODIS NDVI data (K. Didan, 2015) instead of previously used Version 5. The seasonal NDVI graphs that were produced according to new data version differ slightly from graphs that were produced in our previous studies (Bobkov A. et al., 2015). Analysis of these graphs shows that autumn season temperature trend data coincide with NDVI trend data and could be also applicable for the study of climate change (Table 1). Conclusion about the possibility of the autumn season data use in climate monitoring can be done only after the complex analysis carried out in different natural zones.
Figure 3. Trend graphs of the averaged surface air temperature (a), NDVI (b) and precipitation sums (c) for the 2000-2015 period. The trends produced for the Syktyvkar meteorological
station data using NDWI-based allocation of the growing season frames
NDWI and NDVI values were averaged in a 10 km window centered on the meteorological station. Only shrub vegetation cover was used for this computation. The shrub vegetation cover was masked using CCI Land Cover map (Defourny P. et al., 2014). We allocated the growing season frames in each year in the period of 2000-2015.
The first group of the graphs was produced accordingly to our previous studies (Bobkov A. et al., 2015; Tsepelev V. et al., 2015) where the frames of the growing seasons were allocated as their mean calendar dates (currently, for the 2000-2015 period). Mean calendar framing dates for the growing seasons were computed in this case basing on surface air temperature values observed at Syktyvkar meteorological station.
The second group of the graphs was produced accordingly to the analysis of NDWI dynamics. NDWI values were used to determine calendar dates of the growing season frames for each year.
Figure 4. Trend graphs of the averaged surface air temperature at Syktyvkar meteorological station according to Reanalysis-1
NCEP/NCAR for the 2000-2015 period
Spring Summer Autumn TSTATION 0.15 0.10 0.13
TNDWI 0.21 0.22 -0.02
TREANALYSIS 0.36 0.12 -0.01
NDVISTATION 0.001 0.0007 0.003
NDVINDWI 0.003 0.005 -0.002
QSTATION -1.2 -0.86 3.79
QNDWI -2.01 0.79 5.37
Table 1. The coefficients of the linear trends of surface air temperature (T), NDVI and precipitation sums (Q) for growing
seasons allocated using meteorological station data (TSTATION, NDVISTATION, QSTATION), NDWI data (TNDWI, NDVINDWI,
QNDWI) and reanalysis data (TREANALYSIS)
Differences in precipitation trends are presented on these graphs, which are caused by high day-to-day variability of the precipitation. Small differences in trends are observed also for the autumn season. This can be explained by that the autumn season is short, and small variations in the season duration lead to significant deviations in the average values in the case of high temperature variability and precipitation variability. Graphs based on the reanalysis data (Fig.4) differ from observed data graphs (Fig. 2, Fig. 3) in absolute values of averaged surface air temperature for the same year. However, the same slope of trend lines is preserved. These differences in
temperature values are explained by low spatial resolution of the reanalysis data (2.5° of longitude/latitude).
Analysis of the air temperature trends produced on the base of ground observations (Fig. 2) and on the base of reanalysis data (Fig. 4) clearly shows that reanalysis data do not reflect local characteristics of the air temperature dynamics.
However, the trends of the air temperature have the same signs in both cases. Reanalysis data can be used only for trend assessment on large areas. It is necessary to involve data with higher spatial resolution to study local features of the air temperature change. The vegetation indexes can be one of such data sources.
4. DATA ANALYSIS
To estimate the accuracy of growing season frames allocation, we used annual framing dates for calculation of average season frames. The average long-term NDWI-based framing dates of the growing seasons are closer to the dates allocated on the base of meteorological observations data, than the dates allocated on the base of reanalysis data. Especially significant difference is observed for the dates of the summer season beginning (Table 2).
Standard deviations of the growing season framing dates are minimal for the dates which are determined using NDWI, and maximal for the dates determined by the meteorological station data (Table 3).
Spring Summer Autumn Meteostation May 11 June 2 August 24
NDWI May 10 June 4 August 29
Reanalysis May 11 May 11 August 30
Table 2. Average calendar dates of the beginning of growing seasons defined according to the meteorological station observations, to the NDWI data and to the reanalysis data
Spring Summer Autumn
Meteostation 13.3 14.2 12.2
NDWI 7.1 10.5 8.7
Reanalysis 10.1 25.5 10.2
Table 3. Standard deviation values of the growing season beginning dates defined according to the meteorological station
observations, to the NDWI data and to the reanalysis data
The accuracy of growing season frames allocation on the base of NDWI data is about 8 days in most cases, due to that the NDWI data is presented in the form of 8-day averaged datasets. It can be argued that the definition of the growing season case, identification of the season framing dates according to the surface air temperature observations becomes very challenging. However, this situation is usual in the Polar Regions, where we conduct our studies, and where the air temperature have high fluctuation frequency.
The correlation coefficients between the data series ground observations and NDWI presented in the Table 4 for each The International Archives of the Photogrammetry, Remote Sensing and Spatial Information Sciences, Volume XLI-B8, 2016
growing season. The series are more corresponding to each other in spring growing season. While the NDVI series have the worst agreement since the NDVI dependent complexly not only on temperature but also on precipitation and soil moisture. Correlation coefficients decrease in the summer season and become statistically insignificant in the autumn season. Weak consistency of correlation estimations obtained for the autumn season is caused by the high variability of air temperature and precipitation in autumn and short length of the season. Small changes in the definition of the autumn season frames can lead to significant changes in the values of average air temperature and precipitation sums.
SPRING QSTATION TSTATION NDVISTATION
QNDWI 0.70 -0.12 0.26
TNDWI 0.00 0.73 0.39
NDVINDWI 0.08 0.22 0.56
Summer QSTATION TSTATION NDVISTATION
QNDWI 0.60 -0.22 0.34
TNDWI 0.19 0.51 0.01
NDVINDWI 0.58 -0.37 0.60
Autumn QSTATION TSTATION NDVISTATION
QNDWI 0.92 0.03 -0.04
TNDWI 0.24 -0.19 -0.44
NDVINDWI 0.10 -0.20 0.13
Table 4. The correlation coefficients between the precipitation (Q), air temperature (T) and NDVI obtained for the growing seasons on the base of ground observations (QSTATION, TSTATION,
NDVISTATION) and NDWI data (QNDWI, TNDWI, NDVINDWI)
NDWI is differ significantly for different types of vegetation in the autumn season, due to that the coniferous forests remain green and deciduous begin to loose leaves. Therefore, NDWI does not allow to determine accurately the moisture content in the vegetation of different types, and growing season frames allocation becomes less accurate.
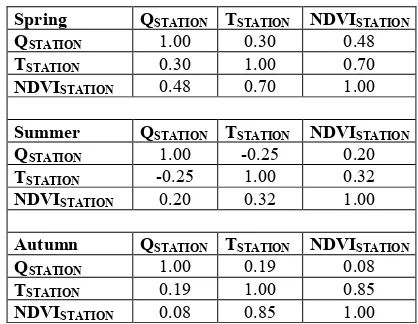
Additionally, we calculated correlation coefficients between precipitation, air temperature and NDVI averaged by seasons on the base of ground observations (Table 5) and for the data series averaged by seasons on the base of NDWI (Table 6).
Spring QSTATION TSTATION NDVISTATION
Table 5. The correlation coefficients between the precipitation (Q), air temperature (T) and NDVI obtained for the growing
seasons on the base of ground observations
Spring QNDWI TNDWI NDVINDWI
Table 6. The correlation coefficients between the precipitation (Q), air temperature (T) and NDVI obtained for the growing
seasons on the base of NDWI data
The computations were performed for each growing season. The correlation coefficients are maximal for the NDVI and air temperature. The correlation is higher in the case of season frames allocation on the base of meteorological station data.
5. CONCLUSIONS
Our study shows that the relationships between NDVI, average ground air temperature and precipitation sums averaged by growing seasons are the same in the cases of season frames observations and on the base of NDWI can be explained by that the ground observation data have 1-day time resolution, when the NDWI data have 8-day time resolution. The 8-day growing season allocation error is already embedded in the input data in this case.
Main conclusion of this study is a high accuracy of the growing season frames allocation on the base of NDWI data. Therefore, currently we have the tool for definition of the growing season frames in any location on the studied area, which makes it possible to build highly detailed maps of climate trends. Additionally it is important to note that the reanalysis data, which is widely used for computation of the climate trends, ignore the local features of the studied area. Therefore, the trends produced on the base of reanalysis data need to be clarified using the vegetation indexes data.
ACKNOWLEDGEMENTS
The study was partially supported by Russian Foundation for Basic Research (RFBR), research project No. 14-05-00858 A.
The MOD09A1 V006 and MOD13Q1 V006 datasets were retrieved from the online LP DAAC2Disk download manager, courtesy of the NASA EOSDIS Land Processes Distributed Active Archive Center (LP DAAC), USGS/Earth Resources Observation and Science (EROS) Center, Sioux Falls, South Dakota, https://lpdaac.usgs.gov/data_access/daac2disk. The International Archives of the Photogrammetry, Remote Sensing and Spatial Information Sciences, Volume XLI-B8, 2016
The Land Cover was retrieved from Land Cover CCI Product, courtesy of the ESA CCI Land Cover project, http://maps.elie.ucl.ac.be/CCI/viewer/
REFERENCES
Bobkov A., Panidi E., Torlopova N., Tsepelev V., 2015. NDVI dynamics of the taiga zone in connection with modern climate changes, Int. Arch. Photogramm. Remote Sens. Spatial Inf. Sci., XL-7/W3, 157-163, doi:10.5194/isprsarchives-XL-7-W3-157-2015
Defourny P., Kirches G., Brockmann C., Boettcher M., Peters M., Bontemps S., Lamarche C., Schlerf M., Santoro M., 2014. Land Cover CCI Product User Guide, Ver. 2.4, p. 87.
Delbart N.J-P., Kergoats L., Le Toan T., Lhermitte J., Picard G., 2005. Determination of Phenological Dates in Boreal Regions Using Normalized Difference Water Index. Remote Sensing of Environment, 97(1), pp. 26-38. doi:10.1016/j.rse.2005.03.011
Didan K., 2015. MOD13Q1 MODIS/Terra Vegetation Indices 16-Day L3 Global 250m SIN Grid V006. NASA EOSDIS Land Processes DAAC. doi:10.5067/MODIS/MOD13Q1.006
Gao B.C., 1996. NDWI A Normalized Difference Water Index for Remote Sensing of Vegetation Liquid Water From Space. Remote Sensing of Environment, 58(3), pp. 257-266.
Kalnay E., Kanamitsu M., Kistler R., Collins W., Deaven D., Gandin L., Iredell M., Saha S., White G., Woollen J., Zhu Y., Leetmaa A., Reynolds R., Chelliah M., Ebisuzaki W., Higgins W., Janowiak J., Mo K.C., Ropelewski C., Wang J., Jenne R., Joseph D., 1996. The NCEP/NCAR 40-year reanalysis project. Bullelin of the American Meteorological Society, 123 p.
Sekhon N.S., Hassan Q.K., Sleep R.W., 2010. A Remote Sensing Based System to Predict Early Spring Phenology Over Boreal Forest. The International Archives of the Photogrammetry, Remote Sensing and Spatial Information Sciences, Vol. XXXVIII, Part 1, 5 p.
Semenova I.G., 2015. Synoptic and Climatic Conditions of Formation of Arid Phenomena in Ukraine. Doctoral thesis, 296 p. (In Ukrainian)
Tsepelev V., Panidi E., Torlopova N., Bobkov A., 2015. Study of Climate Change at the North of European Russia Using Land Cover Data. SGEM2015 Conference Proceedings, Book 3 Vol. 2, pp. 529-536.
Vermote E., 2015. MOD09A1 MODIS/Terra Surface Reflectance 8-Day L3 Global 500m SIN Grid V006. NASA
EOSDIS Land Processes DAAC.
doi:10.5067/MODIS/MOD09A1.006
Revised April 2016