IQPC 2015 TRACK:
TREE SEPARATION AND CLASSIFICATION IN MOBILE MAPPING LIDAR DATA
Ben Gorte a , Sander Oude Elberink b, Beril Sirmacek a, Jinhu Wang a
a Dept. of Geoscience and Remote Sensing, TU Delft, the Netherlands, {b.g.h.gorte, b.sirmacek, jinhu.wang}@tudelft.nl b ITC, University of Twente, the Netherlands, [email protected]
Commission III, WG III/5
KEY WORDS: Mobile mapping systems, Lidar, Tree separation, Classification.
ABSTRACT:
The European FP7 project IQmulus yearly organizes several processing contests, where submissions are requested for novel algorithms for point cloud and other big geodata processing. This paper describes the set-up and execution of a contest having the purpose to evaluate state-of-the-art algorithms for Mobile Mapping System point clouds, in order to detect and identify (individual) trees. By the nature of MMS these are trees in the vicinity of the road network (rather than in forests). Therefore, part of the challenge is distinguishing between trees and other objects, such as buildings, street furniture, cars etc. Three submitted segmentation and classification algorithms are thus evaluated.
1. INTRODUCTION
Analysis of laser-generated point clouds for forest applications has already gained a good reputation (Hyyppä et. al, 2004) . For the purpose of forest inventories, for example, laser data are being analysed to estimate the number of trees in a forest, identify species, and estimate wood volumes. For large forest areas airborne laser scanning is the preferred data source, whereas for detailed studies at individual tree level also terrestrial laser scanning is being used.
Mobile mapping systems (MMS) typically integrate laser scanners, cameras and navigation sensors (GPS, IMU and odometers) (Kaartinen et. al, 2013) . They are mounted on cars or trucks and capture data while driving. Initiatives from various agencies and companies using different MMS equipment are currently being executed and will eventually capture the entire road network with the surrounding objects. At the same time there is an interest of municipalities and other authorities to form databases (“cadasters”) of the trees in the public space they manage. Many trees are located along streets and roads, and are therefore capture in MMS campaigns. In order to record information at the individual tree level, it is necessary to identify those individual trees in the data. This issue is, for example, addressed at boomregister.nl for the entire Netherlands.
2. TREE CLASSIFICATION AND SEPARATION CONTEST
IQmulus is a European FP7 project aiming at offering a high-volume fusion and analysis platform for geospatial point clouds, coverages and volumetric data sets. The project includes organizing IQmulus Processing Contests (IQPC). This year's contest, IQPC15, consists of three tracks:
1. Evaluation of 2d footprints automatically generated from urban LIDAR data
2. Water detection and classification on multi-source remote sensing and terrain data
3. Tree Separation and Classification on MMS point clouds This paper describes the set-up and the results of third track.
By visual inspection of MMS point clouds it is possible to identify separate trees manually, but this is obviously time consuming. The processing contest, therefore, addresses automation of this task. Two sub-tasks can be easily identified: 1. Classifying the points of an MMS pointcloud into two
classes: tree points and other points
2. Separating the tree points in a point cloud into the individual trees
The emphasis in this contest is on separation. Therefore, the primary task for participants in the contest was to separate the trees in a given point cloud that contains only tree points. In addition, participants were invited to analyse the raw MMS data, from which the tree points were extracted. The provided tree points only represent a subset of about 30 trees, but actually the number of trees in the area is much larger.
Therefore, participants who have access to classification software were challenged to identify as many tree points as possible, in addition to the ones provided, and after that separate the entire set of tree points into individual trees.
2.1 Available data
The MMS dataset is located at the campus of TU Delft in the Netherlands. It was obtained by the Fugro DRIVE-MAP system (Fig. 1). Fugro organizes the data in tiles of 25x25m2. The raw data consists of no less than 509 tiles, therefore occupying an area of about 318,000 m2
. Note that many tiles contain only very few points, and serve to fill up gaps between the other tiles (that do contain a lot of points). The total number of points is about 60 million.
time stamp, and c a class label: 5 for tree points (high vegetation) and 1 for the other points (unclassified).
Figure 1: The Fugro Drive-Map system on the road
The following datasets were ready for download:
• alltrees.las.zip (21 MB): all tree points in a single file • onlytrees.las.zip (21 MB): all tree points, organized in 26
tiles
• withtrees.las.zip (97 MB): 26 tiles containing tree points
and unclassified points
• withouttrees.las.zip (429 MB): the remaining 509-26=483 tiles that have unclassified points only.
2.2 The Challenge
The challenge of the contest was:
1. to subdivide dataset 1 or dataset 2 into as many groups as there are trees (approximately 30), and label the points accordingly.
2. to classify (re-label) unclassified points in dataset 3, or in the combined datasets 3 and 4, as tree points where appropriate, and subdivide the entire set of tree points (the given ones and the newly classified ones) by labelling the points with unique tree numbers.
2.3 The Rules
The results may be represented either in LAS files or in ASCII files (with X,Y,Z and label on each line). When using LAS for challenge 1, the label can be stored in the so-called user field. This may give a complication, however, in challenge 2 if the number of trees is larger than 255. In that case an ASCII file is perhaps more suitable, but we were open to other solutions if clearly explained.
Results were to be submitted to the track organizer by 15th of June 2015 .
The evaluation of challenge 1 is quantitative on the basis of the number of correctly labelled trees, and qualitative, by visual inspection, on how well the points are assigned to the correct trees. The result gives the initial ranking of participants. In case of a draw, challenge 2 is considered. The criteria there are largely qualitative, by visual comparison of the results with the situation in the field.
3. THE RESPONSE
Results were received from three responders. Two of those produced classification as well as segmentation results, whereas the third addressed segmentation only. The descriptions of the different methods, along with illustrations, are included below and the respondents are among the authors of this paper.
3.1 Response 1
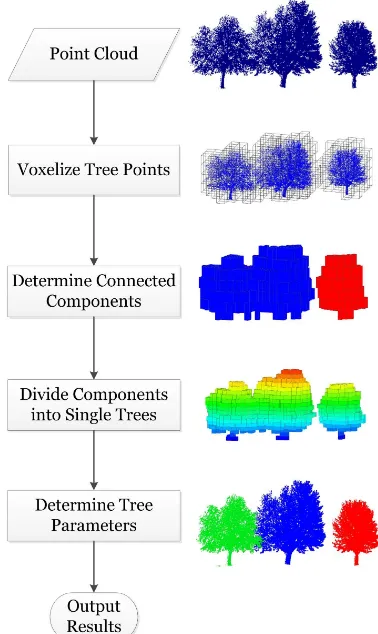
In this study an algorithm for efficient tree individualization and parameters extraction from LiDAR point clouds is presented, as summarized in Fig. 2.
Figure 2: Segmentation Methodology in Response 1
Figure 3: Tree segmentation with surroundings (response 1)
3.2 Response 2
In this study, we introduce a probability matrix computation based algorithm to classify and count individual trees in mobile laser scanning point clouds. Our method uses the 3D coordinates of the laser scanning points as input. At the first stage, it generates a new point cloud which holds a label for each point indicating if it belongs to the ’tree’ or ’non-tree’ class.
The classification is done by using a 2D probability matrix. The probability matrix is generated as a gridded plane on the x-y
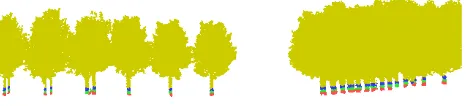
Figure 4: Classification of entire scene into tree (green) and other (red) points, in response 2.
plane of the input point cloud. Every grid cell holds the density of the point cloud within its boundaries. The probability matrix contains very high values at the tree trunk locations, but also at the locations of other vertical objects such as walls and light poles. (Sirmacek and Lindenbergh, 2015)
We apply local thresholding to extract high probability regions which could indicate trees. However after thresholding, we check the size of every segment in order to avoid false detection of walls. In this step, unfortunately false detection of pole like objects cannot be prevented.
The classification is done by assigning the value ‘1’ (‘tree’ class) to the points which are close to the segments and the value ‘0’ (‘non-tree’ class) to the rest. However some of the points receive ‘0’ value even though if they are very close to a segment, when they are the lowest point in the neighbourhood or when the highest point in the neighbourhood is not higher than a tree height threshold (2 meters in our example). This condition is set for eliminating detection of the ground pixels under the trees and dense bushes which result having high probability values despite the fact that they are very low.
Figure 5: Classification of part of the scene into tree (green) and other (red) points, in response 2.
After assigning class labels to the input point cloud, we consider only the points which are labelled as trees and we separate individual trees using information accessed from the 2D probability matrix. To do so, we pick the local maxima of the 2D probability matrix and assume that they correspond to the positions of the tree trunks. We assign random ID numbers to the local maxima locations. Afterwards each point of the 'tree' class is assigned to the closest local maxima and gets its ID number as an attribute. As result, the new point cloud contains x,y,z coordinates and an ID number for each point. If the point cloud is visualized by false colouring according to the ID values, each individual tree appears in a different colour.
Figure 6: Segmentation in response 2
Our algorithm steps can be summarized as follows;
1. Generate a probability matrix
2. Select high probability regions from the probability matrix by local thresholding. If the areas are not larger than the given tree diameter size, assigning the closest points into the 'tree' class. 3. Select maxima of the probability matrix (which indicate possible positions of tree trunks) and give a random ID number to each maxima position.
4. Generate a new point cloud to show the individual trees, picking each point from the 'tree' class and assigning the ID of the closest maxima as an attribute.
3.3 Response 3
A way to detect trees in MLS data is shown step by step in the following sequence of figures. The input is a point cloud of only tree points, as provided by the track organizers. (Fig. 7). On this dataset, connected component labelling is performed, with a radius of 1m, using 100 nearest neighbours in 3d (Fig. 8).
Fig 7: Input tree points, colour coded according to height Where necessary the components are subdivided into individual trees by detecting whether at knee height (0.5-1 meter above the lowest point in the component) there are multiple segments (Oude Elberink and Kemboi, 2014). For components with multiple seeds at knee height we perform an upward & downward growing algorithm to try to assign the correct points to each of the growing seeds (Fig. 10).
Figure 8: Result after connected component analysis: 13 connected components (response 3)
If within one iteration a point can be assigned to two or more segments, it is assigned to the one with the mean position closest to the point. For counting the number of trees, we do not need to assign all points to trees, we can just stop as soon as we have all the seed points at knee height. However, as we have to assign the points anyway, we just grow the seeds.
Figure 9: Points labeled by height above lowest points. Below 0.5 m (red), below 1 meter (green),
below 1.5 m (blue), others (yellow).
Some points have not been assigned yet, so a majority filter is applied. The result is in Fig. 11. Some more screen shots are shown in Fig. 12. Occasionally, points are incorrectly labelled, as shown in Fig. 13.
Figure 10: Components with multiple trees, after “upward growing” (left) and after “downward growing” (right).
Figure 11: Segmentation result after majority filter (response 3)
Figure 12: Segmentation details (response 3)
For airborne laser datasets we have the option to detect local maxima and grow downwards from there. For MLS data is makes more sense to detect stems instead of tree tops.
Classification
The steps of the classification procedure of respondent 3 are as follows.
Step 1 consists of detecting ground segments. Attribute calculation, height above local lowest point (Fig. 14).
Figure 14: Ground points (green) and heights of other points (yellow and red)
In Step 2 the ground points (Fig. 15) are removed and the remaining points are submitted to constrained connected component labelling (Fig. 16). The constraint is that points are only grouped if their height above local lowest point is within 15 cm of the mean of the growing component. Next, it is checked which of the segments belong to the terrain (median value of all heights above local lowest points <15 cm).
Step 3 is separation of components with multiple parts at knee height (as explained in the segmentation section above). In this step individual trees, but also connected building elements, traffic signs, cars, etc. all get unique labels (Fig. 17 and 18, showing results at two different parts of the scene).
Figure 15: Ground points only
Figure 16: Constrained connected component labeling
Fig 17. Final result after segmentation (response 3) (I)
4. EVALUATION
Within the three responses that were obtained in this IQPC2015 track, the first was addressing tree segmentation only, whereas the second, in addition, considered classification of lidar points between trees and non-trees. The third respondent in fact provides a segmentation algorithm that separates a point cloud into all sorts of segments, including trees, without assigning class labels explicitly, however.
It is interesting to see that the three approaches to segmentation are entirely different, using a 3d grid (voxel) approach, a 2d grid (probability matrix) and 3d vector connected components, respectively. The grid approaches (both 2d and 3d) are apparently designed, at least partially, for the purpose of obtaining high processing speeds. Personal communication with the first two respondents revealed that they are working together in an attempt to process MMS at 50 km/hour (which has not yet been achieved, however). The third author reports much slower performances, but stresses that no attempts to optimization have been made yet.
It appears that using the voxel approach in response 1 good segmentation results can be achieved in the pre-classified (trees-only) dataset. An important difference between the approaches of 2 and 3 is the processing direction: top-down (literally, through the tree) vs. bottom-up. For respondent 3 this is a deliberate choice for MMS (as opposed to ALS), and it seems to be right: usually a tree has only one minimum (the trunk) at the bottom, but it may have several maxima (protruding branches) at the top, which would seem to subdivide the tree.
The grid-based classification approach looks promising, but thresholding does not yet sufficiently separate trees from other landscape elements having high 2d probabilities, such as lamp post and (sometimes) walls. The approach is currently being extended using 3d Principal Component Analysis (PCA) at high-probability grid cells.
The Constraint Connected Component Labelling approach (response 3) appears to provide superior segmentation results for different object classes simultaneously; however it does not distinguish between classes; therefore trees can only be counted in pre-classified tree-only datasets. Moreover, optimization is required before realistically sized datasets can be processed.
5. CONCLUSION
With three submissions the response to this track of IQPC15 was quite limited, and it might not provide a representative sample of the developments in the field.
However, the results shown are promising and it seems likely that they can be considered to represent the state-of-the-art in tree classification and separation. The diversity of approaches suggests that the field is still developing. One would expect to eventually arrive at a 'preferred' approach, perhaps depending on the input data (but the relation between the data and the approach would be clear). This stage has not yet been reached. Moreover, both the quality of the results and the speed of operation are still important concerns.
This track of IQPC15 was not fully executed: a performance test, by running the algorithms in a standardized computing environment, is missing. It would not have added much, as the three approaches are fundamentally different and partly not implemented with performance in mind. At a certain point in the developments the issue does become relevant, though.
Although perhaps to the disappointment of the reader, we are not ready to proclaim a winner amongst the three submissions.
ACKNOWLEDGEMENT
This research is partly funded by the FP7 project IQmulus (FP7-ICT-2011-318787) on the design and implementation of a high volume fusion and analysis platform for geospatial point clouds, coverages and volumetric data sets.
REFERENCES
Hyyppä, Juha, Hannu Hyyppä, Paula Litkey, Xiaowei Yu, Henrik Haggrén, Petri Rönnholm, Ulla Pyysalo, Juho Pitkänen, and Matti Maltamo (2004_. Algorithms and methods of airborne laser scanning for forest measurements, ASPRS 36, no. 8: pp. 82-89.
Kaartinen, H., Hyyppa, J., Kukko, A., Lehtomaki, M., Jaakkola, A., Vosselman, G., Oude Elberink, S.J., Rutzinger, M., Pu; Vaaja,N. (2013) Mobile mapping: road environment mapping using mobile laser scanning, European Spatial Data Research, Official Publication no. 62, pp. 49-95.
Oude Elberink, S.J. and Kemboi, B.J. (2014) User-assisted Object Detection by Segment Based Similarity Measures in Mobile Laser Scanner Data. In: ISPRS Technical Commission III / WG III/2 Symposium proceedings, 5-9 September, 2014, Zurich Switzerland. ISPRS Archives, Vol. XL-3. pp. 239-246. Sirmacek, B.and R. Lindenbergh (2015) Automatic classification of trees from LASER scanning point clouds, ISPRS