OVERVIEW OF 3D DOCUMENTATION DATA AND TOOLS AVAILABLE FOR
ARCHAEOLOGICAL RESEARCHES: CASE STUDY OF THE ROMANESQUE CHURCH
OF DUGNY-SUR-MEUSE (FRANCE)
H. Macher a, P. Grussenmeyer a,*, C. Kraemer b, S. Guillemin a
a
Photogrammetry and Geomatics Group, ICube Laboratory UMR 7357, INSA Strasbourg, France (helene.macher, pierre.grussenmeyer, samuel.guillemin)@insa-strasbourg.fr
b
Pôle Archéologique Universitaire, HISCANT-MA-EA 1132, University of Lorraine, Nancy, France [email protected]
Session C-3: Modeling methods for architecture and archaeology
KEY WORDS: Cultural Heritage, Church, Documentation, Recording, Terrestrial, Photogrammetry, Laser Scanning, Image Unwrapping.
ABSTRACT:
In this paper, the 3D documentation of the full structure of the Romanesque church of Dugny-sur-Meuse is discussed. In 2012 and 2013, a 3D recording project was carried out under the supervision of the Photogrammetry and Geomatics Research Group from INSA Strasbourg (France) in cooperation with C. Kraemer, archaeologist from Nancy (France). The goal of the project was on one hand to propose new solutions and tools to the archaeologists in charge of the project especially for stone by stone measurements. On the other hand, a simplified 3D model was required by the local authorities for communication purposes. To achieve these goals several techniques were applied namely GNSS measurements and accurate traverse networks, photogrammetric recordings and terrestrial laser scanning acquisitions. The various acquired data are presented in this paper. Based on these data, several deliverables are also proposed. The generation of orthoimages from plane as well as cylindrical surfaces is considered. Moreover, the workflow for the creation of a 3D simplified model is also presented.
* Corresponding author
1. INTRODUCTION
The old church of Dugny-sur-Meuse in North-East of France, replaced by a more vast neo-gothic church in the second middle of the XIXth century, dates in its original shape from the second half of the XIth or the second quarter of the XIIth century. Probably built in several stages, this edifice which follows a basilical plan remains fundamentally a flagship of Romanesque architecture of rural Lorraine, despite late changes at the transept level and its fortification during the Hundred Years War. Moreover, it is for its hoardings that it is a first time mentioned in the famous reasoned dictionary of French architecture from XIth to XVIth century of the famous architect and archaeologist Eugène Viollet le Duc (Viollet le Duc, 1854-68).
Two communications were presented at French archaeological congresses in Reims in 1933 and Nancy in 1991 related to the registration of the church as Historic Monument on 28th December 1904. Two other monographs are also devoted to it in two books giving a panorama of Romanesque architecture in Lorraine (Collin, 1983, Marschall and Slotta, 1984). The significant differences of authors’ points of view considering the chronology of the original church, and the willingness of local authorities to make this disused church a cultural centre have largely motivated the recovery of the project meanwhile enriched by a significant graphic documentation which complete the plan realized in the beginning of the XXth century simultaneously with the first photographs taken by the French specialist of medieval architecture Camille Enlart. This documentation was conducted on behalf of Historical
Monument, according to an insufficient level of detail for a fine study of building archaeology.
The use of 3D scanning and photogrammetry already experimented on other archaeological sites, religious (Landes et al., 2013) or not (D’Agostino et al., 2013), is intended to fill this gap while creating documentation that may be used for patrimonial valorisation of the edifice. It also allows giving technical responses for graphical restitutions particularly for cylindrical surfaces.
A 3D recording project was carried out with students from INSA Strasbourg (France) under the supervision of the Photogrammetry and Geomatics Research Group in 2012 and 2013 to answer the needs of both the archaeologist of the site which cooperated during the project and the local authorities which supported the project.
The first aim of the project was the generation of orthoimages of plane as well as cylindrical surfaces to assist the archaeologist in further studies of the church. Orthoimages are mainly used by archaeologists for stone by stone surveys. The second aim of the project was the creation of a simplified 3D model for the local authorities for communication purposes.
In order to achieve these goals, different types of measurement technologies were considered: GNSS measurements and accurate traverse networks setup, terrestrial laser scanning (TLS) surveys and photogrammetric recordings. Our group is used to merge several techniques in the field of cultural heritage modelling (Grussenmeyer et al., 2012).
In this paper, the different deliverables for structure study and conservation of historical buildings are listed in a related work section. Then the site under study and the different acquired data are presented. Finally, the creation processes of several 2D and 3D deliverables, namely orthoimages of plane surfaces and cylindrical surfaces and a 3D simplified model, are described.
2. RELATED WORK
Several deliverables can be considered for the structure study and the conservation of cultural heritage buildings. First of all, 3D models can be created based on point clouds. These models are either geometric models or meshed models. When the considered surface is complex and irregular and the level of details required is high, a meshed model is used. Schueremans and Van Genechten (2009) used a meshed model for the assessment of the safety of masonry vaults of Saint-Jacobs church for example. Meshed models are very faithful to the reality but associated files require a large volume of storage. For buildings constituted by geometric shapes (planes, cones, cylinders, etc.), geometric models are used. This type of models is lighter. Each element of the considered building is described by a geometric primitive through a segmentation process. Then, either the primitives are intersected between them or a boundary extraction is performed to obtain a wire-frame model (Macher et al., 2014).
Hybrid models constitute a compromise between geometric models and meshed model. In this type of models, complex parts are meshed whereas continuous areas are modelled by geometric primitives or polylines. Kersten and Lindstaedt (2012) proposed an hybrid model of the imperial cathedral of Königslutter (Germany) composed by a CAD model and meshed models of small complex objects.
Based on point clouds, 2D deliverables can also be created. Sectional views of churches are often considered for archaeological purposes (Soria-Medina et al., 2013). Landes et al. (2013) propose a semi-automatic method of sectional view creation based on boundary extraction of geometric primitives. Orthoimages constitute also a 2D deliverable used to study the structure of historical buildings and determine the different steps of their construction. This study is achieved particularly through stone by stone surveys (Drap et al., 2000). As mentioned by (Hemmleb and Wiedemann, 1997), regarding the type of surface, different methods can be applied to generate orthoimages. If the considered surface is a plane, a projective rectification is performed. It consists in determining coefficients, which link the image plane and the projective plane thanks to control points.
Digital unwrapping techniques can be applied to parametric surfaces such as cylinders and cones (Karras et al., 1996, Theodoropoulou et al., 2001, Hemmleb and Wiedemann, 1997, Meyer et al., 2004). Numerous architectural elements are described by such surfaces as for example towers, columns or vaults.
Considering undevelopable surfaces, different cases can be considered. For irregular surfaces, a polynomial transformation can be applied. The number of control points required and the risk of oscillations increase with the degree of the polynomial. For spherical surfaces, (Guerra and Miniutti, 2000) explore cartographic projections offered by the Mapping Toolbox of Matlab. The choice of the projection depends on the needs. For example, Karras et al. (1997) advise an equivalent transformation for surface measurements. For more complex surfaces, differential rectification methods are used. These methods are widely used in aerial photogrammetry but rarely in architectural photogrammetry.
3. SITE UNDER STUDY
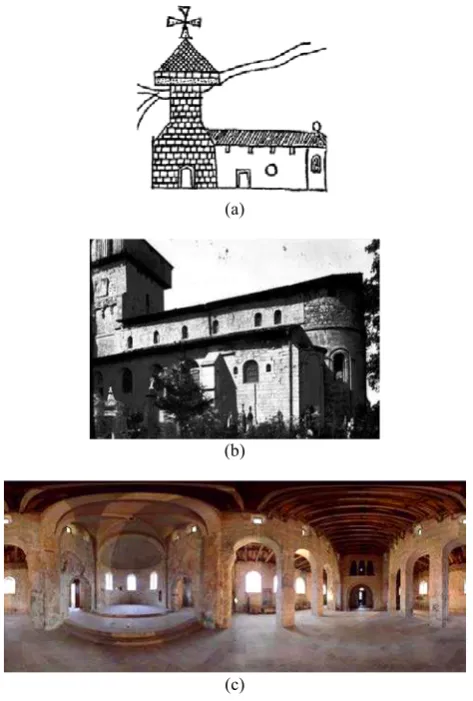
The village of Dugny is situated seven kilometres south of Verdun (France), on the left bank of the Meuse. The Romanesque church under study (Figure 1) located in the centre of its original habitat is dedicated to the Nativity of the Virgin. This dedication, combined with the discovery of fragments of chancel and sarcophagi from the High Middle Ages found in the same area, close to the remains of a Gallo-Roman sanctuary, argue for the existence of a former Christian worship place to the tenth century. Deconsecrated in 1870 during the construction of the neo-Gothic church nearby, the Romanesque church whose bell tower retains elements of defensive architecture attributed to the fourteenth century by Viollet-le-Duc is one of the few fortified churches yet visible in Meuse region. This church, which size is 17 by 29 m, is composed by three naves having an apparent roofing framework with four spans of 2.30 m, and two aisles; a fore choir with circular apse decorated with frescoes of the XVth century and whose elevation of at least 60 cm from the beginning, conceals the bases of square pillars; a span pursued by an apse and two apses chapel; a porch tower of 17 m height under the hoarding and 23 m under the ridge, located at west on the first span of the nave and fully integrated into its construction; finally, under the choir, a crypt corridor (Figure 2a) with a T shape covered of a barrel vault of at the most 2.35 m high and which could result from the choir elevation in a posterior phase, contemporary, perhaps, of the fortification of the church.
(a)
(b)
(c)
Figure 1. Site under study: (a) South elevation (1689); (b) Photograph of the exterior of the church (Enlart, 1904);
(c) Panorama of the interior (2013)
The state of disrepair of the choir and the apses requires, around 1618, substantial works registered in a quote preserved in the departmental archives of Moselle in the fund from the abbey of St. Vincent of Metz which is then collative of the Dugny’s Church (departmental archives of Moselle, H 2361). The tower of the choir is then raised up to levelling course of the walls of the nave. The figurative representation of the church taken from a plan of 1689 (Figure 1a; departmental archives of the Meuse, E deposit 123 DD7) confirms these changes but does not suggest the existence of collateral in front of the lateral south wall of the nave.
Other works are carried out during the XIXth century on the roof of the porch tower and its south wall. The operation is repeated in 1822 and then regularly from 1856, when the tower of the choir is levelled in the nave’s roofing plan and the walls of the aisles levelled, until a decision is made to build a new larger church for a growing community. All the other works will be carried out under the protection of the edifice classified as historical monuments in 1904. This is the case of the choir vaults and the preserved apse, restored in 1934, and in the fifties, the lower parts of the porch tower and its roofing. All these works of maintenance, repair, consolidation, fortification, which some are derived from a visual examination of the edifice, participate in its history and deserve to be analysed in a building archaeology or monumental approach, which consists in the deconstruction of the object in order to examine successively its different parts and aspects and then in the reconstruction according to a chronological scenario (Guild, 2005) and deserve beyond to be analysed in an anthropological concern of the construction, in other words in a concern of archaeology of the site (Bessac, 2005).
(a)
(b)
(c)
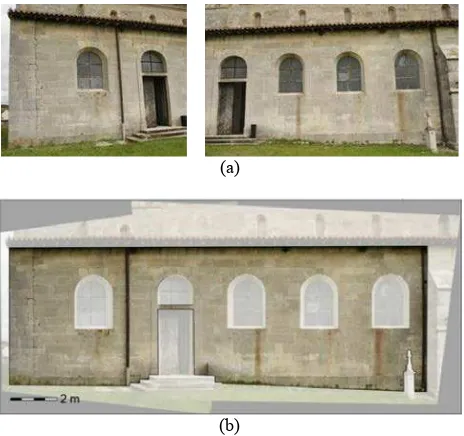
Figure 2. Existing documentation of the church (Michel Goutal, 1988): (a) longitudinal sectional view; (b) north façade;
(c) west façade
The joint use of laserscanning and photogrammetry accelerates the acquisition of data while avoiding the expensive technical constraints induced by manual survey of large surface (Sumera, 2010). Over time, this process should provide the stone by stone survey of all interior and exterior elevations, but also sectional views and plans made at different levels, reflecting the deformations of the masonry and the architectural constraints of the edifice and likely to better answer the problematics of archaeologists and other historians.
4. DATA ACQUISITION
Different types of acquisitions were carried out to document the church. They are presented in this section.
4.1 Definition of a reference framework
A reference framework was defined by geodetic GNSS measurements (Figure 3). Based on measured points, an accurate traverse measurement was carried out by the Leica TS02 total station all around the church. This traverse was notably used to survey spheres placed in the scene during the terrestrial laser scanning (TLS) acquisitions. The georeferencing of the TLS data is then performed with this survey.
Figure 3. Geodetic GNSS measurements around the church
4.2 Terrestrial laser scanning acquisitions
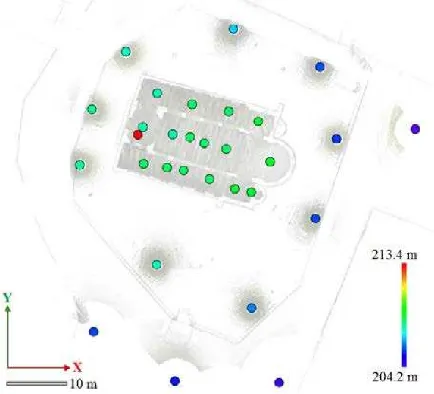
The interior and exterior of the church were scanned with the Faro Focus 3D S120 laser scanner. Figure 4 presents an overview map of the church and the locations of the scans and their heights. Spheres were placed into the scene for the registration of the point clouds in a post-processing step and some spheres were surveyed for the georeferencing of the point clouds.
Figure 4. Locations of scans in an overview map
13 scans were realized outside the church and 17 scans were realized inside the church. A density of one point every 6 mm at 10 metres was chosen except for a scan located in the centre of the church for which a density of one point every 3 mm was chosen.
To complete these scans, 3 scans were carried out by the Leica C10 scanner for the acquisition of the roofs and the porch tower. Indeed, the measuring range of this scanner of almost 300 metres is higher. A density of one point every 6 mm at 10 m was chosen. A direct georeferencing supported by the accurate traverse was used with this scanner.
Figure 5. Colorized point cloud of the church (24 million points)
Figure 5 shows the complete point cloud of the church spatially resampled at 1 cm. Based on this point cloud, it is already possible for archaeologists working on the church to study the internal and external envelopes of the church considering for example sections in the point cloud. The point cloud is a visual support as well as a measurement support but it’s not adapted for stone by stone survey. Indeed, the creation of orthoimages from the point cloud provides an insufficient resolution for it.
4.3 Photogrammetric recordings
For photogrammetric recordings, a Canon EOS 5D Mark II digital camera was used. It provides a 24 per 36 mm sensor and a pixel size in the sensor of 6,5 microns. Several lenses were used namely lenses of respectively 28 mm and 50 mm. A pixel size of approximately 5 mm was achieved on the object.
Different well-known rules were respected during the recordings. The focal length was notably kept constant during the recordings. Photographs were performed all around the church for the exterior. Two bundles were realized for the lower part and for the higher part of the church. Considering the interior of the church, photographs were realized for each subpart of the structure that is along each span of the church.
5. GENERATION OF ORTHOIMAGES
In order to study the church, orthoimages were created. The projective rectification is well known and a few tools already exist. However, a tool was developed for the generation of orthoimages of plane surfaces but also cylindrical surfaces, which are encountered for the church under study. Not only were the orthoimages used for the study of the church, but they also were used for the creation and the texturing of a simplified 3D model as mentioned here after.
5.1 Projective rectification
If the object surface describes a plane, a projective rectification is used. A geometric transformation between the image plane and the projective plane is necessary to perform this rectification. The equations for projective rectification are given as:
a1, a2,…, c2 = rectification coefficients
Control points in the object plane are required for the calculation of the eight unknown coefficients of the projective transformation. Regarding the number of unknown coefficients, a minimum of 4 control points is necessary. Well-distributed orthoimage mosaic created with 2 rectified photographs.
(a)
(b)
Figure 6. Projective rectification: (a) photographs; (b) mosaic of orthoimages
The presented mosaic (Figure 6b) was assessed by comparing distances in the mosaic and the same distances in the raw point cloud. For 40 measurements from 0 to 16 meters, almost 70% of deviations are comprised between -1 cm and 1 cm.
5.2 Unwrapping of cylindrical surfaces
Cylindrical surfaces are also encountered in the church under study as for example the choir. The creation of orthoimages of cylindrical surfaces was thus studied. For this type of surface, photographs, control points and also a point cloud of the surface are required. A surface unwrapping technique was used (Karras et al., 1996, Theodoropoulou et al., 2001).
The idea is to unwrap the considered cylindrical entity into a planar entity. Translations and rotations of the cylinder are performed so that its revolution axis coincides with the vertical axis. By using the parameters of the cylinder calculated with the point cloud, the cylinder is unwrapped as a plane.
Based on the developed point cloud, a regular grid is created. The interval between points of this grid corresponds to the pixel size in the final image and is fixed by the user. The defined grid is then rewrapped with an inverse transformation.
In order to determine the position of the grid points in the image, a Direct Linear Transformation (DLT) is used. This transformation allows moving from 3D coordinates to 2D coordinates through the following equations:
1 eleven parameters of the DLT. As previously, well-distributed
control points were selected in the raw point cloud of the considered cylindrical surface.
Once the DLT parameters are determined, the colour value of each point of the grid can be interpolated and the orthoimage can be generated by applying a colour to each pixel.
The unwrapping technique was used for the choir of the church as depicted in Figure 7. 4 photographs were used to create a mosaic of orthoimages of the cylindrical surface.
(a)
(b)
(c)
Figure 7. Unwrapping of a cylindrical surface: (a) colorized point cloud of the surface; (b) photographs;
(c) mosaic of orthoimages
The mosaic of orthoimages of the choir (Figure 7c) was assessed by comparing distances in the mosaic and the same distances in the raw point cloud previously unwrapped. For 40 measurements from 0 to 6 meters, almost 80% of deviations are comprised between -1 cm and 1 cm.
5.3 Photogrammetric plot
Based on mosaics of orthoimages, the archaeologist of the site can realized photogrammetric plots. It consists in a stone by stone survey directly on the mosaic. Boundaries of stones as
An example of photogrammetric plot carried out by the archaeologist of the site is presented Figure 8. The stone by stone survey allows representing different phases in the structure. Figure 8a presents the stone by stone survey and Figure 8b shows the phasing obtained based on the stone by stone survey. The phasing was realised thanks to structural data (morphology of stones) and aesthetic (Romanesque capitals, framing of bays and chronology of bibliographical and historical data).
(a)
(b)
Figure 8. Photogrammetric plots: (a) stone by stone survey; (b) phasing: blue: Romanesque period; green: late Middle-Ages
– Renaissance; pink:XVIIth century; yellow: XVIIIth-XIXth century
The archaeologists generally represent this type of plot with a scale of 1 per 20. Regarding the deviations of the order of magnitude of 1 cm, they will represent only 0.5 mm in the plot. The quality of the mosaics of orthoimages is thus very satisfactory to carry out stone by stone measurements.
6. CREATION OF A SIMPLIFIED 3D MODEL
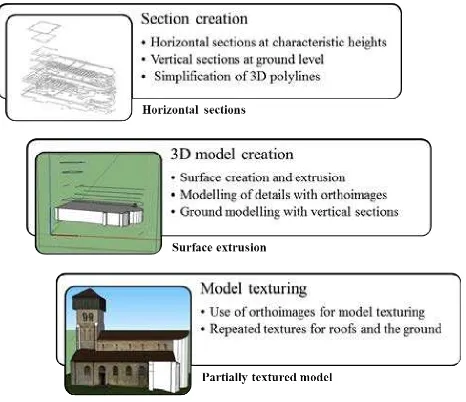
For communication purposes, a simplified 3D model was created for the local authorities. The different steps of the followed workflow are presented Figure 9.
First sections are created from point cloud of the church through Realworks software (Trimble). Horizontal as well as vertical sections are exported in form of 3D polylines. Horizontal sections are created at characteristic heights of the structure whereas vertical sections are considered only for the ground and form a squaring. The exported 3D polylines are simplified in AutoCAD (Autodesk) by reducing the number of points which compose the polylines.
Then, based on horizontal sections, surfaces are created in Sketchup (Trimble) and extruded successively between them. Some details are modelled with orthoimages as for examples discontinuities. Considering vertical sections describing a squaring of the ground, the “Sandbox” tool provided by Sketchup allows to create the surface which follows this squaring thanks to the creation of a triangulated irregular network (TIN). Next, the obtained 3D model is textured with the generated mosaics of orthoimages whose sizes were determined. For roofs and the ground, the same textures are repeated.
Figure 9. Workflow of 3D model creation
Based on the Sketchup model, a 3D pdf is finally created through Simlab software. This format is supported by a standard computer and makes the model accessible for everyone. The resulting model is presented Figure 10.
Figure 10. Final 3D model (3D pdf format)
A high accuracy was not required for this 3D model. However, its size is proportional to the reality. Regarding 30 distances
measured both in the point cloud and in the 3D model, a maximum deviation of 20 centimetres was observed.
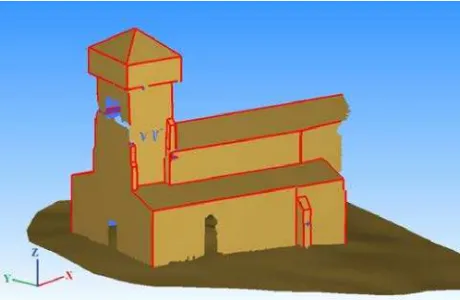
Since the end of the project, new tools were released by different software. The Building Extraction tool provided by 3D Reshaper software (Technodigit) has been tested for the simplified 3D modelling of the church. This tool consists in selecting one by one each plane composing the church. The selected planes are directly intersected between them and a very light mesh model is created. A tolerance by default of 15 cm was use for plane detection. The obtained result is proposed Figure 11. The ground was also modelled with the Ground Extraction tool.
A few refinements need to be applied to the result. Moreover, the modelling of cylindrical surfaces is not proposed. However, the Building Extractor tool is easy to use and allows modelling the church very quickly. Thus, this tool seems to be a good solution for the creation of simplified models of buildings that are composed mainly of planes.
Figure 11. Meshed model obtained with 3D Reshaper tools
7. CONCLUSION
In this paper, the 3D documentation of the Romanesque church of Dugny-sur-Meuse was realized thanks to different measurement techniques. Despite a huge volume of data, the data were made accessible for the different actors of the site and different deliverables were proposed regarding the respective needs of the archaeologist of the site and the local authorities.
A tool involving well-known techniques in photogrammetry, namely the projective rectification technique and the surface unwrapping technique, was created to generate orthoimages of plane surfaces and cylindrical surfaces. This tool was applied to the church and the resulting orthoimage mosaics allow the archaeological study of the church through stone by stone surveys. For the processing of facades composed of multiple parallel vertical planes, the stone by stone is realised separately in mosaics involving the different planes and the drawings are then combined to avoid distortions. The need to adapt the tool to archaeological issues (Duval et al., 2006, Giuliato et al., 2013) involved a close collaboration between archaeologists and surveyors. It may also be appropriate, regarding new technologies, to revisit the requirements of archaeological drawing and adapt the settings of the measurement process and the representation approach. (Saint-Aubin, 2008).
A workflow was also proposed for the creation of a 3D simplified model. 3D pdf format was an easy way to diffuse the obtained model. The workflow involves different software and is quite long. However, since the end of the project, new tools were released as for example the Building Extractor tool of 3D Reshaper software. This tool seems to allow a faster creation of simplified 3D model and will be studied in more details in future works.
ACKNOWLEDGEMENTS
The authors want to thank the county of Val de Meuse for its support and the students from INSA Strasbourg who contributed to the fieldwork.
REFERENCES
Bessac, J.-C., 2005. Anthropologie de la construction : de la trace à l’outil, In: Archéologie du bâti : pour une harmonisation des méthodes, éditions Errance, pp. 53-61.
Collin, H., 1983. Les églises romanes de Lorraine.Tome II : Dictionnaire des édifices. Aboncourt à Housseras, pp. 143-146.
D’Agostino, L., Guffond, C., Sartorio, G., Veissiere, O., Bryer, A., 2013. Lasergrammétrie et photogrammétrie appliquées à l’étude archéologique des châteaux médiévaux : le programme franco-italien AVER – Des montagnes de châteaux, Revue française de photogrammétrie et de télédétection, 201, pp. 13-26.
Drap, P., Gaillard, G., Grussenmeyer, P., Hartmann-Virnich, A., 2000. A stone-by-stone photogrammetric survey using architectural knowledge formalised on the ARPENTEUR Photogrammetric workstation. In: TheInternational Archives of Photogrammetry and Remote Sensing, XIXth Congress of the International Society for Photogrammetry and Remote Sensing (ISPRS), Geoinformation for all, 16-23 July 2000, Amsterdam, Netherlands, ISSN 0256-1840, Vol. XXXIII, Part 5, pp. 187-194.
Duval, H., Ferarresso, I., Kraemer, C., 2006. Archéo-topographie et analyse de l’espace anthropique architecturé. Modélisation Informationnelle pour l'Architecture patrimoniale, 0(2), pp. 47-52.
Giuliato, G., Kraemer, C., Muller, V., 2013. L’analyse topographique en archéologie : évolution des méthodes et des problématiques de recherche, In : Indices et traces : la mémoire des gestes, Colloque international, 16-18 juin 2011, Nancy, PUN, 2013, pp. 297-317.
Grussenmeyer, P., Alby, E., Landes, T., Koehl, M., Guillemin, S., Hullo, J.-F., Assali, P., Smigiel, E., 2012. Recording approach of heritage sites based on merging point clouds from high resolution photogrammetry and terrestrial laser scanning. In: TheInternational Archives of the Photogrammetry, Remote Sensing and Spatial Information Sciences, XXII ISPRS Congress, 25 August - 01 September 2012, Melbourne, Australia, Vol. XXXIX, Part B5, pp. 553-558.
Guerra, F., Miniutti, D, 2000. The cartographic projections for the representation of double curved surfaces. In: The International Archives of Photogrammetry and Remote Sensing, XIXth Congress of the International Society for Photogrammetry
and Remote Sensing (ISPRS), 16-23 July 2000, Amsterdam, Netherlands, Vol. XXXIII, Part B5, pp.533-538.
Hemmleb, M., Wiedemann, A., 1997. Digital rectification and generation of orthoimages in architectural photogrammetry. In: International Archives of Photogrammetry and Remote Sensing, Vol. XXXII, Part 5C1B, pp. 261–267.
Guild, R., 2005. Le dessin en archéologie monumentale : une conception méthodologique.In: Archéologie du bâti : pour une harmonisation des méthodes, éditions Errance, pp. 19-24.
Karras, G. E., Patias, P., Petsa, E., 1996. Digital monoplotting and photo-unwrapping of developable surfaces in architectural photogrammetry. In: The International Archives of photogrammetry and Remote Sensing, Vienna, Austria, Vol. XXXI, Part B5, pp. 290-294.
Karras, G., Patias, P., Petsa, E., Ketipis, K., 1997. Raster projection and development of curved surfaces. In: The International Archives of Photogrammetry and Remote Sensing, Vol. XXXII, Part 5C1B, pp. 179-185.
Kersten, T. P., Lindstaedt, M., 2012. Virtual architectural 3d model of the imperial cathedral (Kaiserdom) of Königslutter, Germany through terrestrial laser scanning. In: Euromed 2012, LNCS, Springer, Heidelberg, Vol. 7616, pp. 201-210.
Landes, T., Bidino, S., Guild, R., 2014. Semi-automatic extraction of sectional view from point clouds. The case of Ottmarsheim’s abbey church. In: The International Archives of the Photogrammetry, Remote Sensing and Spatial Information Sciences, ISPRS Technical Commission V Symposium, 23 – 25 June 2014, Riva del Garda, Italy, Vol. XL-5, pp. 343-348.
Macher, H., Landes, T., Grussenmeyer, P., Alby, E., 2014. Semi-automatic Segmentation and Modelling from Point Clouds towards Historical Building Information Modelling. In: EuroMed 2014, LNCS, Springer, Heidelberg, Vol. 8740, pp. 111–120.
Marschall, H. G., Slotta, R., 1984. Lorraine romane, La pierre qui vire : Zodiaque, pp. 131-136.
Meyer, E., Grussenmeyer, P., Tidafi, T., Parisel, C., Revez, J., 2004. Photogrammetry for the epigraphic survey in the Great Hypostyle Hall of Karnak Temple. In: International Archives of Photogrammetry and Remote Sensing, XXth Congress of the International Society for Photogrammetry and Remote Sensing (ISPRS), Geo-imagery bridging Continents, 12-23 July 2004, Istanbul , ISSN 1682-1777, Vol. XXXV, Part B5, pp.377-382.
Schueremans, L., Van Genechten, B., 2009. The use of 3D-laser scanning in assessing the safety of masonry vaults – A case study on the church of Saint-Jacobs. Optics and Lasers in Engineering, 47(3), pp. 329-335.
Soria-Medina, A., Martinez, J., Arias, P., Armesto, J., Buffara-Antunes, A. Z., 2013. Three-dimensional modeling of the Romanesque church of Santa Maria de Castrelos (Vigo–Spain) using terrestrial laser scanner. In: The International Archives of the Photogrammetry, Remote Sensing and Spatial Information Sciences, 2013 XXIV International CIPA Symposium, 2 – 6 September 2013, Strasbourg, France, Vol. XL-5/W2, pp. 601-604.
Saint-Aubin, J.-P. (2008). Nouveaux outils de mesure de l’espace, de traitement et de représentation archéologique, In:
Images et relevés archéologiques, de la preuve à la démonstration, Actes du 132e congrès national des sociétés historiques et scientifiques, Arles, 2007, pp. 83-92.
Sumera, F., 2010. Archéologie du bâti, scanner 3D et ortho-photographie. Vraie réponse ou fausse solution. Séminaire de l’UMR 5140, « L’imagerie virtuelle en Archéologie : présentation d’outils et retours d’expériences », 17 février 2010.
Theodoropoulou, I., Petsa, E., Karras, G. E., 2001. Digital Surface Development of Large Cylindrical and Conical Structures With a Single Image Technique. The Photogrammetric Record, 17(97), pp. 25-37.
Viollet le Duc, E., 1854-68. Dictionnaire raisonné de l’architecture française du XIe au XVIe siècle, Vol. 6, pp. 141-142.