3D SCAN OF ORNAMENTAL COLUMN (HUABIAO) USING TERRESTRIAL LIDAR
AND HAND-HELD IMAGER
W. Zhang a, *, C. Wang b, X. Xi b
a State Key Laboratory of Remote Sensing Science, Beijing Key Laboratory of Environmental Remote Sensing and Digital City, School of Geography, Beijing Normal University, Beijing, 100875 China - [email protected]
b Institute of Remote Sensing and Digital Earth, Chinese Academy of Sciences, Beijing, 100094 China – (wangcheng, xixh)@ radi.ac.cn
Commission V, WG V/2
KEY WORDS: 3D Scan, Ornamental Column, Huabiao, Terrestrial LiDAR, Structured Light
ABSTRACT:
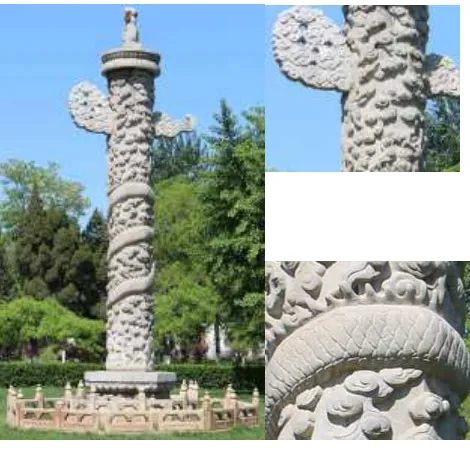
In ancient China, Huabiao was a type of ornamental column used to decorate important buildings. We carried out 3D scan of a Huabiao located in Peking University, China. This Huabiao was built no later than 1742. It is carved by white marble, 8 meters in height. Clouds and various postures of dragons are carved on its body. Two instruments were used to acquire the point cloud of this Huabiao, a terrestrial LiDAR (Riegl VZ-1000) and a hand-held imager (Mantis Vision F5). In this paper, the details of the experiment were described, including the differences between these two instruments, such as working principle, spatial resolution, accuracy, instrument dimension and working flow. The point clouds obtained respectively by these two instruments were compared, and the registered point cloud of Huabiao was also presented. These should be of interest and helpful for the research communities of archaeology and heritage. Huabiao located in Peking University, China. This Huabiao was built no later than 1742. It is carved by white marble, 8 matching technology, multiple images can help improving the spatial resolution of the obtained point cloud (REMONDINO, 2007). But it is not suitable for our case because Huabiao has the uniform color surface. Structured Light 3D scanning is another technology which can capture the point cloud with high spatial resolution. Coded light is projected on the object’s surface to generate artificial features for image matching, so this technology just satisfies the requirement of our case. In this experiment, Mantis Vision F5 which is an infrared structured light based hand-held 3D scanner (Estela and Hamacher, 2014) was adopted to work together with Riegl VZ-1000 (a 3D Terrestrial Laser Scanner) to obtain the detailed point cloud of Huabiao.
In this paper, we will introduce these two instruments and the details of our experiment, we will also show the differences between the point clouds from these two instruments.
2. USED INSTRUMENTS
As mentioned above, two instruments were used to acquire the point cloud of Huabiao, a terrestrial LiDAR (Riegl VZ-1000) and a hand-held imager (Mantis Vision F5). Riegl VZ-1000 is a 3D Terrestrial Laser Scanner. It is based on the time-of-flight measurement of a short laser pulse. Mantis Vision F5 is a structured light based hand-held 3D Scanner. The hardware of F5 consists of two parts, a video camera and a flash light projector embedded within an ergonomic handgrip. The The International Archives of the Photogrammetry, Remote Sensing and Spatial Information Sciences, Volume XL-5/W7, 2015
25th International CIPA Symposium 2015, 31 August – 04 September 2015, Taipei, Taiwan
This contribution has been peer-reviewed.
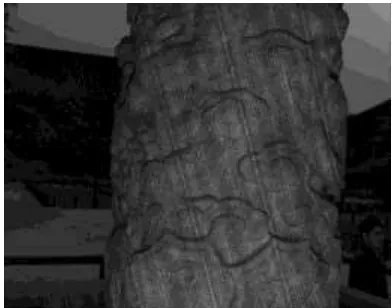
projector projects invisible (infrared) light onto the object through a mask containing Mantis Vision’s proprietary patterns. Then, the scene illuminated by the coded light is captured by the video camera as shown in Figure 2. The image contains all the indexing information required by the triangulation algorithm, and the point cloud of the scene can be computed based on these information (Wrona, 2014).
Figure 2. Image with coded light captured by F5
The measuring distance of VZ-1000 is from 2.5m to 1km, while F5 works best from 0.5m to 5m. The spacing of point cloud acquired by Riegl VZ-1000 is about several centimeters, while F5’s spatial resolution is about several millimetres. For F5, the accuracy is about 0.5mm and for VZ-1000 about 1cm. The weight of VZ-1000 is 9.8kg and it is must be mounted on a surveyor’s tripod. The weight of F5 is 1.7kg and it can be held by hands to scan any parts of the object.
Figure 3. Riegl VZ-1000 and Mantis Vision F5 (www.mantisvision.com)
3. EXPERIMENTAL RESULT 3.1 Data acquisition and processing
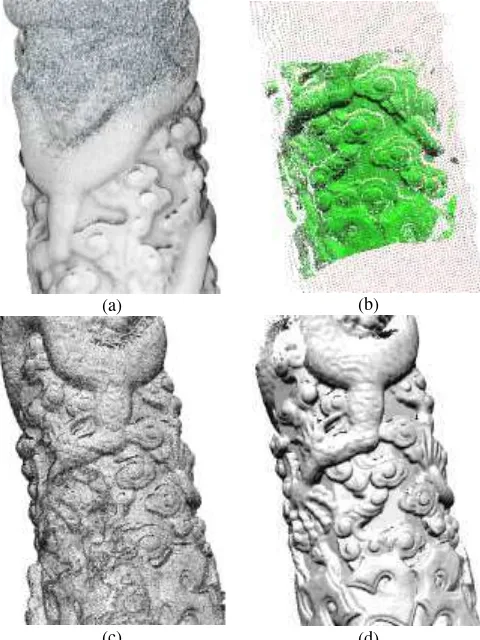
The distance from Riegl VZ-1000 to Huabiao was about 15m. The resolution of the scanner was set to a high value so that the spacing of the scanned point cloud was about 1.5cm. Six scan registration result was achieved using function MSA (Multi Station Adjustment) which is an implantation of ICP (iterative closest points algorithm). The final point cloud of Riegl VZ-1000 is shown in Figure 4(a).
To acquire the point cloud of Huabiao by Mantis Vision F5. An operator held it and moved slowly around the Huabiao. The measuring distance is about 1m and the spacing of the obtained point cloud is about 0.5cm. The raw data of Mantis Vision F5 are videos (Frame rate is 10fps). After acquisition, the data were processed by the MVP software. The videos were decoded into a dense point cloud (about 50000 points per frame). The MVP then automatically registered all the frames into the final point cloud, which is shown in Figure 4(b).
After the point clouds from Rigel VZ-1000 and Mantis Vision F5 were generated, they were aligned to form the whole Huabiao’s point cloud. Again, several tie points were selected from both point clouds to approximately align them, and then by Mantis Vision F5 because of the range limitation.
(a)
(c) (b)
Figure 4. Point clouds of (a) Riegl VZ-100, (b) Mantis Vision F5 and (c) registered of above two point clouds
The differences of spatial resolution and accuracy between two instruments were described in the previous section. The experimental result also revealed these differences.
The International Archives of the Photogrammetry, Remote Sensing and Spatial Information Sciences, Volume XL-5/W7, 2015 25th International CIPA Symposium 2015, 31 August – 04 September 2015, Taipei, Taiwan
This contribution has been peer-reviewed.
(a) (b)
(c) (d)
Figure 5. The difference of point cloud’s density. (a) shows a portion of registered point cloud; (b) shows the point cloud from 1000 (red) and F5 (green); (c) is a portion of
VZ-1000 point cloud; (d) is a portion of F5 point cloud.
Figure 5 shows the difference of the point cloud’s density between these two instruments. Figure 5(a) is a portion of Figure 4(c). Mantis Vision F5 only scanned the lower part of Huabiao, so the upper part of Figure 5(a) is only the point cloud from VZ-1000, while the lower part has the point clouds from both instruments. Obviously, the point cloud of lower part is much denser than that of the upper part. Figure 5(b) shows the point clouds from two instruments in different colors. It can be seen that the green point cloud (from F5) is really much denser then the red point cloud (from VZ-1000). Figure 5(c) and Figure 5(d) are respectively the point clouds of VZ-1000 and F5, which are cut from the same part of the registered point cloud of Huabiao. The denser point cloud from F5 presents more details than the one from VZ-1000.
Figure 6. The difference of point cloud’s accuracy
Figure 6 shows the difference of the point cloud’s accuracy. For the visual effect, a mesh was generated from the registered point cloud. It can be seen there are many noisy points on the mesh. Most of these noisy points are belonged to point cloud of VZ-1000, because the accuracy of VZ-1000 is lower than that of F5.
To remove the noisy points, the mesh was filtered. The smoothed mesh is shown in Figure 7. Although it is blurred, it still has enough details to represent the complex surface of Huabiao.
Figure 7. The smoothed mesh
4. CONCLUSION
We carried out an experiment to obtain the detailed point cloud of Huabiao. For this purpose, two instruments were used in our experiment, a terrestrial LiDAR (Riegl VZ-1000) and a hand-held imager (Mantis Vision F5). We compared the differences between these two instruments, such as working principle, spatial resolution, accuracy, instrument dimension and working flow. The point clouds obtained respectively by these two instruments were also compared, and the registered point cloud of Huabiao was presented. The experimental result illustrates that the point cloud of Mantis Vision F5 has higher spatial resolution and accuracy then that of Riegl VZ-1000. But because of the range limitation, it is hard for Mantis Vision F5 to scan the higher part of Huabiao.
In the future, we will quantitatively evaluate the accuracy of Riegl VZ-1000 and Mantis Vision F5, and will develop the automatic registration method to improve the efficiency. We will also do research on effective integration of these two Academy of Sciences No. 2014LDE015. We also would like to thank Hongwei Du for his help on data acquisition and processing of Mantis Vision F5.
REFERENCES
The International Archives of the Photogrammetry, Remote Sensing and Spatial Information Sciences, Volume XL-5/W7, 2015 25th International CIPA Symposium 2015, 31 August – 04 September 2015, Taipei, Taiwan
This contribution has been peer-reviewed.
Estela, A. and Hamacher, J., 2014. A New Approach for Documentation, Conservation and Preservation of the Monolithic Statues in San Agustín as Pilot for Outdoor Cultural Heritage Documentation in Colombia. ISPRS - International Archives of the Photogrammetry, Remote Sensing and Spatial Information Sciences, XL-5, pp. 225-229.
REMONDINO, F., 2007. Detailed image-based 3D geometric reconstruction of heritage objects. DGPF Tagungsband, 16, pp. 483-492.
Wrona, M., 2014. Using optical NIR handheld scanner for close range 3d mapping. 9TH International Conference "Environmental Engineering".
The International Archives of the Photogrammetry, Remote Sensing and Spatial Information Sciences, Volume XL-5/W7, 2015 25th International CIPA Symposium 2015, 31 August – 04 September 2015, Taipei, Taiwan
This contribution has been peer-reviewed.