Re-emerging Malaria vectors in rural Sahel (Nouna, Burkina
Faso): The Paluclim project
Cécile Vignollesa, RainerSauerbornb, Peter Dambachb, Christian Vielc, Jean-Michel Soubeyrouxc, Ali Siéd, Christophe Rogiere, Yves M. Tourref
a Centre national d’études spatiales (CNES),Toulouse, France b Institut de santé publique, Heidelberg University, Germany c Météo-France, Toulouse, France
d Centre de Recherche en Santé (CRSN), Nouna, Burkina Faso e Institut Pasteur, Madagascar
f LDEO of Columbia University, Palisades, NY, USA
Commission VIII, WG VIII/2
KEY WORDS: Tele-epidemiology, remote-sensing, vectorial risk, climate change, larvicide’s strategy
ABSTRACT:
The Paluclim project applied the tele-epidemiology approach, linking climate, environment and public health (CNES, 2008), to rural malaria in Nouna (Burkina Faso). It was to analyze the climate impact on vectorial risks, and its consequences on entomological risks forecast. The objectives were to: 1) produce entomological risks maps in the Nouna region, 2) produce dynamic maps on larvae sites and their productivity, 3) study the climate impact on malaria risks, and 4) evaluate the feasibility of strategic larviciding approach.
I. INTRODUCTION
Malaria is still a key issue for public health in Africa and particularly in the Sahel. Fifty percent of the population is at risks and exposed to contacts with the infected female vector: of the Anopheles’ specie. According to WHO during 2012, 207 millions cases were identified worldwide (uncertainty between 135 and 287 millions) whilst the mortality attained 627,000 individuals (uncertainty between 473,000 and 789,000). The socio-economical consequences in endemic and poor regions are of the utmost importance. In Nouna (Burkina Faso), the endemic diffusion fluctuates with seasonal variability. The
Anopheles gambiae specie is the dominant vector. It is thus observed that:
- Their is a need for the stakeholders at large to adapt their public health strategies with new tools, while facing re-emerging infectious diseases;
- The importance of climate and environmental factors must be identified in their role of transmission and diffusion of the disease;
- It is somewhat difficult to implement public health measures at the regional/local levels.
From the above it becomes clear that predicting risks on small scales is a reality, and that strategic prevention is a pre-requisite.
II. METHODS AND TECHNIQUES
The studied area is the Nouna district, north-west of Burkina Faso along the Malian border, and within the Kossi province (7,324 km2). It belongs to the so-called Soudano-Sahelian zone where malaria is not only endemic but depends on seasonal rainfall regimes (rainfall season from June until September). Measuring campaigns (entomological, meteorological, and environmental) took place during the rainy seasons of 2011 and 2012, in the 10 selected villages (see Figure 1) in order to: - better understand the mechanisms involved with the formation and production of larvae sites;
- to quantify the larval densities per each water sites associated with each villages;
Figure 1 : Zones where entomological measurement were taken
The measuring campaign of 2011 (from August to December) was to acquire the key data to develop prediction models for larvae production. The 2012 campaign (from July until December) had a double objective:
- validation of entomological models (for larvae and adult vectors) based upon the 2011 data in order to establish maps of vectorial risks;
- show the feasibility of a strategic larvicide’s procedure based upon the vectorial risk maps. with its uncertainty.
A. Production of maps with entomological risks dynamics
In general this is based upon the conceptual approach develop by CNES and partners (CNES, 2008; Tourre et al., 2009). In this approach, relationships between "climate-environment-health" are analyzed to highlight emerging and diffusion of infectious diseases within a climate change background and using remote sensing techniques. This multidisciplinary approach is called tele-epidemiology. Some epidemics such as malaria, rift valley fever (RVF), dengue fever are indeed affected by climatic and environmental conditions which can be assessed from satellites. Satellite imagery detects environmental and habitats conditions (geographical, climatological, and hydrological) influencing directly pathogenic agents such as viruses, bacterias, and/or parasites. Environmental parameters favoring (or not) the emergence of a disease are thus quantified. Three steps are necessary (see Figure 2):
1) understand first the physical mechanisms involved and favoring the disease diffusion. Putting together the multidisciplinary data sets with all the key parameters ; 2) develop spatio-temporal products truly adapted in terms of spatial and spectral resolutions;
3) implementation of numerical models, by combining in-situ and remotely-sensed data in order to produce dynamical risks maps.
Figure 2 : The conceptual approach of tele-epidemiology
A first step for risks forecasts is to identify where the vectors are going to be present, even if the relationship between vectors density and disease prevalence are not linear. Thus the entomological risk is an important parameter. Then the probability of having exposed to the vectors has to be evaluated. This is where tele-detection becomes a key tool, since favorable areas may be identified from space.
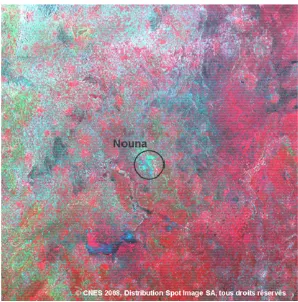
Anopheles abundance is directly linked to water pools and their distribution. Based upon the latter field work has been done in urban area such as Dakar (Machault et al., 2012) and preliminary studies in Burkina Faso by the PaluClim project partners (Dambach et al., 2009; Dambach et al., 2012). A two-step methodology was designed: 1) map the water pools with or without larvae 2) map the pools with the presence of larvae. The larvae density could be thus determined. The steps are based upon statistical modeling, which includes environmental and meteorological risk. The satellites images were from SPOT-5 with a 2.5m spatial resolution, obtained in 2008, 2009, 2011and 2012 from the CNES ISIS from CNES program (http://www.isis-cnes.fr/). Each image covers a scene of approximately ~3600km2 (60 km x 60 km) centered around Nouna (Figure 3). Different environmental variables were identified such as presence or not of vegetation, pools in urban areas with anopheles larvae and adults, all from special indices such as the NDVI (Rouse et al., 1973), the NDWI (McFeeters, 1996) the MDWI (Xu, 2006) or the NDPI (Lacaux et al., 2007), superimposed on a ground cover map (LULC Land Use and Land Cover) using supervised classification (i.e., maximum resemblance). MODIS (Moderate Imaging Spectroradiometer) images were also used to obtain surface temperature during the day or night.
Figure 3 : Image SPOT-5 du 9 septembre 2008
During step 1 the explicative variable is 0 or 1 (i.e., absence or presence of water bodies in a 10x10m square), is determined using logical regression to identify environmental parameters associated with water. The discriminant power of the final model is evaluated using ROC (Receiving Operating Characteristics). The visual aspect of the ROC curve allows defining the probabilistic threshold above which water is present. The final mapping for water presence for each 10m square, 2 kms around villages is obtained by inversing the statistical model.
During step 2 the explicative variable is linear, i.e. larval density inside a water body as a function of time. Linear regression is also applied to associate environmental and meteorological variables with larval densities. The final linear equation is applied for all of the water bodies obtained from step 1. As results the associated variables are statistically linked to larval density.
For the two steps, a stochastic effect has been added to eliminate possible spatial autocorrelation. Thus only variables associated with water bodies in step 1, and with larval density in step 2 with a univariate p-value<0,25 are kept for the multivariate analysis. Moreover a backward stepwise selection allows for keeping relevant variables, Again only variables with p-value<0,05 are kept in the final models.
B, Malaria risks as a function of the spatio-temporal climate variability.
In order to assess climate conditions impacts on malaria, an impact model is necessary. Here the model is inspired from Craig and Ermerts work (Craig et al. 1999 or Ermert et al., 2011), within the MARA (Mapping Malaria Risk in Africa) project (see Tanser et al., 2003). Il Indices favoring the diffusion of Malaria, are computed (IND hereafter) Values are between 0 (or U for « unsuitable ») and 1 (or S pour « suitable »). This is applied to the temperature, precipitation and humidity fields.
It is generally admitted that using those indices is somewhat restrictive to understand fully the complex mechanisms involved with diffusion, infection of humans by vectors at least. The mapping developed within the Paluclim project is thus to alleviate the complexity bay taking into account environmental
factors linked to the vectors cycles including the larval stages. Moreover it is noted that the indices described above cannot be compared directly with larval quantity and vectors aggressiveness. But this simple approach contributes to a diagnostic on climate conditions (past, present and future) favoring malaria transmission, other things being equal.
A climate analysis has been accomplished for the Nouna region (1983-2011). Datasets have been used from ARC21 for rainfall and from ERA-interim for temperature and relative humidity. Based upon the climatology and the Craig’s model, indices favoring malaria appearance and diffusion were computed for the same period. Finally the climate analyses used three different time-scales:
1. Natural climate variability of rainfall ; 2. Seasonal variability of the malaria risks ;
3. Future variability in a climate change context for the Nouna region.
• C. A targeted laviciding strategy
•
• The objectives of this task were three-folds : •
• Add a larvicide’s approach to the sites under control; • Show the feasibility of this approach in rural
conditions ;
• Assess the impacts on entomological conditions.
The idea was to show that a larviciding strategy can be implemented in a rural zone, and improve the entomological conditions. This was done for 10 villages in the Nouna region: 5 villages without spraying, 5 villages with spraying. The larvicide was the Bacillus thuringiensis israelensis (Bti) bacteria without harmful effect on people. This biological larvicide is advantageous when compared to impregnated nets or classic sprays.
Entomological models based upon data from 2011 allow putting together operational maps for vectorial risks in 2012. Larval densities were computed for each predicted water bodies every day from May 31 until July 2012. The sum of all the predictions was considered as the measure for larval density to target the larvicide process. Maps were generated within a circle of 2 kms around the 10 villages. The Bti was applied in a buffer zone of 500m around the 5 villages used for spraying. The larval density threshold was such that only 50% of the predicted surface for maximum larvae production was treated. That was chosen for economical and logistical reasons. The ultimate goal of this approach is to optimize the cost/benefit ratio.
III. RESULTS
A. Production of maps for entomological dynamic risks
Step 1: Mapping of water bodies
The two NDPI and NDWI McFeeters indices were associated to identify areas with free water. The map for ground covering from the LULC classification, also allow identifying variable for humid zone and neighboring water. Negative NDPI reflects water presence. The opposite is true for NDWI McFeeters index. By using the above three variables the discriminating power for the model was adequate (see area under the ROC curve: 0,73 [0,71 ; 0,75]).
The map for the water bodies obtained from the inverse model with a 10 m spatial resolution was thus created. 1581 bodies were identified within the 2 kms radius circle around the 10 villages. Figure 4 is for the prediction around the Goni village. This is static, and based upon an image during the wet season at a given date. It is hypothesized that this is valid for the year or even for few years prior to the given year.
Figure 4 : Results for the prediction of water bodies (in blue and for step1)
During 2012, ground truth monitoring was accomplished to validate the modelling technique presented above. The following conclusions could be obtained: 93% of water bodies predicted by the model were indeed present.
Step 2: mapping larval sites
Le NDWI McFeeters (wet season) is linked to larval density (see Machault, 2012) for two reasons at least:
1) It is linked to temporary water bodies, favorable for larval sites production. It is thus important o distinguish temporary water bodies to permanent water bodies.
2) It is also linked to muddy sites which also favor larval production. This is when all the stages leading to adult mosquitoes are taken.
The total amount of water over 30 days is also coherent with larval density. Even if in stage 1, the water presence is identified, stage 2 might be an indicator for the persistence of larval sites. The Spearman coefficient computed to validate the larval prediction is of 0.4, indicated a moderate correlation.
The map for larval site is obtained from the inversion of the model during stage 2. In Figure 5 the prediction is given for the Goni village when the model is applied for the May 31-July 24, 2012 period. The 55 predictions are added to show the 5-risk levels.
Figure 5 : Prediction of larval densities
B. Malaria risks as a function of the climate spatio-temporal
variability.
Climate analysis for the malaria risk during the1983-2011 period
The climatology in the Nouna region favoring malaria diffusion, using the Craig’s model is displayed in Figure 6. The indices were computed using the total monthly rainfall, the minimum and maximum mean monthly temperatures, end the mean monthly relative humidity (RH). Whilst the temperature and the RH favor malaria the total monthly rainfall is a limiting factor.
Figure 6 : Yearly climatology for the Nouna region, and climate conditions favoring malaria.
Climate variability of natural rainfall
It is very important to understand the natural climate signals acting upon monthly and seasonal rainfall. Thus besides the AMO (Atlantic Multidecadal Oscillation) linked to Sahelian rainfall, other indices were studied in the Atlantic, such as the NAO, TNA, TSA (see Tourre et al., 2010), in the Indian Ocean (SETIO, SWIO, WTIO and DMI), and finally the Pacific Ocean (NINO3.4, PDO, Zhang et al., 1997). Atmospheric indices were also assessed (QBO, WHWP)2. The analysis was lead/lag correlations up to 9 months, between the different time-series.
2 The indices are described on the OOPC (Ocean Observations Panel for Climate)site. http://ioc-goos-oopc.org/
The largest correlations of 0.66 (0.69) are found between rainfall in Nouna and the AMO for the JAS (ASO) time-series lagged by one month. The AMO3 displayed a negative tendency between 1960 and 199 then positive after 1995 until today (Enfield et al., 2001). The negative/positive of the AMO diminish/increase Sahelian rainfall. This correlation is linked to malaria diffusion, and is displayed in Figure 7.
Figure 7 : Index of favorable malaria conditions and rainfall in the Nouna region. The red line is for the
AMO tendency change in 1995.
Seasonal predictability of the malaria risk
The prediction to have a monthly threshold of 80 mm of rainfall (above which the risk is very large) has been examined using three different approaches:
- Climatological prediction
- Prediction according to the AMO phases
- Seasonal prediction using ARPEGE-Climat from Météo-France
The first approach used mean rainfall over Nouna for the 1983-2011 period. The estimation for being over the 80 mm threshold was calculated. The predictability is in general good for 90% of the time, except for the months of May, June and September. The predictability is improved when the AMO phases are used. This is particularly true for June (52% to 79%) and September (69% to 76%). Nevertheless there is no improvement for the other months when the climatology was used.
Finally the seasonal predictability using ARPEGE-Climat and a statistical logistic regression for the total rainfall (as a predictor), the AMO and NAO. Enfin, la prévisibilité mensuelle a été étudiée en utilisant la prévision saisonnière du modèle ARPEGE. Ces prévisions ont été adaptées par une méthode statistique de régression logistique, utilisant pour prédictors le cumul prévu par ARPEGE et des indices climatiques (AMO et NAO). It is found whatever is the initialization month, the best prediction for the 80 mm threshold (looking at the area under the ROC curve ) is the one using the climatology taking into account the AMO phases.
The future climate conditions in the Nouna region and malaria risks
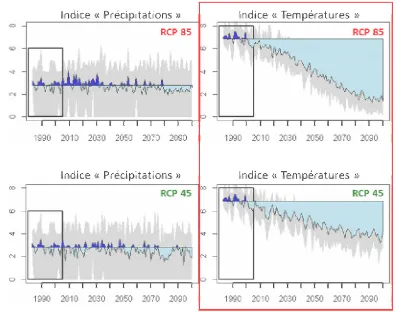
This section is to analyze climate change and favorable conditions for malaria risks. The climate was simulated on the global scale using CMIP-5 (Taylor et al., 2012). Two radiative scenarii were used RCP45 and RCP854. A multi-model approach was applied with one simulation per model, with no weighting following Knutti et al., (2010). A quantile-quantile method was used so the model can be adjusted to the observed rainfall and temperature and for the 1983-2005 period.
Figure 8 : Mean evolution (with scattering) of the yearly indices for temperature and rainfall favoring malaria diffusion from 1983until 2100 using the two climate scenario of RCP45 andRCP85. Post-2005, the evolution for RCP45, are at top, and RCP85 at bottom. The light blue shading are for period. Les parties blue/light blue are for periods above/below the mean computed during the 1983-2005 historical period.
Between 1983 and 2011, following Craig’s model, favorable/unfavorable conditions for malaria were essentially linked to total rainfall modulated by the AMO phases.
According to the climate projection for the 21st century (Preliminary results from CORDEX http://cordex2013.wcrp-climate.org/), the environment should evolve, while the risks linked to rainfall should not change much. The natural variability is more important than the simulated climate tendency. Nevertheless the impact from temperature changes should be more important, with decrease in the malaria risk. Following Craig’s model the temperature increase should be the limiting factor for the malaria risks in the Nouna region. C. Putting in place a larviciding strategy
The biological larvicide used is from the Bacillus thuringiensis israelensis (Bti) bacteria. The protocol for the larvicide spraying has been put in place. Different concentrations were tested during 28 days. A spray was accomplished every 9-10 days with a concentration of 0,4mg/l (equivalent to 0,4kg/ha), a sufficient quantity.
The larviciding period went from October 4th to November 19, 2012. The experiment was to compare the 5 villages where the spraying was done to the other 5 villages (witness villages). The spraying starting kind of late during the season, due to late delivery.
The statistical test Cochran-Mantel-Haenszel (with =0.05) was used. The number of captured mosquitoes within the treated villages was not statistically significant when compared to the numbers for the other villages.
IV. CONCLUSION
A multidisciplinary approach was undertaken by all the partners of Paluclim. A database and a GIS, were put together, as well as the analyses of satellite pictures, and the development of a bio-mathematical model to apply to entomological risks, It was shown that:
- That it was possible to build a model for larval site prediction, using satellite and in-situ data. The model allowed establishing operational and dynamic maps for larval productivity at the scale of villages.
- That it was possible to develop well targeted larviciding strategies.
The use of dynamical maps was well appreciated by local users, as an important tool for decision making. For the larviciding strategies it should be continued but on a much larger scale, An impact model, adapted from Craig’s model was used to evaluate the entomological risks as a function of the climate spatio-temporal variability. The climate analysis was made on different scales (Local to regional, and from high frequency to low frequency variability). The end result is that the temperature increase should lead to a decrease of the malaria risk. The temperature is thus the limiting factor in the Nouna region. The risk should be extremely reduced at the end of the century when compared to today values.
V. ADDED VALUES TO PUBLIC POLICIES BY TRANSFER TECHNOLOGIES
One of the goals of this project was to develop strategies for public health, by using operational mapping and larviciding technologies. Knowing the local environmental factors was a key element as well as optimizing the cost/benefits ratio. As suggested by Yé (2005), developing predicting tools and early warnings were a necessity for a complete strategy concerning entomological risks.
From the models, adaptive measures can be used for adaptation and mitigation of impacts (Teklehaimanot et al., 2004). Public health centers can be prepared to potential epidemics, in terms of treatment to reduce morbidity and mortality. Modeling activities are essential to integrate weather/climate and environmental factors. Mapping allows highlighting areas which are proned to malaria diffusion. Persistence of larval sites created by human activities can be reduced/eliminated. All of the above combined can contribute to a betterment of the malaria early warning systems.
Control programs can be implemented in terms of larviciding in critical sites at the right time particularly during the rainy season. Thus risks maps become a valuable tool for control intervention.
Two types of action from the health sector can be foreseen: 1) A short term action
During this project maps put together with the CRSN (Nouna) not only allowed to identify the high-risks zones, with associated larviciding strategies. The main actors thus became familiar with the new techniques and tools developed during the project (télédétection, télé-épidémiology)
2) A long term action
The main action here is to become operational in terms of control measures (planning, cost/benefits, added values …) A study over a larger scale involving more villages must be implemented, while contacts with stakeholders and decision makers from the Health Ministry must be improved.
This contribution has been peer-reviewed. VI. References
CNES, 2008, Method for tele-epidemiology (Méthode pour la télé-épidémiologie). Patent pending # PCT/FR2009/050735
Craig M. H., Snow R. W., le Sueur D., 1999. A climate-based distribution model of malaria transmission in sub-Saharan Africa. Parasitology Today, 15(3), 105-111.
Dambach P., Sie A., Lacaux J. P., Vignolles C., Machault V., Sauerborn R., 2009. Using high spatial resolution remote Utilization of combined remote sensing techniques to detect environmental variables influencing malaria vector densities in rural West Africa. International Journal of Health Geographics, [en ligne], 11 (8),
http://www.ij-healthgeographics.com/content/11/1/8, (look at on 22/10/2014) Enfield D.B., Mestas-Nunez A.M., Trimble P.J., 2001: The Atlantic Multidecadal Oscillation and its relationship to rainfall and river flows in the continental U.S., Geophysical Research Letters., 28(10), 2077-2080
http://onlinelibrary.wiley.com/doi/10.1029/2000GL012745/abst ract
Ermert V., Fink A. H., Jones A. E., Morse A. P., 2011. Development of a new version of the Liverpool Malaria Model. I. Refining the parameter settings and mathematical formulation of basic processes based on a literature review.
Malaria Journal, [en ligne], 10(35)
http://www.malariajournal.com/content/pdf/1475-2875-10-35.pdf (look at on 22/10/2014) Fillinger U., Knols B. G., Becker N., 2003. Efficacy and efficiency of new Bacillus thuringiensis var israelensis and Bacillus sphaericus formulations against Afrotropical anophelines in Western Kenya. Trop. Med. Int. Health, [en ligne], 8(1), 37-47
http://onlinelibrary.wiley.com/doi/10.1046/j.1365- 3156.2003.00979.x/abstract, (look at on 12/01/2015)
Knutti R., Abramowitz G., Collins M., Eyring V., Gleckler P.J., Hewitson B., Mearns L., 2010. Good Practice Guidance Paper on Assessing and Combining Multi Model Climate Projections, Meeting Report of the Intergovernmental Panel on Climate Change Expert Meeting on Assessing and Combining Multi Model Climate Projections. IPCC Working Group I Technical Support Unit, University of Bern, Bern, Switzerland, 15p
https://www.ipcc-wg2.gov/meetings/EMs/IPCC_EM_MME_GoodPracticeGuida ncePaper.pdf
Lacaux J-P., Tourre Y.M., Vignolles C., Ndione J-A., Lafaye, M., 2007. Classification of ponds from high-spatial resolution remote sensing: Application to Rift Valley Fever epidemics in Senegal. Remote Sensing of Environment, 106, 66-74
Machault V., Vignolles C., Pagès F., Gadiaga L., Tourre Y. M., Gaye A., Sokhna C., Trape J-F., Lacaux J-P., Rogier C., 2012. Risk Mapping of Anopheles gambiae s.l. Densities Using Remotely-Sensed Environmental and Meteorological Data in an Urban Area: Dakar, Senegal, PLOS one, [on line], 7(11)
http://www.plosone.org/article/fetchObject.action?uri=info%3A doi%2F10.1371% 2Fjournal.pone.0050674&representation=PD F, (look at on 22/10/2014)
McFeeters S.K., 1996. The use of the normalised difference water index (NDWI) in the delineation of open water features. International Journal of Remote Sensing, 17(7), 1425-32
Rouse J.W., R.H. Hass, J.A. Schell, D.W.Deering, 1973. Monitoring vegetation systems in the Great Plains with ERTS. In: Third Earth Resources Technology Satellite Symposium, December 10-14, 1973, Washington D.C, NASA SP353, Vol. 1., 309-317 Tanser F. C., Sharp B., le Sueur D., 2003. Potential effect of climate change on malaria transmission in Africa. The Lancet, 362, 1792-1798
Taylor K. E., Stouffer R. J., G. A. Meehl G. A., 2012. An overview of CMIP5 and the experiment design. Bulletin of the American Meteorological Society, [on line], 485-498
http://journals.ametsoc.org/doi/abs/10.1175/BAMS-D-11- 00094.1, (look at on 12/01/2014)
Teklehaimanot H. D., Schwartz J., Teklehaimanot A., Lipsitch M., 2004. Weather-based prediction of Plasmodium falciparum malaria in epidemic-prone regions of Ethiopia II. Weather-based prediction systems perform comparably to early detection systems in identifying times for interventions. Malaria .Journal, [en ligne], 3(44)
http://www.malariajournal.com/content/pdf/1475-2875-3-44.pdf, (look at on 07/01/2015)
Tourre Y.M., Lacaux J-P., Vignolles C., Lafaye M., 2009. Climate impacts on environmental risks evaluated from space: The case of the Rift Valley Fever and its conceptual approach. Global Health Action, [en ligne],2, DOI:
10.3402/gha.v2i0.2053http://www.globalhealthaction.net/index.php/gha/article/view/2 ... , (look at on 22/10/2014).
Tourre Y. M., Paz S., Kushnir, Y., 2010. Low-frequency climate variability in the Atlantic basin during the 20th century. Atmospheric Sciences Letters, [en ligne], 11(3), 180–185 http://onlinelibrary.wiley.com/doi/10.1002/asl.265/pdf, (look at on 12/01/2015)
Xu H., 2006. Modification of normalised difference water index (NDWI) to enhance open water features in remotely sensed imagery. International Journal of Remote Sensing, 27(14), 3015-33
Yé Y., 2005. Incorporating Environmental factors in Modelling Malaria Transmission in under five children in Rural Burkina Faso, Inaugural Dissertation to attain the degree of Doctor scientiarum humanarum (Dr. Sc. Hum.) at the Medical Faculty of Ruprecht-Karls-University Heidelberg
Zhang Y., Wallace J.M., Battisti D.S., 1997. ENSO-like Interdecadal Variability: 1900-93. Journal of Climate. [en ligne],10 (5), 1004-1020.