MAPPING SPATIAL MOISTURE CONTENT OF UNSATURATED AGRICULTURAL
SOILS WITH GROUND-PENETRATING RADAR
O. Shamiracde, N. Goldshlegerbc, U. Bassond, M. Reshefe
a Eastern R&D Center, Israel
b Department of Civil Engineering, Ariel University, Israel
c Soil Erosion Research Station, Soil Conservation & Drainage Department, Israel Ministry of Agriculture –
d Geo-Sense Ltd, Israel – [email protected]
e Department of Geosciences, Tel Aviv University, Israel – [email protected], [email protected]
KEY WORDS: Ground-penetrating radar, moisture content, agriculture, soil, spatial mapping, active remote sensing
ABSTRACT:
Soil subsurface moisture content, especially in the root zone, is important for evaluation the influence of soil moisture to agricultural crops. Conservative monitoring by point-measurement methods is time-consuming and expensive. In this paper we represent an active remote-sensing tool for subsurface spatial imaging and analysis of electromagnetic physical properties, mostly water content, by ground-penetrating radar (GPR) reflection. Combined with laboratory methods, this technique enables real-time and highly accurate evaluations of soils' physical qualities in the field. To calculate subsurface moisture content, a model based on the soil texture, porosity, saturation, organic matter and effective electrical conductivity is required. We developed an innovative method that make it possible measures spatial subsurface moisture content up to a depth of 1.5 m in agricultural soils and applied it to two different unsaturated soil types from agricultural fields in Israel: loess soil type (Calcic haploxeralf), common in rural areas of southern Israel with about 30% clay, 30% silt and 40% sand, and hamra soil type (Typic rhodoxeralf), common in rural areas of central Israel with about 10% clay, 5% silt and 85% sand. Combined field and laboratory measurements and model development gave efficient determinations of spatial moisture content in these fields. The environmentally friendly GPR system enabled non-destructive testing. The developed method for measuring moisture content in the laboratory enabled highly accurate interpretation and physical computing. Spatial soil moisture content to 1.5 m depth was determined with 1–5% accuracy, making our method useful for the design of irrigation plans for different interfaces.
1. INTRODUCTION
Soil subsurface moisture content down to the root zone is significant for the development of agricultural crops, affecting their quality and quantity; unbalanced moisture content can influence their quality and damage them. Spatial knowledge of soil moisture content is also important for precision agriculture programs, and the expense of crop irrigation can be enormous, especially in arid and semi-arid regions (Huisman et al., 2003). However, there is no easy, quick, inexpensive and convenient method to measure subsurface spatial moisture content.
Soil moisture and salinity are currently monitored by conservative local sampling and testing methods in the field and in the laboratory, using neutron gauges, various types of tensiometers and time-domain reflectometry (Ben-Dor et al., 2009, Goldshleger et al., 2012).
In recent years, the use of active remote sensing has shown great advances: e.g., ground penetrating radar (GPR) subsurface imaging and frequency domain electromagnetic (FDEM) to measure the subsurface electrical conductivity and magnetic susceptibility combine with passive tools (Spectrometer – ASD)
spectroscopy make it possible to estimate soil properties in the field rapidly and with high precision (Ben-Dor et al., 2009; Goldshleger et al., 2004).
This study integrates active remote sensing by GPR with laboratory measurements verification and field tests to determine soil moisture content. GPR measurement of the subsurface spatial moisture content was based on a method originally developed for sand dunes, where moisture content of an unsaturated medium was determined at a resolution of a few percent (Basson et al., 1992).
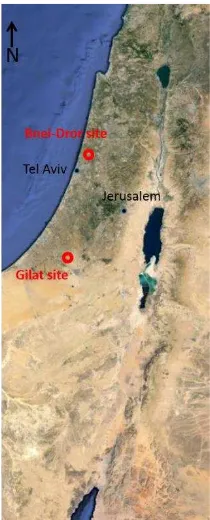
The study was performed at two main research sites in the Gilat and Sharon areas of Israel (figure 1) with their characteristic agricultural soils:
Figure 1. Map of Israel with the research sites marked with red transmitter and receiver connected directly to an antenna and a control unit. The system transmits pulses of high-frequency (MHz–GHz) electromagnetic waves to the subsurface. These waves penetrate and propagate in the medium; some of the energy returns from areas of continuous electrical properties in the medium and are received by the system (figure 2). The spatial resolution and penetration depth of the waves in the medium depend on their frequency and on the electrical properties of the soil subsurface (Ban-Dor et al., 2009). The system records the reflections and the time from transmission to reception of the reflections by the sensor. The transmitting and receiving antenna is moved along the section in a line at constant distance to obtain a continuous subsurface cross section (assuming sufficient lateral samples). Data are acquired digitally, and are constructed and displayed during the data collection, providing a good first impression of the nature of the surveyed subsurface in the field. By thorough interpretation and analysis of the sections, the electrical properties of the section components are obtained, and a shallow, high-resolution, two-dimensional (2D) subsurface image can be constructed (Davis and Annan, 1989).
Figure 2. Typical flowchart of a GPR system (Davis and Annan, 1989)
Operated conventially, the GPR system produces reflection profiles in which most returned signals are directed by reflection from discontinuities in the subsurface. Other types of waves can also be created in the system, such as direct waves in the air, wave refraction and direct ground waves, as expected from ray theory principles and simple geometric relationships. The main reflection, as well as the direct waves, can be identified directly, but only generally, in this profile.
Electromagnetic waves are influenced by diffractions created by small discontinuities and objects. In the subsurface medium diffraction can be detected as a hyperbolic reflection in a temporal section and appears in two cases: when at the dominant wavelength λc, the pulse radar is larger than the source of the diffraction, and when the waves break due to sharp edges. The physical relationship between velocity, wavelength and frequency of the electromagnetic wave is:
( 1 ) � = ��
where V = electromagnetic wave velocity λ = wavelength
f = frequency
Velocity analysis of hyperbolic reflections in the cross section is a significant factor in measuring moisture content due to the relationship between the wave velocity in the medium and the dielectric constant (Davis and Annan, 1989, Goldshleger and Basson, 2016). Calculating velocities from radar cross sections allows obtaining the values of the different dielectric constants in the medium (Topp et al., 1980). A practical approximation of the dielectric constant from wave velocity in the soil layers is
where K = dielectric constant
C = 0.3 m/ns is the wave velocity in a vacuum (Yilmaz, 1987)
V = characteristic radiowave velocity in the medium
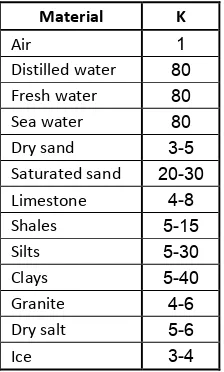
approximation, in addition to the average volumetric dielectric constant, the effective dielectric constants of the soil components (table 1) and the volume and porosity relationships between the different components are needed. These parameters can generally be found in the literature from characterizations of the soil and its constituents, or specifically obtained by field
Table 1. Typical relative permittivity observed in common geological materials (Butler, 2005)
2.2 Soil Moisture Content
The fundamental components of soils are mineral particles, organic matter, water and air. Mineral particles are inorganic materials derived from rocks by weathering. They vary in size. The pore space, organic matter and living organisms are filled with water and air. Soil water and air typically make up about 50% of the soil volume.
The volumetric effective relative dielectric constant can be described approximately as a mean value of all of the dielectric constants of the different soil components (Basson et al., 1992):
( 3 ) � ≈ ∑��=1����
where Keff = effective relative dielectric constant Ki = component dielectric constant Vi = component relative volume n = number of soil components
The moisture content, equivalent to the water relative volume, can be extracted from equation (3):
( Km = mineral dielectric constant Ka = air dielectric constant
3. METHODS
The study was based on the use of proven GPR reflection technology and mapping of the spatial subsurface (Basson et al., 1992) as a platform to develop GPR measurements of subsurface soil moisture content. The aim was to develop a
practical method for measuring subsurface moisture content in different soil types.
The research was conducted in two parts. The first consisted of high-resolution laboratory experiments, including a calibration experiment in 21-liter boxes with static 800-MHz GPR measurements, and an irrigation experiment in 270-liter soil boxes with 800-MHz GPR monitoring of cross sections, for maximum accuracy and a better understanding of the relations between the electrical properties and the soil moisture content. The second part of the research consisted of field experiments at the selected agricultural sites: Gilat area with loess soil type and Bnei-Dror area with hamra soil type. A 500-MHz antenna was used to conduct multiple cross-sectional, 2D high-resolution GPR measurements over tens to hundreds of square meters.
3.1 Laboratory Experiments and Data Acquisition
The GPR system was calibrated at a nominal frequency of 800 MHz to the research soil types in a small plastic box with a volume of 21 liters, in which the moisture content was gradually raised (by 5% for each measurement). The soil was mixed manually between measurements to rapidly create basic relative uniformity in the medium. A metal plate was laid at the bottom of the box for strong and clear reflection back to the GPR system. The soil in the box was measured by the GPR system, which was placed above the box and attached so that it would not move (static) during the finite measurement time. The GPR measurements of moisture content were compared to the volumetric moisture content of a sample that had been dried in the oven for 48 h at 105oC.
The average electromagnetic wave velocity propagation in the medium was calculated using the known depth of the metal reflector and the two-way travel time of the reflection back to the sensor. Data were analysed with a focus on the reflection from the metal plate at the box bottom, compared to evaluated time zero.
Figure 3. Soil box for laboratory irrigation experiment. Dimensions were 90 x 50 x 60 cm with a total volume of 270 liters. Inside the box, there were three iron-tube line diffractors
Soil samples for both of the laboratory experiments were taken from a similar representative area near the research sites from the surface to a depth of approximately 1 m, filtered by 4 mm sifting, packed in boxes and air-dried.
GPR cross-section measurements in the boxes used a central frequency of 800 MHz, spatial antenna separation of 14 cm, frequency sampling of about 20 GHz, lateral sampling every 1 cm along the profile, time window length of about 25 ns, 512 samples per channel and 32 stack. Each cross-section measurement was repeated three times in different fixed locations over the box width. Soil initial state was air-dried; soil moisture content was gradually increased until saturation. GPR measurements were performed 1.5–2 h after each irrigation.
3.2 Field Experiments and Data Acquisition
The radar system was operated with a transducer at a nominal frequency of 500 MHz, moved by a mobile device along the sections to give high-resolution 2D sections over different land surfaces. Soil moisture content measurements were performed in the summer, before irrigation. The distance between sections was about 50 cm over a total area of tens to hundreds of square meters. Soil samples were taken from shallow drillings for further laboratory analyses of soil properties.
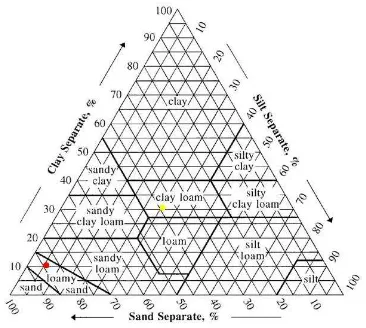
Northern Negev area – loess soil type (Calcic haploxeralf) (soil survey staff, 2014): the research site was near the Gilat Research Center for Arid & Semi-Arid Agricultural Research in the Patish basin in southern Israel. Crops there are mainly rain-fed (figure 4). The area is characterized by clay loam soil type with soil texture parameters of about 30% clay, 30% silt and 40% sand (figure 6).
Figure 4. GPR cross-section field measurement in Gilat research site in the northern Negev – loess soil type
GPR cross-section measurements at the Gilat research site (figure 1) had a central frequency of 500 MHz, antenna separation of 18 cm, frequency sampling of about 10 GHz, lateral sampling every 5 cm along the profile, time window length of about 50 ns, 512 samples per channel and 8 stack. Twenty cross sections were collected, each about 10–20 m long at distances of about 0.5 m.
Sharon Plain area – hamra soil type (Typic rhodoxeralf): the research site was near Bnei-Dror and the previous location of the Soil Erosion Station of Israel’s Ministry of Agriculture in central Israel. Crops there are mainly irrigated by drippers (figure 5). The area is characterized by a loamy sand soil type with soil texture parameters of about 10% clay, 5% silt and 85% sand (figure 6).
Figure 5. GPR cross-section field measurement in Bnei-Dror research site in the Sharon Plain – hamra soil type
GPR cross-section measurements at the Bnei-Dror research site (figure 1) had a central frequency of 500 MHz, antenna separation of 18 cm, frequency sampling of about 7.5 GHz, lateral sampling every 2 cm along the profile, time window length of about 50 ns, 400 samples per channel and 16 stack. Four cross sections were collected, each about 20 m long at distances of about 0.5 m.
4. RESULTS
The laboratory calibration experiment is shown in figure 7. The central panel shows the static GPR section, where the horizontal scale is measurement time and the vertical scale is the two-way travel time signal for travel back to the system. The left panel is the amplitude scale of the section signals, and the right panel shows a specific channel chosen from the section to calculate the time differences, where t0 (orange line) is time zero and t1 is the reflection wave from the metal plate at the bottom of the box.
Figure 7. GPR section in the calibration box. Amplitude scale is shown on the left and a specific trace on the right. Upper orange line is time zero (t0), lower orange line is the reflection from the
metal bottom (t1).
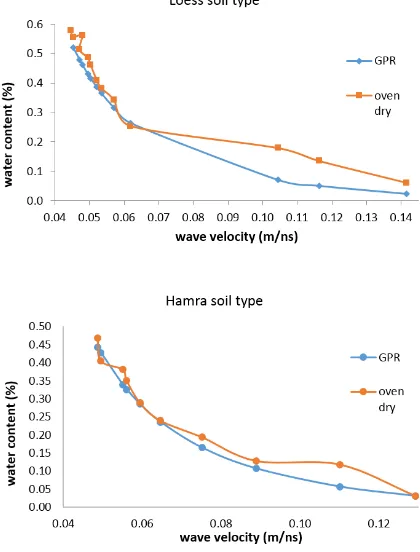
Calibration experiment results in figure 8 show the difference between the soil water content measurements in the calibration process and the theoretical water content.
Figure 8. Measured GPR and oven-dry moisture content as a function of the electromagnetic wave velocity. The measured calibration data were collected with a 1 GHz GPR antenna on
loess (upper figure) and hamra (lower figure) soil types irrigated with distilled water.
Laboratory GPR sections showed the change in electrical properties with irrigation steps for each soil. The higher water content directly affected the electromagnetic wave velocity propagating through the media as well as the relative dielectric constant, and therefore changed the GPR image.
To visualize the laboratory experiments in the soil boxes designed to measure the soil water content using GPR, we performed simulations with the geophysics software Reflex-Win and different possible models. The model size was based on the soil boxes (90 x 50 x 60 cm) (figure 3) with three diffractors at 10, 30 and 50 cm. The distance between the diffractors was 20 cm and from the box edges, 25 cm. The electromagnetic properties controlling the models were the dielectric constant, electrical conductivity and wave velocity. The simulation was based on finite difference algorithm to propagating waves in the medium; the section was a zero-offset 2D section with parameters of dx = 1 cm, dT = 0.02 ms and frequency of 800 MHz (figure 9).
Figure 9. GPR simulation section in a soil box with three iron diffractors at 10, 30 and 50 cm depth and a reflector at 60 cm
depth.
The GPR section after basic data analysis and interpretation is shown in figure 10. The measurement was performed on the soil in an initial air-dried state. The hyperboles created by the first and second diffractors can be identified at depths of 10 cm and 30 cm, respectively, while the third diffractor at 50 cm depth is not clear, probably due to wave interference from the edges or bottom of the box. The reflection from the bottom can be identified as well. The average electromagnetic velocity in the medium was about 0.125 m/ns.
t0
Figure 10. GPR section from laboratory experiment with central frequency of 800 MHz. The horizontal scale is the location of the measurement along the section, the left vertical scale is the signal travel time and the right vertical scale is the depth, assuming a uniform electromagnetic velocity of 0.125 m/ns.
Amplitude scale is given on the right.
GPR measurement data from Gilat and Bnei-Dror sites, mostly obtained at 500 MHz nominal frequency and some at 1 GHz nominal frequency, were processed specifically to highlight the diffraction waves. The diffraction shape can be analysed and fitted to a hyperbola curve which describes the relevant electromagnetic wave velocity (figure 11).
Figure 11. Analysis of diffraction electromagnetic velocities after processing in a GPR section from Bnei-Dror research site. Horizontal scale describes the location of the measurement and
vertical scale describes the time/depth for the reflections. Amplitude scale is given on the right.
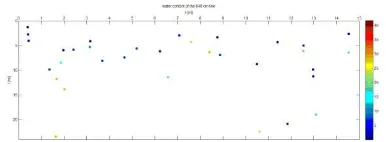
From the electromagnetic wave velocity, we calculated the soil moisture content in the subsurface using a model relying on theoretical knowledge, the information from the GPR laboratory experiments and other laboratory-measured soil properties such as porosity and texture (figure 12).
Figure 12. Subsurface soil moisture content calculated from the electromagnetic wave velocity using a simple model based on
information from the laboratory experiment.
5. CONCLUSIONS
Moisture content was gradually increased by known volumes in the laboratory experiments, and by measuring the GPR reflections and diffraction times we could calculate the electromagnetic wave velocity through the different media. We converted the electromagnetic velocities into a dielectric constant and used a model to obtain the subsurface soil moisture content.
GPR is not widely accepted as a method to measure subsurface soil water content. However, in recent years, GPR instrumentation has seen intensive development, allowing faster, easier and most importantly, more accurate soil moisture content measurements. Hence, spatial resolution has improved, particularly for this application where the required penetration depth is low, so that small heterogeneities in the field can be used to obtain information on the relative permittivity and analyzed to calculate soil moisture content.
We presented a GPR method to measure subsurface soil moisture content. This method currently relies on calibration tests in the laboratory and in the field for a better understanding of petrophysical property relations between permittivity and volumetric moisture content. Further studies are needed for more information on this issue.
This method can be performed without the calibration experiments but some knowledge is required to build a simple and reliable model that will describe the relationship between the electrical characteristics of the medium and its moisture content. It is recommended to compare the GPR measurement results to those from other proven methods (e.g., oven-drying) to increase result accuracy and reliability.
6. REFERENCE
Basson, U., Gev, I., and Ben-Avraham, Z., 1992. Mapping shallow stratigraphy of dunes and moisture content with a ground penetrating radar. Israel Geological Society annual meeting, 30 Mar–1 Apr, Ashkelon, Israel, p. 17.
Ben-Dor, E., Goldshleger, N., Eshel, M., Mirablis, V., and Basson, U., 2008. Combined active and passive remote sensing methods for assessing soil salinity. In: Remote Sensing of Soil Salinization Impact and Land Management (Metternicht, G., and Zinck, A., eds.). CRC Press, pp. 235–255.
Ben-Dor, E., Taylor, R. G., Hill, J., Dematte, J. A. M., Whiting, M. L., Chabrillat, S., and Sommer, S., 2008. Imaging spectrometry for soil applications. Adv. Agron. 97, 321–392.
Ben-Dor, E., Chabrillat, S., Demmatte, J. A. M., Taylor, G. R., Hill, J., Whiting, M/ L., and Sommer, S., 2009. Using Imaging Spectroscopy to study soil properties. Remote Sens. Environ. 113, S38–S55 Supplement 1.
Butler, D. K., 2005. Near-Surface Geophysics. Society of Exploration Geophysicists, Tulsa, OK, USA.
Davis, J. L., and Annan, A. P., 1989. Ground penetrating radar for high-resolution mapping of soil and rock stratigraphy. Geophysical Prospecting, 37, 531–551.
Huisman, J. A., Hubbard, S. S., Redman, J. D., and Annan A. P., 2003. Measuring soil water content with ground penetrating radar: a review. Vadose Zone Journal, 2, 476–491.
Goldshleger, N., Ben Dor, E., Benyamini, Y., and Agassi, M., 2004. Soil reflectance as a tool for assessing physical crust arrangement of four typical soils in Israel. Soil Science, 169(10), 677–687.
Goldshleger, N., Livene, I., Chudnovsky, A., and Ben-Dor, E., 2012. Integrating passive and active methods to assess soil salinity: a case study from Jezre’el Valley, Israel. Soil Science, 177(6), 392–401.
Goldshleger, N., and Basson, U., 2016. Utilization of ground penetrating radar and frequency domain electromagnetic for investigation of sewage leaks. Remote Sensing of Environment (Proof).
Reynolds, J. M., 2011. An Introduction to Applied and Environmental Geophysics. Wiley-Blackwell.
Soil Survey Staff, 2014. Keys to Soil Taxonomy, 12th ed. USDA-Natural Resources Conservation Service, Washington, DC.
Topp, G. C., Davis, J. L., and Annan A. P., 1980. Electromagnetic determination of soil water content: Measurements in coaxial transmission lines. Water Resources Research, 16, 574–582.