PERFORMANCE ASSESSMENT OF FULLY AUTOMATIC THREE-DIMENSIONAL
CITY MODEL RECONSTRUCTION METHODS
Beril Sirmacek, Hossein Arefi, Thomas Krauss
German Aerospace Center (DLR), Earth Observation Center (EOC) PO Box 1116, 82234, Wessling, Germany
(Beril.Sirmacek, Hossein.Arefi, Thomas.Krauss)@dlr.de
Commission III/4
KEY WORDS:Building, Modelling, City, DSM/DTM
ABSTRACT:
Three-dimensional urban region representations can be used for detailed urban monitoring, change and damage detection purposes. In order to obtain three-dimensional representation, one of the easiest and cheapest way is to use Digital Surface Models (DSMs) which are generated from very high resolution stereo satellite images using stereovision techniques. Unfortunately after applying the DSM generation process, we cannot directly obtain three-dimensional urban region representation. In the DSM which is generated using only one stereo image pair, generally noise, matching errors, and uncertainty on building wall locations are very high. These undesirable effects prevents a DSM to provide a realistic three-dimensional city representation. Therefore, some automatic techniques should be applied to obtain three-dimensional city models using DSMs as input. In order to solve the existing problems in this field, herein we introduce two automated approaches based on usage of DSMs as input. The first method depends on using of a 3D active shape model for building shape extraction and 3D reconstruction, the second approach is based on an approximation of prismatic models to DSMs. Our experimental results on images and DSMs of Tunis city which are obtained from WorldView-2 satellite indicate possible usage of the proposed algorithms to obtain three-dimensional city representations automatically.
1 INTRODUCTION
Three-dimensional representations of complex environments ob-tained a lot of interest for various applications with the develop-ment of satellite sensor technology. In order to obtain 3D repre-sentations of cities, one of the most practical method is to gen-erate Digital Surface Models (DSMs) using very high resolution satellite images which are taken from two or more viewing an-gles. Unfortunately, due to occlusions, matching errors, and ap-plied interpolation techniques these DSMs do not represent 3D city models directly. Automatically generated DSMs do not con-tain sharp wall and rooftop representations. Therefore, in order to obtain real 3D city representations, advanced methods should be applied to DSMs.
In the related literature, Brunn and Weidner (Brunn and Weidner, 1997) used surface normals on DSM to discriminate buildings and vegetation. After detecting buildings, they measured the ge-ometry of rooftops using surface normals and they interpolated polyhedral building descriptions to these structures. Fradkin et al. (Fradkin et al., 1999) proposed a segmentation based method to reconstruct three-dimensional models of dense urban areas. To this end, they used very high resolution color aerial images and disparity maps. Canu et al. (Canu et al., 1996) used a high res-olution DSM, which is obtained by stereo matching techniques, in order to reconstruct three-dimensional buildings. First, they segmented the DSM into homogeneous regions. Then, they in-terpolated flat surfaces on these regions. Ortner et al. (Ortner et al., 2002) used a point process (Jacobsen, 2005) to model ur-ban areas. They represented urur-ban areas as interacting particles where each particle stands for an urban object. Preknowledge about building shapes is used to model these particles. Arefi et al. (Arefi et al., 2008) extracted above-ground objects from LI-DAR data. Then, three-dimensional buildings are reconstructed by hierarchical fitting of minimum boundary rectangles (MBR) and a RANSAC based straight line fitting algorithm. Tournaire
rooftop-type.
Herein, we introduce two different fully automatic techniques to generate 3D city models from DSMs. Both methods need a DSM and a segmentation result as inputs. The input DSM is gener-ated from stereo satellite images by using the semi-global match-ing (SGM) approach based on combination of census and mutual information. The segmentation result is obtained automatically from the DSM by deriving a terrain model (DTM) and fusing the derived high object mask with vegetation and water masks derived from the pansharpened multispectral ortho images fitting on the DSM.
The first 3D modeling approach consists of three main modules as: detection of building shapes, rooftop classification, and 3D reconstruction based on the detected shapes and rooftop classes. This approach extracts seed-point locations from the segmenta-tion result which indicate approximate building regions. A novel active rectangular shape growing approach is used on these seed-point locations to approximate the building shapes on the DSM. Afterwards, using derivative filters on DSM, we extract roof ridge-lines automatically. Obtained ridge-line information helps to clas-sify building rooftops as flat or gable shapes. Finally, regarding the rooftop class we assign rooftop models to our 3D model.
The second 3D reconstruction approach is based on hierarchi-cal approximation and merging the segmented regions providing prismatic models of the buildings according to LOD1 of CityGML standard. Building footprints are approximated into regular poly-gons by reducing the boundary pixels into the most significant nodes which preserve the shape and size of the original segment. The building shapes are first classified into rectilinear and non-rectilinear by measuring the orientation of the edges. For a rect-angular building containing one main orientation of the edges a method based on Minimum Bounding Rectangle (MBR) in em-ployed. In contrast, a Combined Minimum Bounding Rectangle (CMBR) approach is proposed for regularization of non-rectilinear polygons, i.e. buildings with not perpendicular edge directions. Both MBR- and CMBR-based approaches are iteratively employed on building segments to reduce the original building footprints to a minimum number of nodes with maximum similarity to orig-inal shapes. Forig-inally, prismatic models (LOD1) are created by computing an average height of the internal building pixels and generating the roof and wall polygons.
2 OBTAINING BUILDING SEGMENTS
For the extraction of building segments first a spectral classi-fication using a rule based fuzzy method and second a deriva-tion of a digital terrain model (DTM) from the digital surface model (DSM) delivered from the semi global matching algorithm (SGM) is derived.
The rule based fuzzy classification uses the two fuzzy functions
Fuzzy updefined asf+
together with the logical functionsFuzzy
andTf
(a, b, . . .) = min(a, b, . . .)andFuzzy orSf
(a, b, . . .) = max(a, b, . . .). The rules used for the classification are based on the channels of WorldView-2 (coastal, blue, green, yellow, red, red-edge, near infrared, second near infrared) denoted as
(C, B, G, Y, R, E, N, S) and the three ratio functionsndvi =
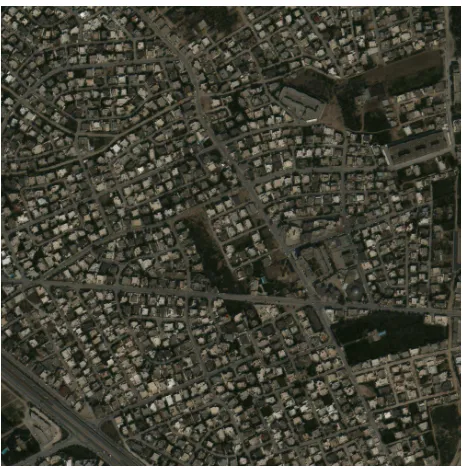
Figure 1: Top-Of-Atmosphere (TOA) reflections image showing a section 1 km×1 km from a WorldView-2 triple-stereo-scene acquired 2011-04-13 over Tunis, channels 2, 3 and 5 (blue, green, red)
and shadow (σ) are defined on the previously calculated top-of-atmosphere (TOA) reflectances image in[%](Fig. 1) as:
v= f+
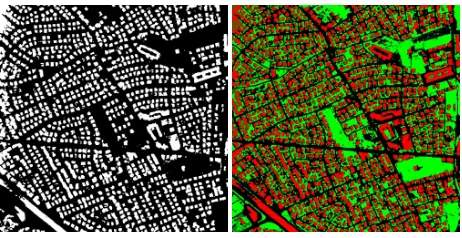
Obtaining from these fuzzy results ranging from 0 to 1 the binary masks shown in Fig. 2 the limitsw >0.59,v >0.89,s >0.59 andσ >0.25are applied.
In the second step a digital terrain model (DTM) is derived from the generated digital surface model (DSM). For this the DSM is scaled down by an factor of eight filling already small unmatched (no-data) regions. Afterwards a morphological grayscale open-ing usopen-ing a structuropen-ing element of radius 20 (i.e.20×8×0.5m) with a 10 % or 90 % percentile respectively is used filling also remaining no-data areas. Applying the final rescaling to original size gives the filled DTM as shown in Fig. 3. Subtracting the DTM from the DSM provides us with the so called normalized digital elevation model (nDEM) which gives the heights of ob-jects above ground. A profile showing the connection between DSM, DTM and nDEM is shown in Fig. 3, right. The red marked objects are the building segments used in the following steps.
Figure 2: Classifications derived from pan sharpened TOA im-age, left: water (blue), vegetation (green), sealed/soil (red), dry vegetaion (yellow), right: water (blue), vegetation (green), shadow (red), shadow+vegetation (yellow, mostly near trees)
40
Figure 3: Left: Overlay of DSM (green), DTM (blue) and nDEM (red) of of Tunis area with depicted profile line (red); right: pro-files along profile line: DSM (red), DTM (green) and nDEM (blue) (heights in meter above WGS84 ellipsoid)
structuring element: 2 px) gives thehigh objectsfrom the nDEM (cf. Fig. 4, left). Combining the classification and these high ob-jects mask gives the classes buildings (high and non-vegetation), trees (high and vegetation), ground (all non high objects includ-ing water, vegetation and non-vegetation areas) as shown in Fig. 4, right.
Figure 4: Left: High objects mask, right: final classification, red: buildings, green: low vegetation, dark green: trees, blue: water
3 THREE-DIMENSIONAL CITY MODEL RECONSTRUCTION
In this section, we introduce two different approaches for three-dimensional city model reconstruction. In the experiments sec-tion, we compare these two different approaches and discuss about their detection capabilities, advantages and disadvantages.
3.1 Active Shape Growing Based Approach
The active shape growing approach is our first 3D city model reconstruction approach. This approach is based on three main modules as: active shape growing for shape detection, detecting building rooftop type, and finally we use detected the shapes and rooftop types to generate 3D models.
3.1.1 Box-Fitting for Shape Detection For detecting com-plex building shapes, herein we follow a similar methodology as represented in the previous study (Sirmacek et al., 2011). How-ever instead of using a binary active shape growing approach in each seed-point location, we propose a novel active shape grow-ing approach based on usage of three-dimensional information. To do so, after extracting(xs, ys)seed point locations as we
de-scribe in (Sirmacek et al., 2011) in detail, we start to grow our active rectangular shapes in each seed point location by regarding the hight information. We assume that(xn
v, yvn)array holds the
pixel coordinates fornth edge of the virtual rectangular shape. It-eratively, we sweep each edge to the outwards growing direction if the edge pixels satisfy(max(D(xn
v, yvn))−min(xnv, ynv)< δ)
inequality (n∈[1,2,3,4]). Here, theδthreshold is the minimum building height that we would like to detect in the region.
In our application we assumeδas equal to 3, which means that we assume the buildings to be higher than 3 meters to be de-tected. When the growing process stops for each edge, we cal-culate the final energy value by using the equation that we rep-resent in Eqn. 5. In the equation, m(.) represents the mean value. For the same seed-point, we apply growing process for allθ∈[0, π/6, π/3, π/2,2π/3, ...,2π]angles withθdif =π/6
radian turning steps. As we discussed in detail in (Sirmacek et al., 2011), by reducingθdif step sizes, we can obtain more
ac-curate approximations, however in this case we need more com-putation time. After calculatingEθfor allθangles we pick the
estimated box which shows the highestEθ energy as detected
building shape. Since most buildings appear like composition of rectangular building segments, it makes sense to extract rect-angular shapes on buildings. The main advantage of using the box-fitting approach is that approximate building shapes still can be found even if the building edges are not well-determined, or even if there are trees adjacent to the building facades. However, other region growing algorithms fail to extract an object shape in these cases, since the growing region can flow out easily when the parameters are not set precisely.
Eθ= 4×m(BD(x, y)×Di(x, y))−
For complex buildings, after fitting a chain of boxes, discontinu-ity between adjacent boxes should be smoothed. For this purpose, we simply benefit from morphological operations. First, we start with filling inside of the detected binary boxes with1value in
BB(x, y)binary mask. Then, we apply morphological dilation
and erosion operations respectively to the detected boxes, using a disk shaped structuring element with radius1. After this opera-tion small discontinuity between adjacent boxes can be smoothed. Final improved building shapes are kept in newB(x, y)binary mask.
3.1.2 Classification of Building Rooftops After detecting build-ing groundfloor shapes, we focus on reconstruction of rooftops. For this purpose, we benefit from our previous ridge-line detec-tion approach which is presented in (Sirmacek et al., 2011).
The ridge-line detection approach is based on derivative calcula-tion over the DSM. We use the following derivative filter. For a symmetric Gaussian functionG(x, y) =exp(−(x2+y2)), it is
possible to define basis filtersGp0andGpπ
Gpπ
We can find a derivative in an arbitraryθdirection using follow-ing filter function,Gpθ=cos(θ)Gp0+sin(θ)Gpπ
2
We convolve our DSM with this derivative filter inθ∈[0, π/12, ...,23π/12]directions as follows,Jθ=D(x, y)∗Gpθ
Ifθangle is perpendicular to the building ridge-line orientation, then one side of the building rooftop gives positive response, and the other side of the building rooftop gives negative response to filter. AssumingBj(x, y)
is the jth connected component inB(x, y)binary building segment matrix, we assume that two sides of the building rooftop (RPθjandRN
j
Since we have no pre-information about building orientations, we should do the derivative filtering in all possible orientations. Therefore, we calculateP
θRL j
θ forθ ∈ [0, π/12, ...,23π/12]
directions. Building ridge-line will be extracted inθj filtering
angle which is almost perpendicular to the ridge-line orientation. However the ridge-line will be also detected inθj−π/12and θj+π/12neighbor filtering directions. Therefore, the ridge-line
will have a value of higher than 2 in theP
θRL j
θ result. As a
result, ridge-line ofjth building rooftop can be obtained by cal-culatingRj(x, y) = P
θRL j
θ > 2and eliminating connected
components which are less than 10 pixels in order to eliminate redundant information coming from small objects on rooftop.
Next, we use detected ridge-lines for roof-type classification and three-dimensional rooftop model reconstruction purposes. We benefit from detected roof ridge-lines to classify rooftops as’flat roof ’or’gable roof ’type. If there is no ridge-line detection re-sult on a building segment, we assume that building as flat roof. If there is a ridge-line on thejth building segment, then we late mean of DSM height values on ridge-line location by calcu-latingX
(x,y)
Rj(x, y)
×D(x, y)/M, whereMis the total number of ridge-line pixels inRj(x, y)binary matrix. We also calculate
mean of DSM height values on building border by calculating
P
(x,y)B
j(x, y)×D(x, y)/N
, whereN holds the total num-ber of building border pixels inBj(x, y)
binary matrix. If the difference between these two mean values is lower than 2 me-ters, then we assume the rooftop as aflat rooftop. Otherwise, it is assumed asgable rooftop. This 2 meters criteria is obtained by observinggable rooftopcharacteristics over test area.
3.1.3 Obtaining Three-Dimensional Representation We start with generating a zero matrixD2(x, y)with the same size with
D(x, y)matrix. New height values belonging to objects in the city will be stored inD2(x, y)matrix. In order to eliminate noise in non-built regions, we apply median filtering to the original DSM (D(x, y)) by using a3×3pixel size window obtaining a filtered DSM (Df(x, y)). For non-builtup areas, or in other
areas for(x, y)coordinates which satisfyB(x, y) = 0, we ap-plyD2(x, y) = Df(x, y). That means: we assign smoothed
ground height values for non-built regions. As building wall, we insert single height value to each building boundary which is
stored inB(x, y)binary building shape matrix. For each build-ing, the building height value is assigned by calculating the mean ofD(x, y)values on all building boundary pixels. After smooth-ing the noise on the ground and insertsmooth-ing sharp buildsmooth-ing walls, finally rooftop height values are assigned to D2(x, y) matrix. Rooftop height assignment is done by considering the roof-type. If the roof is classified as a flat roof, then only a single height value is assigned to all building area which is equal to building wall heights. If the rooftop is classified as a gable-roof, we fol-low different approaches depending on the building complexity. If the building is not detected as a complex building as struc-ture type (if the Euler number is equal to1), then we can find polygons which defines the rooftop in three-dimensional space. To this end, we detect corners of building segment using Har-ris corner detection algorithm (HarHar-ris and Stephens, 1988) over panchromatic image of the test region. Besides, we also detect endpoints of the building ridge-line. We pick each building cor-ner one by one. Then, we find the closest ridge-line endpoint. A line between building corner and the closest ridge-line end-point can divide the rooftop into polygons. A detailed demon-stration of this approach is illustrated in (Sirmacek et al., 2011). Height values of rooftop polygons are assigned to corresponding pixels inD2(x, y)matrix. If the building is detected as a com-plex structure or if the building ridge-line could not be extracted properly, unfortunately we cannot use the same idea for building rooftop reconstruction and more advanced rooftop reconstruction approaches are needed. Herein we leave the building rooftop re-construction at this level. For complex building rooftops and for rooftops for which we cannot extract the ridge-line properly, we only insert corresponding pixel values fromDf(x, y)matrix. 3.2 Hierarchical Generation of 3D Prismatic Models of
Build-ings
An approach is presented to extract 3D model of buildings ac-cording to LOD1 (Level-of-Detail 1) based on CityGML standard (Kolbe et al., 2005). The approach starts with approximation and regularization of the building boundaries. Two algorithms are proposed for approximation of the building polygons based on the main orientation of the buildings (Arefi et al., 2007). The algorithms are selected according to the number of main orienta-tions of the buildings and implemented as follows:
• If the building is formed by a rectilinear polygon, i.e., sides are perpendicular to each others from the top view, a method based on Minimum Bounding Rectangle (MBR) is applied for approximation. This method is a top-down, and model-based approach that hierarchically optimizes the initial rec-tilinear model by fitting MBR to all details of the data set. Principles of MBR based polygon approximation is presented in Figure 5.
(e) New regions produced by subtraction of (c) and (d)
(f) Superimposed final rectilinear polygons (red) on DEM
Figure 5: MBR based polygon approximation
rotated back to original orientation (Fig. 5(f)). In this figure the red lines highlight the rectangular polygons.
• If the building is not rectilinear, i.e., at least one side is not perpendicular to the other sides, a method based on RAn-dom Sample Consensus – RANSAC (Fischler and Bolles, 1981) is applied for approximation.
RANSAC was originally devised to robustly fit one single model to noisy data. It turns out, however, that it can also successfully be used to fit a beforehand unknown number of models to the data: In the case of the ground plan bound-aries the number of line segments is initially unknown. We simply apply the method repeatedly – always deleting the already fitted given points from the input data – until either:
a) we consider the lines found so far sufficient to construct the ground plan completely or
b) the number of points fitting to the best line segment with respect to the current iteration step falls below a chosen thresholdt.
In this algorithm the straight lines are repeatedly extracted using RANSAC algorithm and merged to form the final poly-gon. Figure 6 shows the RANSAC based approximation of the same building represented in Figure 5.
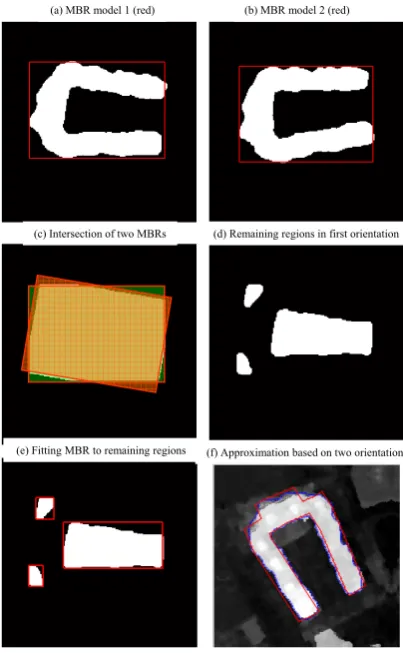
As an alternative to the RANSAC based approximation algo-rithm, a method similar to MBR-based is proposed for the build-ings containing several orientation directions. The method called Combined Minimum Bounding Rectangle (CMBR) based algo-rithm for hierarchical approximation of non-rectangular polygons. In this method, based on each orientation a MBR (rectangle) polygon is estimated as first approximation level, as shown in Figure 7(a and b).
Intersection of the rectangles corresponding to each orientation produces the first approximation of non-rectangular building (Fig.
Figure 6: Approximation of polygon obtained using RANSAC
(a) MBR model 1 (red) (b) MBR model 2 (red)
(c) Intersection of two MBRs (d) Remaining regions in first orientation
(e) Fitting MBR to remaining regions (f) Approximation based on two orientations
Figure 7: CMBR based polygon approximation
7(e), yellow region). The first approximation area is subtracted from original binary region to generate the remaining regions which should be approximated. The process is continued, simi-lar to the MBR-based method but using all orientation directions, until no more regions remain or remaining regins contain small number of pixels. Figure 7(f) illustrates the final approximation result of the sample building by using two main orientations. The approximation result could be improved by taking into account more significant orientations.
CMBR-based, have been utilized to approximate buildings con-taining rectangular and non-rectangular outlies.
Figure 8: Building outline approximation (green polygons)
Figure 9: Approximation result (Binary regions) (in detail view)
Figures 8 and 9 show the approximation results of the extracted building outlines using classification technique presented in this paper. For a final 3D reconstruction of the buildings, an average height is estimated for each building to shape prismatic model. For each building, the prismatic model is shaped using average height and polygon nodes which are extracted by approximation approaches. The polygons are merged to form prismatic models as illustrated in Figure 10. Additional 3D representation is pro-vided by superimposing the ortho rectified image of correspond-ing area to the 3D prismatic models models (Fig. 11).
Figure 10: 3D prismatic models
Figure 11: Superimposing of ortho rectified image on 3D pris-matic models (zoomed to a smaller region)
4 EXPERIMENTS
the best approach is to use LIDAR data of the same region for comparison. Unfortunately, for the test region the LIDAR data does not exist. Therefore, the height estimation of the results are checked by comparing the mean of building height differences from the ground in result data and in nDSM data. In this com-parison, the active shape model based approach gave 0.586 meter difference value, and the prismatic model based approach gave 0.724 meter difference value. The low differences of the build-ing height values from nDSM data indicates the reliable results of the proposed automatic approaches in building height assignment steps.
5 CONCLUSIONS
Herein, we introduced two different approaches for automatically 3D city model generation using DSMs which are obtained from very high resolution satellite images. Besides proposing new ap-proaches for 3D model generation, we provided quantitative com-parisons of the 3D models based on building shape detection and height estimation performances. In order to give an insight view to the reader, we also discussed computation time requirements and implementation difficulties of those approaches. To test our algorithms we used two test areas which have completely differ-ent structuring types. We used DSMs obtained over Munich and Tunis cities by using WorldView-2 satellite sensors. However, the final assessment prove that the methodologies lead to very good results. We believe that the results can also assist the applications like detailed city monitoring, change detection, urban structure analysis, planning, damage investigations, and population assess-ments.
REFERENCES
Arefi, H., Engels, J., Hahn, M. and Mayer, H., 2007. Approx-imation of building boundaries. In: Urban Data Management Systems (UDMS) Workshop, Stuttgart, pp. 25 – 33.
Arefi, H., Engels, J., Hahn, M. and Mayer, H., 2008. Levels of de-tail in 3d building reconstruction from lidar data. In Proceedings of International Archives of Photogrammetry, Remote Sensing, and Spatial Information Sciences 37, pp. 485–490.
Brunn, A. and Weidner, U., 1997. Extracting buildings from dig-ital surface models. In Proceedings of International Archives of Photogrammetry, Remote Sensing, and Spatial Information Sci-ences.
Canu, D., Gambotto, J. and Sirat, J., 1996. Reconstruction of building from multiple high resoltion images. In Proceedings of International Conference on Image Processing.
Fischler, M. A. and Bolles, R. C., 1981. Random sample con-sensus: A paradigm for model fitting with applications to im-age analysis and automated cartography. Communications of the ACM 24(6), pp. 381–395.
Fradkin, M., Roux, M., Maitre, H. and Leloglu, U., 1999. Surface reconstruction from multiple aerial images in dense urban areas. In Proceedings of IEEE Computer Vision and Pattern Recogni-tion 2, pp. 262–26.
Harris, C. and Stephens, M., 1988. A combined corner and edge detector. Proceedings of 4th Alvey Vis. Conf. pp. 147–151.
Jacobsen, M., 2005. Point-process theory and applications: Marked point and piecewise deterministic processes (Probability and its applications). First edition edn, Birkhaeuser Boston.
Kolbe, T. H., Gr¨oger, G. and Pl¨umer, L., 2005. CityGML - Inter-operable Access to 3D City Models. In: International Symposium on Geo-information for Disaster Management, Springer Verlag.
Maas, H., 1999. Fast determination of parametric house mod-els from dense airborne laserscanner data. ISPRS Workshop on Mobile Mapping Technology, Bangkok, Thailand.
Ortner, M., Descombes, X. and Zerubia, J., 2002. Building ex-traction from digital elevation models. INRIA Research Report.
Sirmacek, B., Taubenboeck, H., Reinartz, P. and Ehlers, M., 2011. Performance evaluation for 3-d city model generation of six different dsms from air- and spaceborne sensors. IEEE Jour-nal of Selected Topics in Applied Earth Observations and Remote Sensing 1 (99), pp. 1939–1404.
Tournaire, O., Bredif, M., Boldo, D. and Durupt, M., 2010. An ef-ficient stochastic approach for building footprint extraction from digital elevation models. ISPRS Journal of Photogrammetry and Remote Sensing 65 (4), pp. 317–327.