Change Detection Based on Persistent Scatterer Interferometry
- A New Method of Monitoring Building Changes
C. H. Yang a, *, B. K. Kenduiywo b, U. Soergel a
a Institute for Photogrammetry, University of Stuttgart, Germany – (yang, soergel)@ifp.uni-stuttgart.de b
Institute of Geodesy, Technische Universität Darmstadt, Germany - [email protected]
Theme Sessions, ThS 6
KEY WORDS: Persistent Scatterer Interferometry (PSI), Synthetic Aperture Radar (SAR), Interferometric Synthetic Aperture Radar (InSAR), Change Detection, Urban Monitoring
ABSTRACT:
Persistent Scatterer Interferometry (PSI) is a technique to detect a network of extracted persistent scatterer (PS) points which feature temporal phase stability and strong radar signal throughout time-series of SAR images. The small surface deformations on such PS points are estimated. PSI particularly works well in monitoring human settlements because regular substructures of man-made objects give rise to large number of PS points. If such structures and/or substructures substantially alter or even vanish due to big change like construction, their PS points are discarded without additional explorations during standard PSI procedure. Such rejected points are called big change (BC) points. On the other hand, incoherent change detection (ICD) relies on local comparison of multi-temporal images (e.g. image difference, image ratio) to highlight scene modifications of larger size rather than detail level. However, image noise inevitably degrades ICD accuracy. We propose a change detection approach based on PSI to synergize benefits of PSI and ICD. PS points are extracted by PSI procedure. A local change index is introduced to quantify probability of a big change for each point. We propose an automatic thresholding method adopting change index to extract BC points along with a clue of the period they emerge. In the end, PS ad BC points are integrated into a change detection image. Our method is tested at a site located around north of Berlin main station where steady, demolished, and erected building substructures are successfully detected. The results are consistent with ground truth derived from time-series of aerial images provided by Google Earth. In addition, we apply our technique for traffic infrastructure, business district, and sports playground monitoring.
* Corresponding author
1. INTRODUCTION
The continuous rise in population has led to rapid expansion of cities. Consequently, there are intense infrastructure development and building construction leading to frequent urban change which requires monitoring of complementary data. Conventional field survey monitoring are expensive and at such scale time taking. Remote Sensing by imaging radar offers an efficient and cost effective means of monitoring.
Synthetic Aperture Radar (SAR) is a remote sensing technique providing radar-based images. Radar sensors are capable of day-and-night vision regardless of weather conditions. In addition, SAR images may cover vast areas in short time with considerable fine spatial resolution. For example, a single TerraSAR-X (TSX) image covers standard scene size of 30 km by 50 km in Stripmap mode. Its temporal and spatial resolutions are 11 days and about 3 m respectively. These capabilities make SAR suitable for monitoring and change detection tasks. Two applications based on multi-temporal SAR images are Persistent Scatterer Interferometry (PSI) and incoherent change detection (ICD). They are designed to detect dynamic small deformation in the order of mm/year and any type of change, e.g. building construction, respectively.
Persistent Scatterer Interferometry (Ferretti et al., 2000; Ferretti et al., 2001; Hooper et al., 2004; Kampes, 2006) is used to determine line-of-sight (LOS) velocities of so-called persistent
scatterer (PS) points on ground using multi-temporal SAR images. Other attributes of PS points like height and geographic position can be retrieved as well. PSI is an opportunistic geodetic approach given that PS points are generated from objects regardless of nature and location. As a result, PS density can vary strongly and voids of considerable size frequently occur. Nevertheless, PSI works well especially for monitoring human settlements because of dominant regular structured objects that give rise to persistent and strong signal due to multi-bounce reflection.
is because more PS points are expected and targets of interest can be small substructures like windowsills on facades.
A prerequisite in PSI is that signals throughout time-series of SAR images must remain coherent for extraction of PS points. In case big changes occur, massive modifications of scene cause loss of coherence. Usually, in PSI analysis it is assumed that except for surface motion scene is steady and does not undergo any big change. A typical scenario is a building that remains unchanged for a long period and has several suitable persistent scattering substructures. This means, over an acquisition period of SAR image stack, no renovation or demolition activities should occur to prevent coherence loss. In this case, the PS points located on them can be extracted. On the other hand, if such substructures substantially alter or even vanish due to any big change, in conventional PSI the PS points are discarded without additional explorations. Such rejected points are called big change (BC) points. Therefore, alternative techniques are necessary to detect such big changes.
Incoherent change detection (ICD) (Preiss and Stacy, 2006) can tackle various change types rather than just small deformation detectable in PSI. It measures variance of grey values in time-series of SAR images (mostly a pair of pre- and post-event images) to determine scene changes. To manifest detectable alterations in connected grey values, changes must be big enough with regard to both scene modification and spatial size such as demolished buildings. Conventional approaches like image differencing or image ratioing (Hussian et al., 2013) directly compare multi-temporal (transformed) grey values to highlight and detect altered scenes. No matter whether amplitudes/coherences/phases of SAR image pairs are used for analysis, image noise leads to errors. Given that in ICD noise is modelled as spatially uncorrelated, such negative effect can be mitigated by low-pass spatial filtering. However, this process inevitably comes along with loss of detail.
In this paper, we introduce Change Detection based on PSI (CDPSI) approach to integrate advantages of PSI and ICD. With exception of PSI, this method can be easily extended to other time-series interferometric SAR (InSAR) techniques like SqueeSAR (Ferretti et al., 2011). The approach is able to estimate small deformations of PS points and at the same time detect BC points along with an approximate period they emerge. A local change index is introduced to quantify probability of a big change for each point. We propose an automatic thresholding technique adopting change index to extract BC points. Outliers are then removed by filtering. Finally, PS and BC points are integrated into a change detection image.
In Section 2, we describe PSI concept and focus on CDPSI approach. In section 3, we interpret CDPSI in detail. Section 4 illustrates tests using CDPSI on a site located at the centre of Berlin. Here steady, demolished, and erected buildings are successfully recognized. We also apply our method to monitor traffic infrastructures, business district, and sports playground. Section 5 presents research conclusions and outlines possible future works.
2. PERSISTENT SCATTERER INTERFEROMETRY Persistent Scatterer Interferometry is a technique for extracting PS points along with their attributes. It requires a time series of
N complex SAR images acquired from the same orbit and covering a common extent. From the series, an optimal master image is chosen with respect to a small baseline constraint
(Berardino et al., 2002; Lanari et al., 2004) to minimize phase noise caused by geometrical and temporal decorrelation. After precise co-registration to master scene, N-1 interferograms between the master to all slave images are calculated. Both relative height and line-of-sight velocity are later derived from the interferogram stack which represents the differential phases between the SAR images. Generally, a set of PS candidates is detected by thresholding the amplitude dispersion of a pixel vector over the stack or the signal to clutter ratio in a local scene. A Periodogram grid search (Ferretti et al., 2001) is then conducted to maximize temporal coherences [0,1]∈R of these candidates by looking for their optimal heights and velocities. The temporal coherence of a pixel serves as a measure of phase stability throughout SAR image stack. In this paper, we used a threshold of 0.8 to exclude unreliable PS candidates from PS points. Setting this threshold is a trade-off between precision and number of PS points.
Discarded PS candidates in reality might indeed be high quality PS points only for a shorter period rather than the time span of the SAR image stack. The reason for coherence loss could be significant modifications in the scene, e.g. construction of a new building or demolition of an old one. We call those points, which are located on objects undergoing such big changes, BC points. The next section introduces our CDPSI approach which is able to retrieve both PS and BC points.
3. CHANGE DETECTION BASED ON PERSISTENT SCATTERER INTERFEROMETRY
3.1 Overview of Approach
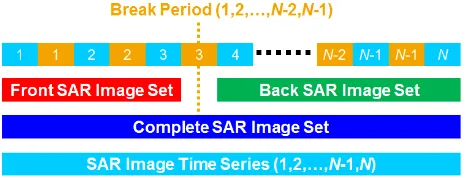
We define three sets of images (complete, front and back) selected from a time series of N complex SAR images (Fig. 1). The complete set consists of the entire series of SAR images. On the other hand, the front set comprise images from beginning of acquisition date up to a defined break period while the back sets are the remaining images acquired after the break period. We search for PS points which only exist in front set but then vanish in back set and vice versa. Stable points which suddenly vanish are termed as vanished big change (VBC) points; those which emerge in back set are called emerged big change (EBC) points. Setting break period is crucial since we can only expect to detect VBC and EBC points which vanish or emerge close to this period. This means, in order to find as many of such events as possible, we should conduct the analysis repeatedly with varying break period. We will discuss this in more detail later.
Figure 1. Three sets of SAR image time series. Complete SAR image set covers entire SAR images. Front and back SAR image sets comprise images before and after the break period respectively.
correspond to PSI analysis on front, complete and back image sets. After conducting PSI analysis on relevant image sets, three temporal coherence images are generated. The temporal coherence image in the complete set is then subtracted from the ones in the front and back sets to obtain two change index images. Automatic thresholding method adopting change index is then applied to extract VBC and EBC points. They are then jointly analysed with PS points selected from the complete set to reject two types of potential outliers: first, PS points which are also identified as VBC or EBC points are discarded; second, VBC point is not allowed to coincide with an EBC point and vice versa. Outliers are then further removed by filtering. Finally, the remaining results are integrated into a common change detection image.
Figure 2. Procedure of CDPSI method. Persistence, vanishment, and emergence scenarios are highlighted in blue, red, and green blocks, respectively. They are dedicated to extract PS, VBC, and EBC points, respectively.
3.2 Change Index
Our key assumption is that in case no big changes occur, temporal coherences of a certain PS point in complete, front, and back image sets are approximately the same. Otherwise, temporal coherence in front or back set is higher than the one in complete set, indicating a VBC or EBC point, respectively.
We compute two change indices for each pixel x: vanishment and emergence scenarios respectively, and TCC
( )
x ,( )
xF
TC , and TCB
( )
x are temporal coherence (TC) in complete, front, and back sets respectively. Change index quantifies probability of a big change for each pixel. A precondition for a VBC point is that it must have been once a PS point in front set before big change; and for EBC point it should turn into a PS point in back set after big change. Accordingly, temporalcoherence of a VBC or EBC point in front or back set should be higher than the one in complete set leading to a positive change index. The closer change index of pixel is to 1, the more likely it contains a VBC or EBC point.
A simple and intuitive method to detect VBC and EBC points is to make use of an empirical change index threshold. In vanishment scenario, PS points from front set are selected as VBC points if their change indices fulfil this threshold. Similar procedure is applied to emergence scenario to detect EBC points. However, manual trial and error might result in subjectively acceptable outcome but lead to more unwanted outliers. Therefore, we design an automatic thresholding technique based on statistical characteristics of change indices to detect VBC and EBC points.
3.3 Automatic Thresholding to Detect Big Change Points Given that no big change occurs, change index distribution over PS points in vanishment or emergence scenario is assumed to be based on Gaussian as: These PS points can be found in complete, front, and back sets rather than only in one of the last two sets. Accordingly, temporal coherences of each PS point should be identical or at least very close in these three sets. Two corresponding change indices calculated by (1) and (2) are then close to 0, i.e. big change unlikely occur. Therefore, the expected value (mean)
µ
in change index distribution (3) is set to 0. The standard deviationσ
reflects quality of PS points which is determined by SAR image set, imperfection in Periodogram grid search, phase noise, etc. For example, high quality PS points have as close temporal coherences as possible between complete, front, and back sets. This gives rise to a narrow and tall curve of change index distribution with smaller standard deviationσ
.Change index distribution over VBC or EBC points do not conform to Gaussian because big changes substantially and arbitrarily alter their temporal coherences between complete, front, and back sets. We will simplify VBC and EBC points into BC point for later discussion given that they have similar extraction procedures. In principle, the difference between change index distributions over PS and BC points inspires an automatic thresholding method to separate them.
Figure 3. Examples of original, first fitted, and second fitted curves of change index distribution. 3-sigma value indicates triple of standard deviation in second fitted curve.
The curve to be fitted is modelled based on Gaussian by:
( )
− −
= /2
A A CI exp A CI Frequency
2
S M
H (4)
where
A
H,A
M, andA
S are height, mean, and standarddeviation respectively. There are two iterations in curve fitting. In first iteration, the elements in the original curve (Fig. 3) are included in the Gaussian curve model (4). They are composed of all change indices [-1,1]∈R and their frequencies. The first fitted curved (Figure 3) is determined by least square method (Teunissen, 2000) along with height, mean, and standard deviation. This curve deflects rightwards due to elements of BC points associated with the large right tail. We then turn to second iteration to reduce such bias. That is, only elements of partial first fitted curve bounded within triple of standard deviation (3-sigma value) is used to determine the second fitted curve (Figure 3). As a result, the resultant curve is more centred on 0 reasonably and conforms to the assumption in (3) that expected value of change indices of PS points is 0. Most elements in this curve come from PS points, and elements of BC points are diminished given that the large right tail is clearly removed.
In the abovementioned curve fitting, the 3-sigma value accounts for 99.7% elements forming the first fitted curve. It is determined based on a trade-off between elements of PS and BC points adopted for second step of curve fitting. For example, increasing such sigma value comes with better Gaussian-based bell shape of second fitted curve featured by more PS points. In contrast, this curve is pulled to the right because influence of BC points is also weighted. Thus, this might result in non-optimal change index threshold leading to more outliers during extraction of BC points. We suggest using 3-sigma value in curve fitting step of CDPSI method given that our results have been validated in this paper.
Finally, the change index threshold (Figure 3) is computed by tripled standard deviation of the second fitted curve. It is supposed to be a boundary keeping the second fitted curve on the left side but the large right tail of the original curve on the other side as far as possible. BC points are extracted if their change indices fulfil the threshold. Actually, choosing such
large 3-sigma value causes high change index threshold leading to reduction of BC points. In this case, false alarms of BC points (i.e. PS points are falsely regarded as BC points) are diminished but along with increased missed alarms. Nevertheless, latter errors are supposed to be limited because number of BC points is usually smaller than the one of PS points. In any case, the thresholding process still inevitably generates outliers. We then resort to filtering to minimise such errors.
3.4 Outlier-filtering
There are several causes of outliers such as non-optimal temporal coherence or change index threshold, uncertainty in Periodogram grid search, phase noise, etc. In this paper, outlier-filtering is design based on experimental data with two considerations: first, ground resolution of TSX images is resampled into 1 m by 1 m; second, velocities of PS points are limited over study area given that no serious ground motions like earthquake are reported. Three types of outlier are described below along with their removal procedures.
Isolated points: PS, VBC, and EBC points are assumed to be clustered on objects of a certain minimal size, e.g. buildings, industrial plants, and infrastructures in urban area. Accordingly, PS, VBC, and EBC points which are isolated in a 5-by-5 window are removed.
Inconsistent points: Connected points are expected to comprise single object. For example, PS points unlikely appear on a demolished building full of VBC points. Therefore, PS, VBC, or BC points are retained in a 5-by-5 window if they form a majority. Other inconsistent points are then removed.
PS points with peculiar velocities: A PS point is recognized as outlier if its velocity is implausibly large or is quite different compared to the other neighboring PS points. Two filters are used to remove such outlier. First, a PS point is removed if its velocity exceeds tolerance range: -2 to 2 (mm/year). Second, average and standard deviation of velocities are calculated in a 3-by-3 window. Then the center PS point is deleted if difference between its velocity and the average is larger than 0.5 mm/year or triple of the standard deviation.
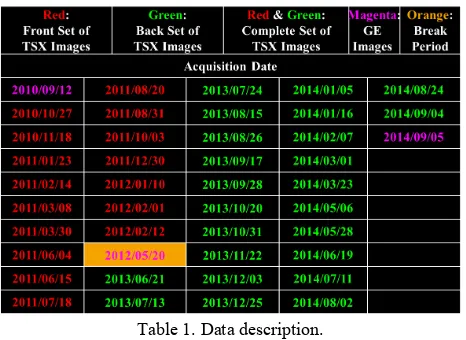
4. DATA AND STUDY AREA 4.1 Data
Table 1. Data description.
were acquired over built-up area in Berlin City within 4 years (from 2010/10/27 to 2014/09/04). Each TSX image is resampled into 5000 pixels by 5000 pixels with ground resolution 1 m (capable of delineating buildings in detail). Accordingly, a PS, VBC, or EBC point actually denotes a 1 m-by-1 m area on ground. We set a break period (495 days) between acquisition dates of the 16th and 17th TSX images which feature the longest temporal interval. We recognize many building changes occurring close to or after this break period according to three time-series Google Earth (GE) images (ground truth) acquired by airborne cameras. We expect that numerous VBC and EBC points can be extracted in CDPSI result.
4.2 Study Area
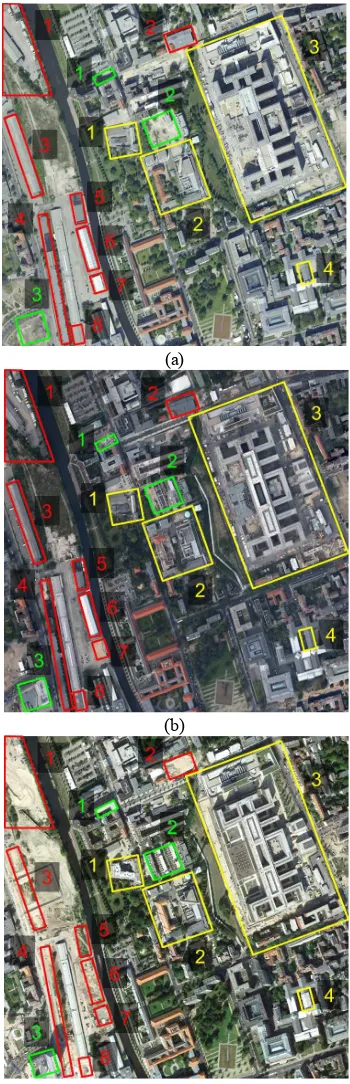
In the area covered by the TSX images, we observe many bright clusters of strong signals on buildings. As they are suitable PS points, CDPSI is appropriate to monitor such built-up human settlements where PS, VBC, and EBC points are regarded as steady, demolished, and erected building substructures. We focus analysis on study area (Figure 4) around north of Berlin main station where various building changes are found and are good examples to highlight advantages of our method. The demolition, erection, and hybrid areas are marked in the three time-series GE images. We will explore these areas in detail as follows.
The buildings in demolition areas 1, 2, 3, 4, 5, 6, and 8 were totally levelled off after 2012/05/20. They were originally steady buildings and then demolished sometime. Hence, there should be dense VBC points able to be extracted on these areas. The building in area 7 disappeared on 2012/05/20. We are not sure if demolition occurred before or during the break period. The challenge now is whether or not CDPSI approach can obtain VBC points here. If yes, we could say this building was demolished during the break period. If no, setting the break period earlier more likely surfaces potential VBC points.
We recognize some new buildings in erection areas 1, 2, and 3 as they are present in the last two GE images but do not exist in the first GE image. In area 1, construction foundation and crane in the second GE image can be seen. The completion time of this new building is uncertain. This event can be detected only if the construction was finished close to the break period. In area 2, there are three new apartments in the last GE image. However, two of them are just semi-finished and the land on third is still empty in the second GE image. Our technique is able to objectively determine which and where VBC points can be recognized with respect to the break period. Although the new building in area 3 seems to appear in the last two GE images, parts of this building were still under construction on 2012/05/20. Therefore, VBC points might be only found on some substructures that were completed close to the break period.
Complex building changes are seen in hybrid areas 1, 2, 3, and 4 which neither demolition nor erection can be referred to. The original building in area 1 is present in the first two GE images. Then a new building was built in the same place and seems to be almost finished in the last GE image. We are not sure it belongs to demolished or erected building associated with the break period. Such confusion also happens in area 4. We observe some renovated structures on steady buildings in area 2 where PS, VBC, and EBC points should be extracted collectively. We expect that CDPSI method is able to
discriminate these three point types. New headquarter of German Federal Intelligence Service (Bundesnachrichtendienst: BND) has been built in area 3 since October, 2006. Our aim is to monitor such constructing progress in detail. In other words, we want to recognize steady, demolished, and erected substructures on the BND simultaneously along with temporal information (break period).
(a)
(b)
(c)
5. RESULTS AND DISCUSSION 5.1 Persistent Scatterer Points from PSI
Figure 5(a) shows PS points extracted from the complete set to demonstrate drawback of conventional PSI. Most PS points are located on steady buildings as expected. We cannot find connected PS points in the demolition and erection areas except some in hybrid area. Simply speaking, information of big changes is unavailable in PSI procedure where VBC and EBC points are just discarded. To overcome this drawback, we introduce change index in CDPSI to quantify probability of a big change on each point. VBC and EBC points are then extracted if their change indices fulfil corresponding thresholds.
(a)
(b)
Figure 5. (a) PS points extracted from complete set in experiment. (b) Change detection image. Building change: Red, demolition area; Green, erection area; Yellow, hybrid area. Point type: Blue, PS point; Red, VBC point; Green, EBC point.
5.2 Change Index Threshold
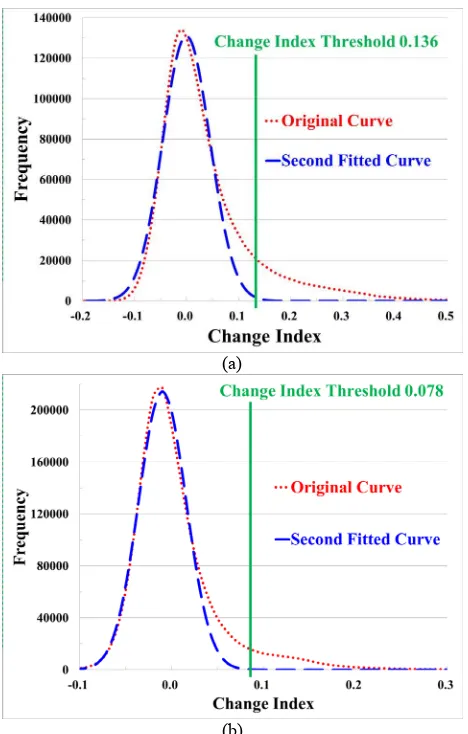
In the vanishment scenario, the change indices of PS points selected from the front set signify these PS points’ probabilities of being VBC points. Such VBC points only exist in front set as PS points. Subsequently, they vanish in back set due to big change. Original curve (Figure 6(a)) of change index distribution over PS points consists of a Gaussian curve and a large right tail. They are supposed to be caused by elements of PS and VBC points respectively. We need a change index threshold to optimally divide these two parts of original curve.
Thus we can extract VBC points along with as few outliers as possible. The mean and standard deviation of the second fitted curve in Figure 6(a) is 0.000 and 0.045. We then obtain change index threshold of 0.136 by tripling the standard deviation. Finally, VBC points are selected from the PS points if their change indices fulfil this threshold.
(a)
(b)
Figure 6. Curves of change index distribution over PS points in (a) vanishment and (b) emergence scenarios in experiment.
In the emergence scenario, the PS points extracted in the back set are supposed to be EBC points if they have high change indices. The mean and standard deviation of the second fitted curve in Figure 6(b) is 0.010 and 0.026. Consequently, change index threshold of 0.078 is used to extract EBC points.
The extracted VBC and EBC points are jointly analysed with PS points selected from the persistence scenario to discard potential outliers. Afterwards, remaining errors are further removed by filtering. As a result, PS, VBC, and EBC points are combined into a change detection image.
5.3 Change Detection Image
Demolition Areas: Only VBC points are found in demolition areas 1, 2, 3, 4, 5, 6, 7, and 8 where all buildings were completely demolished after the break period and then bare soils were left as shown in Figure 4(c).
Erection Areas: Erection area 1 confirms a small new building surrounded by steady buildings. We just have few EBC points in erection area 2 where we expect more as three new apartments stood after the break period. We infer that only those substructures that were finished close to the break period have changes to form EBC points. Similarly to erection area 2, we only get EBC points fewer than expected in erection area 3 for the same reason. We suggest that more EBC points can be obtained in erection areas 2 and 3 by setting break period later.
Hybrid Areas: A demolished building is recognized in hybrid area 1. We obtain prolific change information in hybrid area 2. First, new substructures (EBC points) are found on the left-top buildings. Second, parts (VBC points) of the right buildings were removed. Third, the left buildings (full of VBC points) were demolished. Speaking to hybrid area 3, main buildings of BND headquarters have been accomplished after the break period given that clear building like patterns composed of dense EBC points are present. Some groups of VBC points surround these main buildings. We infer that they were originally constructional materials on facades or foundations and then were removed or covered with new substructures. Last but not least, we also find a few of PS points supposed to be steady substructures during the period of constructing the BND headquarters. The results in hybrid area 3 prove that CDPSI is able to monitor constructing progress with spatial and temporal information. Hybrid area 4 shows a distinct demolished building (part of Natural History Museum Berlin) encompassed by steady buildings.
5.4 Applications of CDPSI to Urban Monitoring
It is important to monitor traffic infrastructures for citizen safety and city planning especially in extending human settlements. Example is shown in Figure 7 where construction event on railway and a new shoe shop alongside railway are recognized. The other traffic infrastructures (upper bridge, railways, and highways) are steady given that the dense PS points are found on them. Moreover, velocities of PS points can also be used to monitor small deformation like subsidence due to subway construction or thermal expansion of steel materials on railway and bridge.
Figure 7. (a) Change detection image and (b) GE image (2014/09/05) for application of monitoring traffic infrastructures. Green area, new shoe shop. Red area, railway section under construction.
Building changes in business districts of cities are frequent and unexpected. Therefore, cost effective methods are needed to
monitor such big changes. Example is shown in Figure 8 where three demolished and four erected buildings are recognized in such small area of 600 m by 600 m.
Figure 8. (a) Change detection image and (b) GE image (2014/09/05) for application of monitoring business districts. Red areas, demolished buildings. Green areas, erected buildings.
Sports playgrounds are worth being monitored given that they are full of people during matches. Citizen safety is of course a priority. For example, substructures of an arena should be monitored to avoid structural damages dangerous for audiences. Figure 9 shows Olympic Park Berlin where hybrid changes on stairway structures and a new building are recognized. The most importance is that the left-top arena and left-down stadium all seem steady without structural damages.
Figure 9. (a) Change detection image and (b) GE image (2014/09/05) for application of monitoring sports playgrounds. Yellow area, hybrid changes on stairway structure. Green area, erected building.
6. CONCLUSIONS
We propose Change Detection based on Persistent Scatterer Interferometry (CDPSI) technique to detect PS, VBC, and EBC points respectively on persistent, vanished, and emerged objects on ground. VBC and EBC points are formed close to a break period set in this method. We introduce change index to quantify probability of being VBC or EBC point for each point. An automatic thresholding method adopting change index is used to extract VBC and EBC points. They are then jointly analysed with PS points to exclude errors. Outliers are then further removed by filtering. Finally, the remaining results are integrated into a change detection image.
monitoring traffic infrastructures, business districts, and sports playgrounds based on the proposed technique.
We demonstrate that CDPSI is a novel, informative and complementary change detection method. With exception of PSI, this method can be easily extended to other multi-temporal interferometric SAR techniques. People can give PS, VBC, and EBC points certain semantic meanings according to land cover of study area for specific applications. For example, small deformations (mm/year level) of PS points on facades can be monitored for structural safety of building. In addition, demolished and erected building substructures covered by VBC and EBC points can be detected. City authority can thus manage citizen properties, industries, etc. in cost effective way. As this approach extracts two types of changes as a one-way technique using single source of data - SAR images, such relative simplicity raises generalization and efficiency to come with more applications of urban monitoring.
In future works, various case studies can be conducted. For example, the proposed method can be used to detect destroyed buildings due to natural disasters like earthquake or tsunami. Following reconstruction progress in disaster areas can be monitored as well. Therefore, developing adequate thresholding methods to extract VBC and EBC points might be required. Although break period provides an approximate time span containing big changes, we still want to bring in more accurate temporal information. To do so, we will implement several CDPSI scenarios with varying break periods and then jointly analyse the results. Once succeeded, 4D (3D position & 1D time) change detection can be realized.
REFERENCES
Berardino, P., Fornaro, G., Lanari, R. and Sansosti, E., 2002. A new algorithm for surface deformation monitoring based on small baseline differential SAR interferogram. IEEE Trans. Geosci. and Remote Sens., 40(11), pp. 2375-2382.
Colesanti, C., Ferretti, A., Novali, F., Prati, C. and Rocca, F., 2003. SAR monitoring of progressive and seasonal ground deformation using the permanent scatterers technique. IEEE Trans. Geosci. and Remote Sens., 41(7), pp. 1685-1700.
Crosetto, M., Biescae, E., Duro, J., Closa, J. and Arnaud, A., 2008. Quality assessment of advanced interferometric products based on time series of ERS and Envisat SAR data.
Photogramm. Eng. Remote Sens., 74(4), pp. 443-450.
Dixon, T. H., Amelung, F., Ferretti, A., Novali, F., Rocca, F., Dokka, R., Sella, G., Kim, S. W., Wdowinski, S. and Whitman, D., 2006. Subsidence and flooding in New Orleans. Nature, 441, pp. 587-588.
Ferretti, A., Prati, C. and Rocca, F., 2000. Nonlinear subsidence rate estimation using permanent scatterers in differential SAR interferometry. IEEE Trans. Geosci. and Remote Sens., 38(5), pp. 2202-2212.
Ferretti, A., Prati, C. and Rocca, F., 2001. Permanent scatterers in SAR interferometry. IEEE Trans. Geosci. and Remote Sens., 39(1), pp. 8-20.
Ferretti, A., Fumagalli, A., Novali, A., Prati, C., Rocca, F. and Rucci, A., 2011. A new algorithm for processing interferometric data-stacks: SqueeSAR. IEEE Trans. Geosci. and Remote Sens., 49(9), pp. 3460-3470.
Gernhardt, S. and Bamler, R., 2012. Deformation monitoring of single buildings using meter-resolution SAR data in PSI. ISPRS J. Photogramm. Remote Sens., 73, pp. 68-79.
Gernhardt, S., Adam, N., Eineder, M. and Bamler, R., 2010. Potential of very high resolution SAR for persistent scatterer Interferometry in urban areas. Ann. GIS, 16(2), pp. 103-111.
Hooper, A., Zebker, H., Segall, P. and Kampes, B., 2004. A new method for measuring deformation on volcanoes and other natural terrains using InSAR persistent scatterers. Geophys. Res. Lett., 31(23), pp. 1-5.
Hussain, M., Chen, D., Cheng, A., Wei, H. and Stanley, D., 2013. Change detection from remotely sensed images: from pixel-based to object-based approaches. ISPRS J. Photogramm. Remote Sens., 80, pp. 91-106.
Kampes, B. M., 2006. Radar Interferometry: Persistent Scatterer Technique. Springer.
Lanari, R., Mora, O., Manunta, M., Mallorquí, J. J., Berardino, P. and Sansosti, E., 2004. A small baseline approach for investigating deformations on full resolution differential SAR interferograms. IEEE Trans. Geosci. and Remote Sens., 42(7), pp. 1377-1386.
Liu, J., Black, A., Lee, H., Hanaizumi, H. and Moore, J. McM, 2001. Land surface change detection in a desert area in Algeria using multi-temporal ERS SAR coherence images. Int. J. Remote Sens., 22(13), pp. 2463-2477.
Mittermayer, J., Wollstadt, S., Prats-Iraola, P. and Scheiber, R., 2014. The TerraSAR-X staring spotlight mode concept. IEEE Trans. Geosci. and Remote Sens., 52(6), pp. 3695-3706.
Monserrat, O., Crosetto, M., Cuevas, M. and Crippa, B., 2011. The thermal expansion component of persistent scatterer Interferometry observations. IEEE Geosci. Remote Sens. Lett., 8(5), pp. 864-868.
Osmanoğlu, B., Dixon, T. H., Wdowinski, S., Cabral-Cano, E. and Jiang, T., 2011. Mexico city subsidence observed with persistent scatterer InSAR. Int. J. Appl. Earth Obs. Geoinf., 13, pp. 1-12.
Perissin, D. and Ferretti, A., 2007. Urban target recognition by means of repeated spaceborne SAR images. IEEE Trans. Geosci. and Remote Sens., 45(12), pp. 4043-4058.
Preiss, M. and Stacy, N. J. S., 2006. Coherent change detection: theoretical description and experimental results. Defence Science and Technology Organisation.