VISUAL ANALYSIS AND PROCESSING OF CLUSTERS STRUCTURES IN
MULTIDIMENSIONAL DATASETS
A.E. Bondarev
Keldysh Institute of Applied Mathematics RAS, 125047 Miusskaya sq. 4, Moscow, Russia - [email protected]
Commission II, WG II/10
KEY WORDS: Multidimensional Data, Visual Analysis, Elastic Maps, Cluster Structures
ABSTRACT:
The article is devoted to problems of visual analysis of clusters structures for a multidimensional datasets. For visual analyzing an approach of elastic maps design [1,2] is applied. This approach is quite suitable for processing and visualizing of multidimensional datasets. To analyze clusters in original data volume the elastic maps are used as the methods of original data points mapping to enclosed manifolds having less dimensionality. Diminishing the elasticity parameters one can design map surface which approximates the multidimensional dataset in question much better. Then the points of dataset in question are projected to the map. The extension of designed map to a flat plane allows one to get an insight about the cluster structure of multidimensional dataset. The approach of elastic maps does not require any a priori information about data in question and does not depend on data nature, data origin, etc. Elastic maps are usually combined with PCA approach. Being presented in the space based on three first principal components the elastic maps provide quite good results. The article describes the results of elastic maps approach application to visual analysis of clusters for different multidimensional datasets including medical data.
1. INTRODUCTION
In the analysis of multidimensional data classification tasks occupy a special place. When classifying the volume of multidimensional data, the problem of dividing the studied set of phenomena into classes can be solved, and the assignment of one or several phenomena to already existing classes can be done. Cluster analysis methods are used to solve such problems. There are a lot of methods and algorithms for cluster analysis at the moment, they are constantly evolving and differ in great variety. The variety of algorithms for cluster analysis is determined by a variety of different criteria that express certain aspects of the quality of automatic grouping.
When solving classification problems, the approaches of visual analytics turn out to be very useful. These approaches combine a number of algorithms for lowering the dimensionality and a visual representation of multidimensional data in the manifolds of lower dimension embedded in the original volume.
Such algorithms include the mapping of the original multidimensional volume by elastic maps with different elasticity properties. The methods of elastic maps construction are described in (Zinovyev A., 2000), (Gorban A. et al, 2007), (Gorban A., Zinovyev A., 2010). These methods allow to extract the cluster structure from the original multidimensional data volume.
It should be noted that interest in elastic maps appeared in the development of computational technology for constructing, processing, analyzing and visualizing multidimensional parametric solutions of computational fluid dynamics (CFD) problems. Computing technology is realized as a unified technological pipeline of algorithms for the production, processing, visualization and analysis of multidimensional data. Such a pipeline can be considered as a prototype of a
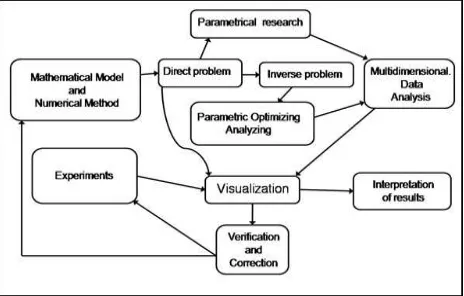
generalized computational experiment for time-dependent problems of CFD. The scheme for implementing such a generalized numerical experiment is shown in Figure 1.
Such a generalized numerical experiment implicitly assumes the existence of a reliable mathematical model, a numerical method for solving, and a set of experimental results for verification. In the process of computation it is necessary to realize the organization of a constant comparison with the experimental data in the presence of such opportunity. The set of methods should include the solution of inverse and optimization problems. Being realized with the help of parallel interfaces, these methods will allow to obtain solutions of parametric research problems and optimization analysis in the form of multidimensional data volumes.
Figure 1. The scheme of generalized numerical experiment. The International Archives of the Photogrammetry, Remote Sensing and Spatial Information Sciences, Volume XLII-2/W4, 2017
2nd International ISPRS Workshop on PSBB, 15–17 May 2017, Moscow, Russia
This contribution has been peer-reviewed.
To process these volumes and to reveal hidden interdependencies between the parameters studied in the volume, it is necessary to integrate methods of analysis of multivariate data and their visual representation into a common set of algorithms. As a result, such generalized computational experiment will allow us to obtain a solution of not one single problem, but a solution for a whole class of problems specified by the ranges of change of the determining parameters. Practical implementation of such a generalized experiment can ensure the organization of large-scale industrial calculations. A description of the elements of the realized computing technology is given in (Bondarev A.E., Galaktionov V.A., 2015a) and (Bondarev A.E., Galaktionov V.A., 2015b).
Elastic maps proved to be useful and rather universal tool that allowed to apply them to multidimensional volumes of data of different types. For example, this approach was applied to the problems of analyzing textual information, where the frequencies of the use of words were used as numerical characteristics (Bondarev A.E.et al, 2016).
2. CONSTRUCTION OF ELASTIC MAPS
The ideology and algorithms for construction of elastic maps are described in detail in (Zinovyev A., 2000), (Gorban A. et al, 2007), (Gorban A., Zinovyev A., 2010). Elastic map is a system of elastic springs embedded in a multidimensional data space. This approach is based on an analogy with the problems of mechanics: the main manifold passing through the "middle" of the data can be represented as an elastic membrane or plate. The method of elastic maps is formulated as an optimization problem, which assumes optimization of a given functional from the relative location of the map and data.
According to (Zinovyev A., 2000), the basis for constructing an elastic map is a two-dimensional rectangular grid G embedded in a multidimensional space that approximates the data and has adjustable elastic properties with respect to stretching and bending. The location of the grid nodes is sought as a result of solving the optimization problem for finding the minimum of the functional:
where │X│ is the number of points in the multidimensional data volume X; m is the number of grid nodes, and are the elastic coefficients responsible for the stretching and curvature of the mesh;
The term D2 represents the measure of the stretching of the grid:
The term D3 represents the measure of the curvature of the grid:
Varying the elasticity parameters consists in constructing elastic maps with a consequent decrease in the elasticity coefficients, whereby the map becomes softer and more flexible, most optimally adjusting to the points of the original multidimensional data volume. After construction, the elastic map can be deployed in a plane to observe the cluster structure in the volume of data under study. The use of elastic maps makes it possible to more accurately and clearly determine the cluster structure of the studied multidimensional data volumes.
It should be noted that the problem of scalability arises in the construction of elastic maps in a multidimensional data cloud consisting of condensations and individual remote points. The elastic map will try to adjust to the volume in question as a whole - both to distant points and to the areas of condensation. Such adjusting, naturally, can not turn out equally well. In order to solve this problem and provide a clear picture of the data in the condensation region, an approach called “quasi-Zoom” was proposed in (Bondarev A.E. et al, 2016). The approach consists in cutting out the condensation region from the cloud of multidimensional data under consideration and constructing of the elastic map for the cutted area again. This procedure can be repeated until an acceptable result is achieved.
3. EXAMPLES OF ELASTIC MAPS CONSTRUCTING
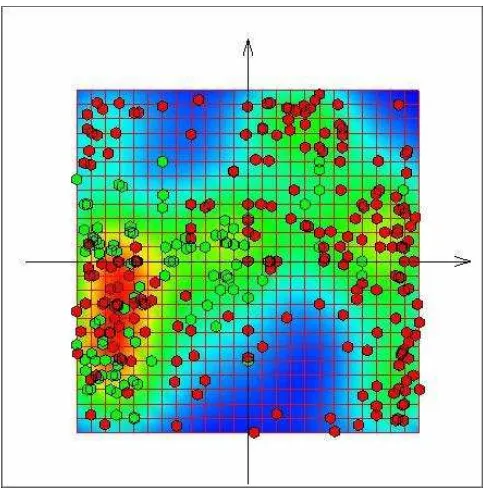
Let us consider an example of elastic maps constructing for the widely known test volume of multidimensional IRIS data (Zinovyev A., 2000). This volume is a set of data based on measurements of the characteristics of iris flowers. The data set describes three classes of irises and consists of 150 points in a four-dimensional space. Figure 2 presents a "soft" elastic map for this data set with a data density coloring. Here and further
The International Archives of the Photogrammetry, Remote Sensing and Spatial Information Sciences, Volume XLII-2/W4, 2017 2nd International ISPRS Workshop on PSBB, 15–17 May 2017, Moscow, Russia
This contribution has been peer-reviewed.
Figure 2. “Soft” elastic map in the space of three first principal components.
Figure 3.The extension of elastic map on a flat plane.
Next, consider the results of elastic maps applying to the task of analyzing of textual information. From the point of view of elastic maps constructing the original multidimensional volume is completely standard. Let us consider the results for the test volume described in (Bondarev A.E. et al, 2016). For primary tests about 100 verbs were selected with 155 most related nouns. The data thus obtained is further considered as a multidimensional data volume, representing 100 points in 155-dimensional space. The numerical values of the resulting matrix are defined as the frequency of sharing.
It should be noted that there were a number of pairs of similar perfect and imperfect verbs in the test data volume. This was done for additional control due to the assumption that the points corresponding to such pairs should be close to each other in the resulting image. An example of a "soft" elastic map is shown in Figure 4. Figure 5 shows the same map in expanded form. It can be seen that the volume of data under study contains a region of high data density and points quite far from this region. The problem was posed as follows. It was necessary to maximally separate the "stuck together" points. For this purpose, the "quasi-zoom" approach was used, which allowed to solve this problem. The results of the "quasi-zoom" application are shown in Figure 6.
Figure 4: An example of elastic map for textual data volume.
Figure 5: The extension of previous elastic map on a flat plate.
Figure 6. The separation of points after "quasi-zoom" application
The use of elastic maps for solving cluster analysis problems does not imply any a priori information about the studied data. This makes it possible to apply elastic maps to the analysis of biomedical data. For this purpose the data from (Rocha Neto, A., Barreto, G., 2009) were used. This data set contains values for six biomechanical features used to classify orthopaedic patients into 2 classes (normal or abnormal). Each patient is represented in the data set by six biomechanical attributes derived from the shape and orientation of the pelvis and lumbar spine (in this order): pelvic incidence, pelvic tilt, lumbar lordosis angle, sacral slope, pelvic radius and grade of spondylolisthesis.
The International Archives of the Photogrammetry, Remote Sensing and Spatial Information Sciences, Volume XLII-2/W4, 2017 2nd International ISPRS Workshop on PSBB, 15–17 May 2017, Moscow, Russia
This contribution has been peer-reviewed.
The data set contains 310 points in 6-dimensional space. Figure 7 shows a "soft" elastic map for a given data set. The green dots correspond to the "normal" category, the red dots correspond to the "abnormal" category. Figure 8 shows an expanded map with a data density coloring.
Figure 7: An example of elastic map for biomedical data.
Figure 8: The extension of elastic map for biomedical data.
The results obtained make it possible to get an insight of the relative position for the main classes in the multidimensional volume under question. However, in Figure 8 one can see a region of mixing data from two categories. This region is a region with high density of data. To improve the separation of classes, it is necessary to further improve the algorithm for elastic maps design. This can be done, for instance, by reduction of grid cells size of the map in areas of high data density.
4. CONCLUSIONS
For the analysis of cluster structures in a multidimensional data volume it is proposed to use elastic maps technologies, which are methods for mapping points of the original multidimensional space onto submanifolds of lower dimensionality embedded in this space. By varying the surface of the elastic map by consecutively reducing the elasticity coefficients, it is possible to achieve better matching of the map adjustment to a multidimensional data cloud. After reducing the flexural and stretch ratios of the elastic map, it becomes softer and more flexible, most optimally adjusting to the points of the original multidimensional data volume. The use of elastic maps technologies for solving cluster analysis problems does not imply any a priori information about the studied data and does not depend on their nature, origin, etc. The examples of constructed elastic maps are given for text analysis tasks and for medical data.
ACKNOWLEDGEMENTS
Author acknowledges the partial support by grants of RFBR № 16-01-00553А and № 17-01-00444А.
REFERENCES
Bondarev, A.E. et al, 2016. Visual analysis of clusters for a multidimensional textual dataset / Scientific Visualization. V.8, № 3, с.1-24, 2016, URL: http://sv-journal.org/2016-3/index.php?lang=en
Bondarev A.E., Galaktionov V.A., 2015a. Analysis of Space-Time Structures Appearance for Non-Stationary CFD Problems // Proceedings of 15-th International Conference On Computational Science ICCS 2015 Rejkjavik, Iceland, June 01-03 2015, Procedia Computer Science, Volume 51, 2015, Pages 1801–1810.
Bondarev A.E., Galaktionov V.A. , 2015b. Multidimensional data analysis and visualization for time-dependent CFD problems // Programming and Computer Software, 2015, Vol. 41, No. 5, pp. 247–252, DOI: 10.1134/S0361768815050023.
Gorban A. et al, 2007. Principal Manifolds for Data Visualisation and Dimension Reduction, LNCSE 58, Springer, Berlin – Heidelberg – New York, 2007.
Gorban A., Zinovyev A., 2010. Principal manifolds and graphs in practice: from molecular biology to dynamical systems International Journal of Neural Systems, Vol. 20, No. 3 (2010) 219–232.
Rocha Neto, A., Barreto, G., 2009. On the Application of Ensembles of Classifiers to the Diagnosis of Pathologies of the Vertebral Column: A Comparative Analysis, IEEE Latin America Transactions, 7(4):487-496.
Zinovyev A., 2000. Vizualizacija mnogomernyh dannyh [Visualization of multidimensional data]. Krasnoyarsk, publ. NGTU. 2000. 180 p. [In Russian]
The International Archives of the Photogrammetry, Remote Sensing and Spatial Information Sciences, Volume XLII-2/W4, 2017 2nd International ISPRS Workshop on PSBB, 15–17 May 2017, Moscow, Russia
This contribution has been peer-reviewed.