Study on the EU's list of Critical Raw Materials
(2020)
Final Report
Russia Palladium 40 %
USA
Beryllium 88%
Brazil Niobium 92%
China
Antimony 74%
Baryte 38%
Bismuth 80%
Coking Coal 55%
Fluorspar 65%
Gallium 80%
Germanium 80%
Indium 48%
Magnesium 89%
Natural graphite 69%
Phosphate rock 48%
Phosphorus 74%
Scandium 66%
Silicon metal 66%
Titanium 45%
Tungsten 69%
Vanadium 39%
LREEs 86%
HREEs 86%
France Hafnium 49%
Thailand
Natural rubber 33%
South Africa Iridium 92%
Platinum 71%
Rhodium 80%
Ruthenium 93%
Turkey Borate 42%
DRC Cobalt 59%
Tantalum 33%
Australia Bauxite 28%
Chile Lithium 44%
Spain Strontium 31%
Authors: Gian Andrea Blengini, Cynthia EL Latunussa, Umberto Eynard, Cristina Torres de Matos, Dominic Wittmer, Konstantinos Georgitzikis, Claudiu Pavel, Samuel Carrara, Lucia Mancini, Manuela Unguru, Darina Blagoeva, Fabrice Mathieux, David Pennington.
LEGAL NOTICE
This document has been prepared for the European Commission however it reflects the views only of the authors, and the Commission cannot be held responsible for any use which may be made of the information contained therein.
More information on the European Union is available on the Internet (http://www.europa.eu).
Luxembourg: Publications Office of the European Union, 2020
Print ISBN 978-92-76-21050-4 doi:10.2873/904613 ET-01-20-491-EN-C PDF ISBN 978-92-76-21049-8 doi:10.2873/11619 ET-01-20-491-EN-N
© European Union, 2020
Reproduction is authorised provided the source is acknowledged.
How to cite this report: "European Commission, Study on the EU’s list of Critical Raw Materials – Final Report (2020)"
EUROPEAN COMMISSION
Directorate-General for Internal Market, Industry, Entrepreneurship and SMEs | Joint Research Centre Directorate GROW.C | JRC.D
Unit GROW.C.2 – Energy-intensive Industries and Raw Materials | JRC.D.3 – Land Resources Contact: GROW.C.2
E-mail: [email protected]
European Commission B-1049 Brussels
EUROPE DIRECT is a service to help you find answers to your questions about the European Union
Freephone number (*):
00 800 6 7 8 9 10 11
(*) The information given is free, as are most calls (though some operators, phone boxes or hotels may charge you)
Study on the EU's list of Critical Raw Materials (2020)
Final Report
EXECUTIVE SUMMARY
Context
Pressure on resources will increase - due to increasing global population, industrialisation, digitalisation, increasing demand from developing countries and the transition to climate neutrality with metals, minerals and biotic materials used in low- emission technologies and products. OECD forecasts that global materials demand will more than double from 79 billion tonnes today to 167 billion tonnes in 2060. Global competition for resources will become fierce in the coming decade. Dependence of critical raw materials may soon replace today's dependence on oil.
The EU Green Deal Communication1 adopted on 11 December 2019 recognizes access to resources as a strategic security question to fulfil its ambition towards 2050 climate neutrality and increasing our climate ambition for 2030.
Secure and sustainable supply of both primary and secondary raw materials, in particular of critical raw materials, for key technologies and strategic sectors as renewable energy, e-mobility, digital, space and defence is one of the pre-requisites to achieve climate neutrality. The new Industrial Strategy for the EU2 addresses the security and sustainability challenge and calls for an Action Plan on Critical Raw Materials and for industry-driven raw materials alliances.
This continues the work of the Commission to address the growing concern of securing valuable raw materials for the EU economy. Already in 2008, the European Commission launched the Raw Materials Initiative (RMI)3. This EU policy pursues a diversification strategy for securing non-energy raw materials for EU industrial value chains and societal well-being. Diversification of supply concerns reducing dependencies in all dimensions – by sourcing of primary raw materials from the EU and third countries, increasing secondary raw materials supply through resource efficiency and circularity, and finding alternatives to scarce raw materials.
One of the priority actions of the RMI was to establish a list of critical raw materials at EU level. The first list was published in 2011 and it is updated every three years to regularly assess the criticality of raw materials for the EU. Critical raw materials are considered to be those that have high economic importance for the EU and a high supply risk.
The present study is the fourth technical assessment of critical raw materials for the EU, based on the methodology4 developed by the European Commission in cooperation with the Ad hoc Working Group on Defining Critical Raw Materials (AHWG)5 in 2017.
The first assessment (2011) identified 14 critical raw materials (CRMs) out of the 41 non- energy, non-agricultural candidate raw materials. In the 2014 exercise, 20 raw materials were identified as critical out of 54 candidates. In 2017, 27 CRMs were identified among 78 candidates.
Novelties of the 2020 assessment
The 2020 assessment covers a larger number of materials: 83 individual materials or 66 candidate raw materials comprising 63 individual and 3 grouped materials (ten individual heavy rare earth elements (REEs), five light REEs, and five platinum-group metals (PGMs)). Five new materials (arsenic, cadmium, strontium, zirconium and hydrogen) have been assessed.
1 COM(2019) 640 final
2 COM(2020) 102 final
3 https://ec.europa.eu/growth/sectors/raw-materials/policy-strategy_en
4 Methodology for establishing the EU List of Critical Raw Materials, 2017, ISBN 978-92-79-68051-9
5 The AHWG on Defining Critical Raw Materials is a sub-group of the Raw Materials Supply Group expert group.
Industrial and construction minerals
aggregates, baryte, bentonite, borates, diatomite, feldspar, fluorspar, gypsum, kaolin clay, limestone, magnesite, natural graphite, perlite, phosphate rock, phosphorus, potash, silica sand, sulphur, talc
Iron and ferro- alloy metals
chromium, cobalt, manganese, molybdenum, nickel, niobium, tantalum, titanium, tungsten, vanadium
Precious metals gold, silver, and Platinum Group Metals (iridium, palladium, platinum, rhodium, ruthenium)
Rare earths
Heavy rare earths (dysprosium, erbium, europium, gadolinium, holmium, lutetium, terbium, thulium, ytterbium, yttrium); Light rare earths (cerium, lanthanum, neodymium, praseodymium and samarium); and scandium
Other non-ferrous metals
aluminium, antimony, arsenic, beryllium, bismuth, cadmium, copper, gallium, germanium, gold, hafnium, indium, lead, lithium, magnesium, rhenium, selenium, silicon metal, silver, strontium, tellurium, tin, zinc, zirconium
Bio and other materials
natural cork, natural rubber, natural teak wood, sapele wood, coking coal, hydrogen and helium
For comparison, 41 candidate materials have been screened in 2011, 54 in 2014 and 61 in 2017.
Results
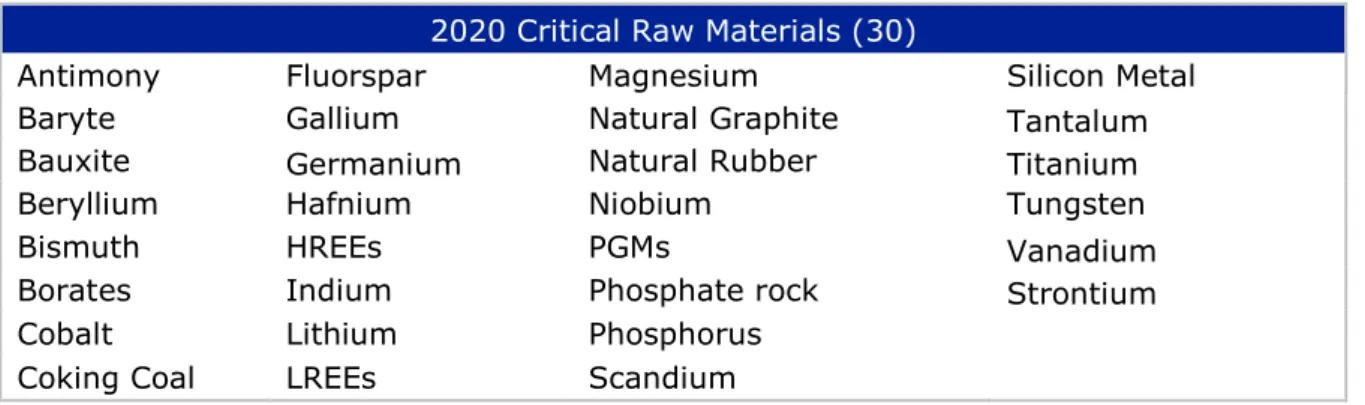
Of the 83 individual (66 candidate) raw materials assessed, the following 30 were identified as critical in this assessment:
2020 Critical Raw Materials (30)
Antimony Fluorspar Magnesium Silicon Metal
Baryte Gallium Natural Graphite Tantalum
Bauxite Germanium Natural Rubber Titanium
Beryllium Hafnium Niobium Vanadium
Bismuth HREEs PGMs Tungsten
Borates Indium Phosphate rock Strontium
Cobalt Lithium Phosphorus
Coking Coal LREEs Scandium
The overall results of the 2020 criticality assessment are presented in Figure A. Critical raw materials (CRMs) are highlighted by red dots and are located within the criticality zone (SR ≥ 1 and EI ≥ 2.8) of the graph. Blue dots represent the non-critical raw materials.
Figure A: Economic importance and supply risk results of 2020 criticality assessment
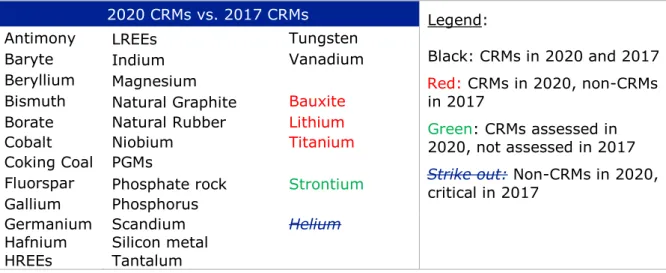
The 2020 list confirms 26 of the 2017 CRMs. Three CRMs in the 2020 list were not considered as critical in the 2017 list: Bauxite, Lithium and Titanium. Conversely, Helium, critical in the 2017 CRM list, is no longer in 2020. Strontium is the only new candidate material that is in the 2020 list of CRMs.
2020 CRMs vs. 2017 CRMs
Antimony Germanium PGMs Bauxite
Baryte Hafnium Phosphate rock Lithium
Beryllium HREEs Phosphorus Titanium
Bismuth LREEs Scandium
Borate Indium Silicon metal
Cobalt Magnesium Tantalum Strontium
Coking Coal Natural Graphite Tungsten
Fluorspar Natural Rubber Vanadium
Gallium Niobium Helium
Legend:
Black: CRMs in 2020 and 2017
Red: CRMs in 2020, non-CRMs in 2017
Green: CRMs assessed in 2020 that were not assessed in 2017 Strike: Non-CRMs in 2020 that were critical in 2017
The table below summarises the key changes in the 2020 CRMs list compared to the 2014 CRMs list. The 2020 assessment confirmed 19 CRMs from the 2014 list, whereas 8 of the non-critical materials in 2014 shifted to being critical in 2020.
2020 CRMs vs. 2014 CRMs
Antimony Indium Baryte Bismuth
Beryllium Lithium Bauxite Phosphorus
Borate Magnesium Hafnium Strontium
Cobalt Natural Graphite Natural Rubber
Coking Coal Niobium Scandium
Fluorspar PGMs Tantalum
Gallium Phosphate Rock Titanium Germanium Silicon Metal Vanadium
HREEs Tungsten
LREEs Legend
Black: CRMs in 2020 and 2014
Red: CRMs in 2020 that were not CRMs in 2014
Green: CRMs in 2020 that were not included in the assessment in 2014
The following tables present the major global supplier of the 2020 critical raw materials.
Table A presents the results for individual raw materials. Table B presents the averaged figures on global primary supply for the 3 material groups: HREEs, LREEs, and PGMs.
Table A: Major global supplier countries of CRMs – individual materials
Material Stage6
Main global
supplier Share Material Stage
Main global
supplier Share
1 Antimony E China 74% 23 Magnesium P China 89%
2 Baryte E China 38% 24 Natural
graphite E China 69%
3 Bauxite E Australia 28% 25 Natural rubber E Thailand 33%
4 Beryllium E USA 88% 26 Neodymium E China 86%
5 Bismuth P China 80% 27 Niobium P Brazil 92%
6 Borate E Turkey 42% 28 Palladium P Russia 40%
7 Cerium E China 86% 29 Phosphate rock E China 48%
8 Cobalt E Congo,DR 59% 30 Phosphorus P China 74%
9 Coking coal E China 55% 31 Platinum P S. Africa 71%
10 Dysprosium E China 86% 32 Praseodymium E China 86%
11 Erbium E China 86% 33 Rhodium P S. Africa 80%
12 Europium E China 86% 34 Ruthenium P S. Africa 93%
13 Fluorspar E China 65% 35 Samarium E China 86%
14 Gadolinium E China 86% 36 Scandium P China 66%
15 Gallium P China 80% 37 Silicon metal P China 66%
16 Germanium P China 80% 38 Tantalum E Congo,DR 33%
17 Hafnium P France 49% 39 Terbium E China 86%
18 Ho,Tm,Lu,Yb E China 86% 40 Titanium P China 45%
19 Indium P China 48% 41 Tungsten P China 69%
20 Iridium P S. Africa 92% 42 Vanadium E China 39%
21 Lanthanum E China 86% 43 Yttrium E China 86%
22 Lithium P Chile 44% 44 Strontium E Spain 31%
Legend
Stage E = Extraction stage P = Processing stage
HREEs Dysprosium, erbium, europium, gadolinium, holmium, lutetium, terbium, thulium, ytterbium, yttrium
LREEs Cerium, lanthanum, neodymium, praseodymium and samarium PGMs Iridium, palladium, platinum, rhodium, ruthenium
Table B: Major global supplier countries of CRMs – grouped materials (average)
Material Stage Main global supplier Share
HREEs E China 86%
LREEs E China 86%
PGMs7 (iridium, platinum, rhodium,
ruthenium) P South Africa 75%
PGMs (palladium) P Russian Federation 40%
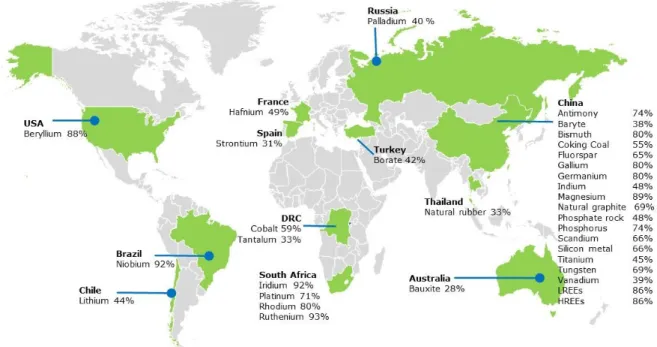
Figure B is the world map of the main global producers of the raw materials listed as critical for the EU in 2020.
6 Stage refers to the life-cycle stage of the material that the criticality assessment was carried out on:
extraction (E) or processing (P).
7 Calculating the average for the largest global supplier for all the PGMs is not possible because the major producing country is not the same for each of the five PGMs.
Figure B: Countries accounting for largest share of global supply of CRMs
An analysis of global supply confirms that China is the largest supplier of several critical raw materials. Other countries are also important global suppliers of specific materials.
For instance, Russia and South Africa are the largest global suppliers for platinum group metals, the USA for beryllium and Brazil for niobium.
Figure C: Main Global supply countries of CRMs8 (based on number of CRMs supplied, average 2012-2016)
In terms of the total number of CRMs, China is the major global supplier of 66% of the individual critical raw materials (Figure C). This includes all of the REEs and other critical raw materials such as magnesium, tungsten, antimony, gallium and germanium among others.
8 The figure should not be interpreted in terms of tonnage of CRM that originate from these countries, but in terms of the number of CRMs, for which the country is the main global supplier or producer of the CRM.
China, 66%
South Africa, 9%
Congo, DR, 5%
USA, 3%
Australia, 3%
Chile, 2%
Brazil, 2%
Turkey, 2%
France, 2%
Russia, 2%Spain, 2% Thailand, 2%
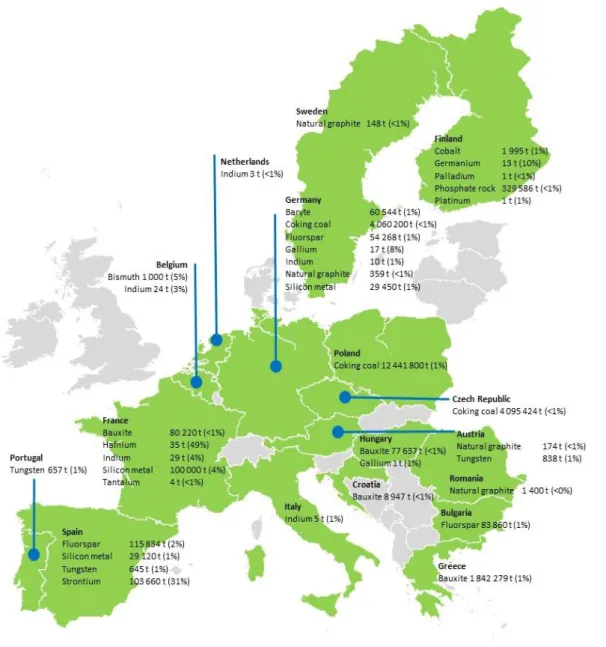
Figure D: EU producers of CRMs, in brackets shares of global supply, 2012- 20169
9 JRC elaboration on multiple sources
The following tables present the main countries from which the EU is sourcing critical raw materials (EU sourcing). Table C presents the results for individual raw materials. Table D presents the averaged figures for 3 material groups: HREEs, LREEs, and PGMs.
Table C: Major EU sourcing countries of CRMs – individual materials
Material Stage
10 Main EU
supplier Share Material Stage Main EU
supplier Share
1
Antimony E Turkey 62%23
Magnesium P China 93%2
Baryte E China 38%24
Natural graphite E China 47%3
Bauxite E Guinea 64%25
Natural Rubber E Indonesia 31%4
Beryllium E n/a n/a26
Neodymium P China 99%5
Bismuth P China 49%27
Niobium P Brazil 85%6
Borate E Turkey 98%28
Palladium P n/a n/a7
Cerium P China 99%29
Phosphate rock E Morocco 24%8
Cobalt E Congo,DR 68%30
Phosphorus P Kazakhstan 71%9
Coking coal E Australia 24%31
Platinum P n/a n/a10
Dysprosium P China 98%32
Praseodymium P China 99%11
Erbium P China 98%33
Rhodium P n/a n/a12
Europium P China 98%34
Ruthenium P n/a n/a13
Fluorspar E Mexico 25%35
Samarium P China 99%14
Gadolinium P China 98%36
Scandium P n/a n/a15
Gallium P Germany 35%37
Silicon metal P Norway 30%16
Germanium P Finland 51%38
Tantalum E Congo,DR 36%17
Hafnium P France 84%39
Terbium P China 98%18
Ho,Tm,Lu,Yb P China 98%40
Titanium P n/a n/a19
Indium P France 28%41
Tungsten P China 26%20
Iridium P n/a n/a42
Vanadium E n/a n/a21
Lanthanum P China 99%43
Yttrium P China 98%22
Lithium P Chile 78%44
Strontium E Spain100
% Legend
Stage E = Extraction stage P = Processing stage
HREEs Dysprosium, erbium, europium, gadolinium, holmium, lutetium, terbium, thulium, ytterbium, yttrium
LREEs Cerium, lanthanum, neodymium, praseodymium and samarium PGMs Iridium, palladium, platinum, rhodium, ruthenium
Table D: Major EU sourcing countries of CRMs – grouped materials (average)
Material Stage Main global supplier Share
HREEs P China 98%
LREEs P China 99%
PGMs P n/a n/a
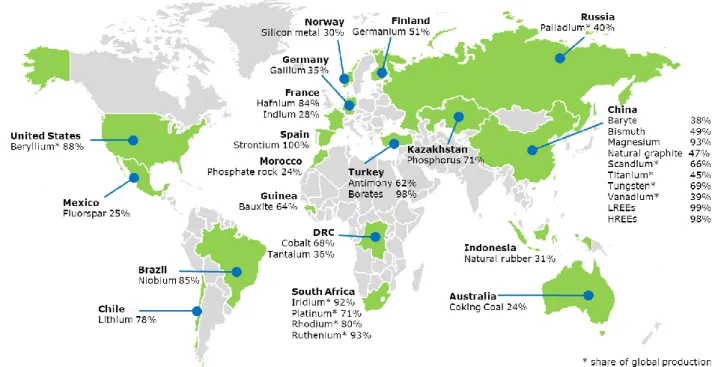
Figure E is the world map of the main countries from which the EU is sourcing critical raw materials (EU sourcing).
10 Stage refers to the life-cycle stage of the material that the criticality assessment was carried out on:
extraction (E) or processing (P).
Figure E: Countries accounting for largest share of EU sourcing of CRMs
Despite China being the largest global supplier for the majority of the critical raw materials, the EU sourcing (i.e. domestic production plus imports) paints sometimes a different picture (Figure E). The picture of EU sourcing lacks specific data for the five PGMs, titanium and beryllium. Although China is certainly a major EU supplier (44% of materials, in number, as shown in Figure F), several other countries represent main shares of the EU supply for specific critical raw materials, such as Brazil (niobium), Chile (lithium) and Mexico (fluorspar).
Figure F: Main EU suppliers of CRMs11 (based on number of CRMs supplied, average 2012-2016)
All raw materials, even if not considered critical, are important for the EU economy. The fact that a given material is classed as non-critical does not imply that availability and importance to the EU economy can be neglected. Moreover, the availability of new data and possible evolutions in EU and international markets may affect the list in the future.
11 The figure should not be interpreted in terms of tonnage of CRM that originate from the countries, but in terms of the number of CRMs, for which the country is the main supplier for the EU.
China, 44%
Congo, Dem. Rep., 6%
Turkey, 6%
France, 6%
Australia, 3%
Chile, 3%
Brazil, 3%
Spain, 3%
Indonesia, 3%
Mexico, 3%
Finland, 3%
Germany, 3%
Guinea, 3%
Kazakhstan, 3%
Morocco, 3%Norway, 3%
United Kingdom, 3%
TABLE OF CONTENTS
1. INTRODUCTION ... 12
1.1. Content and purpose of this report ... 12
1.2. Objectives of this report ... 12
1.3. The purpose of the list of critical raw materials ... 13
1.4. The importance of raw materials in Europe ... 14
1.5. The challenge of critical raw materials in Europe ... 16
1.6. Addressing critical raw material challenges ... 16
2. CRITICALITY ASSESSMENT APPROACH ... 18
2.1 Scope & materials covered ... 18
2.2 The EC criticality methodology ... 20
2.3 Data collection and sources ... 20
2.4 Stakeholder consultation ... 21
3. CRITICALITY ASSESSMENT OUTCOME ... 23
3.1 Criticality assessment results ... 23
3.2 2020 List of Critical Raw Materials... 28
3.3 Comparison with previous assessments ... 30
3.4 Key findings of the criticality assessments ... 32
3.5 Limitations of the criticality assessments ... 44
3.6 Recommendations for future assessments... 45
Abbreviations and glossary ... 48
Specific abbreviations for the materials covered ... 49
Glossary ... 50
ANNEXES ... 53
Overview of international criticality methodologies and assessments ... 53
Stages assessed and rationale ... 56
Additional details on the criticality assessment results ... 62
Substitution indexes ... 67
End uses, NACE2 sectors assignement ... 68
Global supply, trade-related varialble and WGI (2 stages). ... 88
EU Sourcing, trade-related varialble and WGI (2 stages). ... 116
Summary report of the stakeholder validation workshops ... 139
Key authors and contributors ... 152
LIST OF TABLES
Table 1: List of materials/groupings covered in the 2020 assessment ... 18
Table 2: List of materials covered by a double-stage supply risk assessment ... 19
Table 3: Scoring matrix to evaluate quality of EU supply data ... 21
Table 4: Criticality assessment results (individual materials, grouped materials) ... 23
Table 5: 2020 Critical raw materials for the EU ... 28
Table 6: Key changes to the 2020 list of CRMs compared to the 2017 CRMs list ... 30
Table 7: Materials identified as critical in 2011, 2014, 2017 and 2020 assessments ... 30
Table 8: Criticality assessment results for new materials ... 34
Table 9: Stages assessed as critical for the 2020 critical raw materials ... 35
Table 10: Global supply of the CRMs, individual materials ... 35
Table 11: Global supply of grouped CRMs, arithmetic average ... 36
Table 12: CRMs with China as the largest global supplier but not as largest EU supplier ... 38
Table 13: Materials with negative or zero Import reliance ... 43
Table 14: Summary of conclusions and recommendations ... 46
Table 16: Comparison of SR results based on scope of supply data used ... 62
Table 17: Comparison of 2020 results and previous assessments ... 64
Table 18: Individual and average EI and SR scores for material groups – LREEs, HREEs and PGMs ... 66
Table 19: Organisation of the stakeholder workshops ... 147
Table 20: Validation workshops attendance list ... 149
LIST OF FIGURES Figure 1: Main global suppliers of all candidate critical raw materials assessed, (based on number of raw materials supplied, average from 2012-2016) ... 15
Figure 2: Overall structure of the revised criticality methodology... 20
Figure 3: SR and EI results for the individual materials grouped as PGMs, LREEs and HREEs ... 25
Figure 4: SR and EI results, individual materials and grouped materials ... 26
Figure 5: SR and EI results for individual non-grouped and grouped materials (HREEs, LREEs and PGMs) ... 27
Figure 6: Criticality assessment results (individual materials and groups) ... 29
Figure 7: 2020 Criticality assessment results compared to the 2017 assessment ... 31
Figure 8: Main global suppliers of CRMs (based on number of CRMs supplied), average from 2012-2016 ... 37
Figure 9: Main EU sourcing countries of CRMs (based on number of CRMs supplied), average from 2012- 2016 (REEs 2016-2018). ... 37
Figure 10: Comparison of SR results based on scope of supply data used ... 39
Figure 11: Comparison of SR results based on scope of supply data used (double stage) ... 40
Figure 12: EOL-RIR ... 41
Figure 13: Import reliance ... 42
Figure 14 Frequency of appearance in criticality assessments and criticality determination (high, medium, or low) of materials (Schrijvers et al., 2019). ... 55
1. INTRODUCTION
1.1. CONTENT AND PURPOSE OF THIS REPORT
This joint GROW and JRC report ‘Study on the review of the list of Critical Raw Materials’
serves as the background document in support of the 2020 list of CRMs for the EU.
The present report is the result of intense cooperation with the Ad hoc Working Group on Defining Critical Raw Materials (AHWG12), consultants and key industry and scientific experts identified through the H2020 SCRREEN13 project.
This report includes information on the criticality assessments carried out on the materials covered for this 2020 exercise. Further information is presented in the materials factsheets14, for both critical and non-critical materials. These factsheets are provided as separate documents and are available in the EC's Raw Materials Information System (RMIS)15.
The present report is divided into the following chapters and annexes:
Chapter 1 – Introduction to the report: objectives and context of critical raw materials in Europe;
Chapter 2 – Criticality assessment approach: scope of the criticality assessments, application of the EC criticality methodology, data sources used and stakeholder consultation;
Chapter 3 – Criticality assessment outcome: results and key findings, comparison with previous assessments and limitations of the assessment results, conclusions and recommendations; and
Annexes – Additional supporting information on the methodology, international developments, quantitative assessment and related data, stakeholder consultations
1.2. OBJECTIVES OF THIS REPORT
This report presents the results of the assessment of the criticality of 83 raw materials for the EU based on the revised methodology developed by the European Commission (DG GROW and DG JRC)16. The report builds upon the work carried out in the previous assessments (201117, 201418 and 201719). The report takes into account feedback gathered from the previous and 2020 exercises, and in doing so, establishes the basis for the updated list of critical raw materials for the EU.
12 The AHWG on Defining Critical Raw Materials is a sub-group of the Raw Materials Supply Group expert group.
The list of its members and observers is available here:
http://ec.europa.eu/transparency/regexpert/index.cfm?do=groupDetail.groupDetail&groupID=1353
13 http://scrreen.eu/the-project/
14 The factsheets for critical and non-critical materials are provided as separate documents and are available through the RMIS. A total of 68 factsheets, corresponding to the 83 candidates (including both individual materials and groups) are included. The breakdown of the 68 factsheets are as follows:
64 individual material factsheets
1 individual factsheet for Aluminium (metal and bauxite)
1 individual factsheet for Phosphorus (phosphorus and phosphate rock)
1 grouped factsheet for the REEs (with sections dedicated to single elements)
1 grouped factsheet for the PGMs
15 https://rmis.jrc.ec.europa.eu/
16 Methodology for establishing the EU List of Critical Raw Materials, 2017, ISBN 978-92-79-68051-9
17 2011 assessment refers to the study on Critical Raw Materials for the EU published in 2010 and the Commission's Communication COM(2011)25 adopted in 2011.
18 2014 assessment refers to the study on Critical Raw Materials at EU level published in 2013 and the Commission's Communication COM(2014)297 adopted in 2014.
19 2017 assessment refers to the study on Critical Raw Materials at EU level published in 2016 and the Commission’s Communication COM(2017)0490 final adopted in 2017.
The operational objectives of this study were to:
Assess the criticality of a selection of raw materials based on the EC criticality methodology.
Analyse the production, key trends, trade flows and barriers of the raw materials with the aim to identify potential bottlenecks20 and supply risks throughout the value chain. To the extent possible, data and projections are based on the reference period of the last 5 years in terms of data availability.
Produce qualitative factsheets for all the raw materials assessed.
Produce full datasets, calculation sheets and comprehensive list of data sources in an excel-compatible format.
Continue to improve the quality and availability of data.
Cooperate with both EU and non-EU experts (where relevant) to improve the findings of the study.
Collaborate with the expert group 'Ad hoc Working Group on Defining Critical Raw Materials'21 and with the SCRREEN22 expert group.
In particular, the 2020 assessment incorporates the following aspects:
Analysis of a wider range of raw materials (5 new candidates);
Introduces a systematic two-stage supply chain assessment of the supply risk (mining/extracting and processing/refining stages);
Updated factsheets for each of the materials assessed to include information on the supply chain, the criticality assessment and future trends;
Optimise data quality and transparency, in respect to the hierarchy of data sources identified in the EC methodology, both in the assessments and factsheets; and
Better coordination with parallel efforts to develop further Material System Analyses23, as the priority data source for e.g. recycling data (EOL-RIR).
1.3. THE PURPOSE OF THE LIST OF CRITICAL RAW MATERIALS FOR THE EU The assessment and the list of critical raw materials are intended to flag the supply risks of important materials for the EU economy. They contribute to securing the competitiveness of the EU industrial value chains starting with raw materials in line with the EU industrial policy. This should increase the overall competitiveness of the EU economy, in line with the Commission´s priorities. It should also help incentivise the European production of critical raw materials and facilitate the launching of new mining and recycling activities. The list is also being used to help prioritise needs and actions.
For example, it serves as a supporting element when negotiating trade agreements, challenging trade distortion measures or promoting research and innovation actions.
It is also worth emphasising that all raw materials, even if not classed as critical, are important for the European economy and that a given raw material and its availability to the European economy should therefore not be neglected just because it is not classed as critical.
20 A bottleneck is considered to be the point in the value chain for a specific material where the supply risk is highest, i.e. the stage (either extraction/harvesting or processing/refining), that has the highest numerical criticality score for the Supply Risk.
21 The consultants have provided scientific and technical support to the Commission throughout the course of the study, incorporated relevant comments and feedback, provided updates on the advancement of the work, and presented the findings of the assessment in the final report of the study on "Critical Raw Materials for the EU" and the publication of the new list of Critical Raw Materials.
22 http://scrreen.eu/the-project/
23 As part of a broader project, JRC and GROW are current delevoping or updating the MSA of 14 raw materials
1.4. THE IMPORTANCE OF RAW MATERIALS IN EUROPE
In the last decade the growing challenge of securing access to metals and minerals needed for economic production has received increased attention from the public, economic actors and from politicians. Raw materials are not only essential for the production of a broad range of goods and services used in everyday life, but also for the development of emerging innovations, which are notably necessary for more eco-efficient technologies and globally competitive products.
The importance of metals and minerals to sustain businesses and the economy is particularly true for the EU, where about 30 million jobs24 are directly reliant on access to raw materials.
The importance of critical raw materials for the EU:
Industrial value chains - non-energy raw materials are linked to all industries across all supply chain stages.
Strategic technologies - technological progress and quality of life rely on access to a growing number of raw materials. For example, a smartphone might contain up to 50 different kinds of metals, all of which contribute to its small size, light weight and functionality.
Climate, energy and environment – raw materials are closely linked to clean technologies essential to reach carbon neutrality targets by 2050. They are irreplaceable in solar panels, wind turbines, electric vehicles, and energy efficient lighting.25
In Europe, the manufacturing industry (i.e. the production of end products and applications) and the refining industry (metallurgy, etc.) are often regarded as more important than the extractive industry (e.g. mining activities). Moreover, the value chain of raw materials is not fully and homogeneously covered by the European industry, with a pronounced imbalance between the upstream steps (extraction / harvesting) and the downstream steps (manufacturing and use). Nevertheless, the need for primary materials, such as ores and concentrates, and also for processed and refined materials is crucial for the wealth - even the survival - of the European industries and their associated jobs and economy.
Actually, very little extraction of non-energy raw materials occurs within European Member States, with e.g. the majority of ore and concentrates or refined materials or metals being sourced from non-European countries.
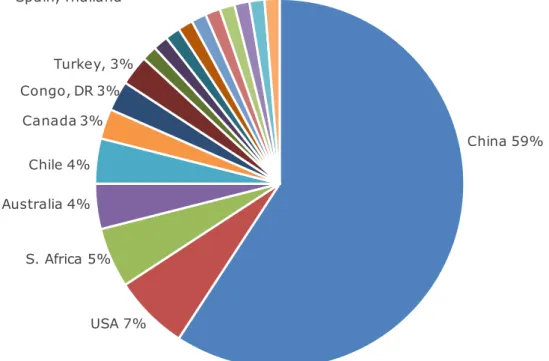
The following figure represents the main global producers of all candidate critical raw materials (in terms of number of raw materials, not in terms of tonnage). China clearly dominates, with 59% of the raw materials assessed26 being mainly extracted in China.
South Africa and USA are also the principal producer of the raw materials assessed.
24 https://ec.europa.eu/growth/sectors/raw-materials/specific-interest/critical_pl
25 https://ec.europa.eu/growth/sectors/raw-materials/specific-interest/critical_pl
26 Figures are based on the assessment results of individual candidate materials, with the exclusion of sapele wood. Sapele wood was excluded from the analysis of primary global supply because it was not clear from available public EU trade data, which country(s) is the major global supplier. Several producing countries of sapele wood were identified such as Cameroon, Democratic Republic of Congo (Kinshasa), the Republic of Congo (Brazzaville), the Central African Republic, Ivory coast and Gabon, however without a clear indication of the overall shares coming from these producing countries.
Figure 1: Main global suppliers of all candidate critical raw materials assessed, (based on number of raw materials supplied, average from 2012-2016)27
For many raw materials, the EU is absent from the upstream steps of the value chain, with no extraction of e.g. antimony, beryllium, bismuth, borates, molybdenum, niobium, PGMs, rare earths, tantalum, titanium, vanadium and zirconium. This may be due either to the absence of mineral deposits in the EU, or more often the limited knowledge of the availability of those materials in the EU, or to economic and societal factors that negatively affect exploration (for deposit discovery and characterisation, estimation of resources and reserves) or extraction, (closure of existing mines, reluctance to open new mines, etc.). The biotic materials natural rubber, sapele and natural teak wood come from tropical plants. Their production therefore also lies entirely outside the EU. To access these raw materials, the European Member States have no other choice than to import them, either unprocessed or refined, from other countries to feed their industries and markets.
The only few raw materials for which an EU Member State is the main global producer are hafnium (France), strontium (Spain), natural cork (Portugal) and perlite (Greece).
For some raw materials such as e.g. aggregates, feldspar, gypsum, hafnium, indium, kaolin clay, limestone (high purity), magnesite, natural cork, perlite, silica sand, sulphur, the Member States produce enough primary materials to avoid significant extra-European
27 Figures are based on the assessment results of 78 individual materials, rather than 80 due to the exclusion of sapele wood and limestone. Sapele wood was excluded from the analysis of primary global supply because it was not clear from available public EU trade data, which country(s) is the major global supplier. Several producing countries of sapele wood were identified such as Cameroon, Democratic Republic of Congo (Kinshasa), the Republic of Congo (Brazzaville), the Central African Republic, Ivory Coast and Gabon, however without a clear indication of the overall shares coming from these producing countries. Also Aggregates and Hydrogen are excluded because global production is not available.
China 59%
USA 7%
S. Africa 5%
Australia 4%
Chile 4%
Canada 3%
Congo, DR 3%
Turkey, 3%
1% countries: Brazil, France, Greece, India, Indonesia, Mexico, Portugal, Russia,
Spain, Thailand
Global suppliers of all candidate critical raw materials (% based on number of raw materials supplied)
imports. However, this situation is fairly uncommon, with the EU being dependent on foreign imports for more than 80% of the raw materials needed for its industry and economy.
1.5. THE CHALLENGE OF CRITICAL RAW MATERIALS IN EUROPE
The dynamic technological changes and the rapid growth of emerging economies have led to an increasing, though sometimes volatile, demand for several metals and minerals.
Securing access to a stable supply of such critical raw materials has become a major challenge for national and regional economies with limited indigenous natural resources, such as the EU economy, which is heavily dependent on imported supplies of many minerals and metals needed by industry.
Many of these materials are currently only extracted in a few countries, with China being the leading supplier as well as consumer of several important raw materials e.g.
antimony, bismuth, magnesium, REEs, etc. This increases the risk of supply shortages and supply vulnerability along the value chain.
The likelihood of supply disruption is further increased by the fact that processing, smelting and refining of many metals are also concentrated in a small number of countries. On top of high concentration, some producing countries strictly control and limit the export of raw materials, intermediates and/or metals in order to safeguard them for their national industries, by imposing a number of export restriction measures that are often considered as distortive to free markets.
Supply restrictions can bring negative consequences to all the actors of the supply chain, as they have an influence on the supply conditions and price volatility. Mine production of minerals and metals often relies on large scale investment projects, which can take many years to implement, and, therefore, cannot react quickly to short term changes in demand, or are vulnerable to market manipulations by established suppliers trying to hamper emerging mining operations.
These factors together lead to a risk of supply shortages for various metals and minerals in the EU. The resources known to exist in the EU are not used well to provide adequate and timely supplies of these materials to meet domestic demand. The impact of raw materials supply disruption could therefore be loss of competitive economic activity in the EU and in some specific cases reduced availability of certain (strategic) final products.
1.6. ADDRESSING CRITICAL RAW MATERIAL CHALLENGES
The Raw Materials Initiative and the Identification of Critical Raw Materials To address the growing concern of securing valuable raw materials for the EU economy, the European Commission launched the European Raw Materials Initiative28 in 2008. It is an integrated strategy that establishes targeted measures to secure and improve access to raw materials for the EU:
Fair and sustainable supply of raw materials from international markets;
Fostering sustainable supply within the EU; and
Boosting resource efficiency and promoting recycling.
For the successful implementation of EU policies in the field of raw materials, there is a need to know the key raw materials for the European economy, understand their stocks and flows and the market and to identify the supply bottlenecks.
One of the priority actions of the European Raw Materials Initiative was to establish a list of critical non-energy raw materials (CRMs) at EU level.
CRMs combine a high economic importance to the EU with a high risk of supply disruptions. In this context, the European Commission established an Ad Hoc Working
28 https://ec.europa.eu/growth/sectors/raw-materials/policy-strategy_en
Group on Defining Critical Raw Materials (AHWG) in 2009 as support and advisory group in identifying the non-energy raw materials considered as critical for the EU. The first report of this group, published in 2010, ‘Critical raw materials for the EU’, among its many valuable conclusions, suggested that the list of critical raw materials should be updated every three years. Accordingly, in its Communication 'Tackling the challenges in commodity markets and on raw materials' (COM(2011)25), the Commission committed to undertake a regular update of the list at least every three years. Regular revisions of the first assessment were carried out and resulted in the 2014 and 2017 list. The 2020 assessment addresses the fourth list of critical raw materials for the EU.
The methodology to identify CRMs
The identification of critical raw materials for the EU is based on the methodology developed and updated by the European Commission, in cooperation with the Ad hoc Working Group on Defining Critical Raw Materials (AHWG). Based on the methodology used in the assessments carried out in 2011 and 2014, the EC's Directorate-General for Internal Market, Industry, Entrepreneurship and SMEs (DG GROW) established an internal Administrative Arrangement with the EC's DG Joint Research Centre (DG JRC) in 2015 to undertake a study on improving the assessment methodology used to define critical raw materials for the EU. This study resulted in a refined methodology for assessing the criticality of raw materials, which was applied in the 2017 and this 2020 assessment. The revised EC methodology introduced some targeted methodological improvements while keeping maximum possible comparability of the results with the previous assessments. The two main high-level components of criticality were retained:
Economic Importance (EI) - calculated based on the importance of a given material in the EU for end-use applications and on the performance of its substitutes in these applications.
Supply Risk (SR) - calculated based on factors that measure the risk of disruptions in supply of a given material (e.g. supply concentration, import reliance, governance performance measured by the World Governance Indicators, trade restrictions and agreements, existence and criticality of substitutes)
2. CRITICALITY ASSESSMENT APPROACH
2.1 SCOPE & MATERIALS COVERED
The scope of this criticality assessment includes assessment of the 83 individual materials listed in Table 1. To facilitate coherence, all materials from previous assessments are included (with the exception of osmium29). This allows for the identification of any key materials that may move from the non-critical to critical status or vice versa.
Table 1: List of materials/groupings covered in the 2020 assessment Legend:
Green boxes = Materials covered in 2014 but not in the 2011 assessments Orange boxes = Materials covered in 2017 but not in the 2014 assessments Light blue boxes = New materials covered in the 2020 assessment
Individual materials
Aggregates Germanium Phosphate rock
Aluminium Hafnium Rhenium
Antimony Helium Scandium
Arsenic Hydrogen Selenium
Baryte Indium Sulphur
Bauxite Iron Ore Potash
Bentonite Lead Silica Sand
Beryllium Limestone Silicon Metal
Bismuth Gold Silver
Boron (Borates) Gypsum Strontium
Cadmium Lithium Talc
Chromium Magnesite Tantalum
Kaolin clay Magnesium Tellurium
Cobalt Manganese Tin
Coking coal Molybdenum Titanium
Copper Natural Graphite Tungsten
Diatomite Nickel Vanadium
Feldspar Niobium Zinc
Fluorspar Perlite Zirconium
Gallium Phosphorus
Platinum group metals (PGMs)
Iridium Platinum Ruthenium
Palladium Rhodium
Rare earth elements (REEs)
LREEs HREEs
Cerium Dysprosium Lutetium
Lanthanum Erbium Terbium
Neodymium Europium Thulium
Praseodymium Gadolinium Ytterbium
Samarium Holmium Yttrium
Biotic materials
Natural Rubber Natural cork
Sapele wood Natural Teak wood
29 Osmium was nominally assessed in 2011 and 2014 as part of the PGM group; however it cannot be assessed in its own right because of the lack of data specific to osmium. It was, therefore, excluded from the 2017 and 2020 exercises. Complementary information on osmium is provided in the PGMs factsheet.
In addition to covering the same materials as previous assessments, the candidate materials assessed in the 2020 exercise also include five new materials30 with the aim of widening the scope of the materials covered.
2.1.1 Bottleneck screening vs Double stage (changes 2017 2020)
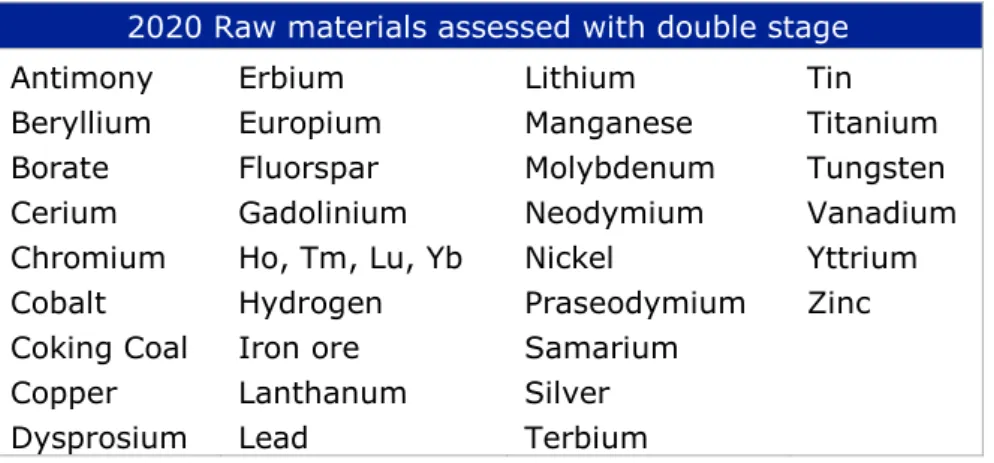
The bottleneck screening in the 2017 exercise generated some discussion with stakeholders on which was the true bottleneck. In some cases (e.g. cobalt) some experts indicated the processing stage as the one with higher supplier concentration, whereas the numerical assessment pointed to the extraction stage as the one with the higher risk. For the 2020 exercise it was decided to systematically include a double-stage supply risk assessment for those materials where two clear stages could be identified and where an initial analysis revealed the likely existence of the necessary data; see Table 2. The bottleneck could then be more readily identified.
Table 2: List of materials covered by a double-stage supply risk assessment 2020 Raw materials assessed with double stage
Antimony Erbium Lithium Tin
Beryllium Europium Manganese Titanium
Borate Fluorspar Molybdenum Tungsten
Cerium Gadolinium Neodymium Vanadium
Chromium Ho, Tm, Lu, Yb Nickel Yttrium
Cobalt Hydrogen Praseodymium Zinc
Coking Coal Iron ore Samarium
Copper Lanthanum Silver
Dysprosium Lead Terbium
In accordance to the EC methodology, the stage with higher Supply Risk (SR) score has been used. For the remaining candidate materials, the assessment of the calculation risk was performed with the same approach and in the same stage in the supply chain as in 2017.
Annex 2 provides further information on the stage assessed and the rationale.
2.1.2 Time coverage
The reference period for data used in the assessments is the 5-year average for 2012- 2016, where possible. Exceptions to this are clearly stated and justified in the individual factsheets.
30 Arsenic, Cadmium, Hydrogen, Strontium, Zirconium
2.2 THE EC CRITICALITY METHODOLOGY
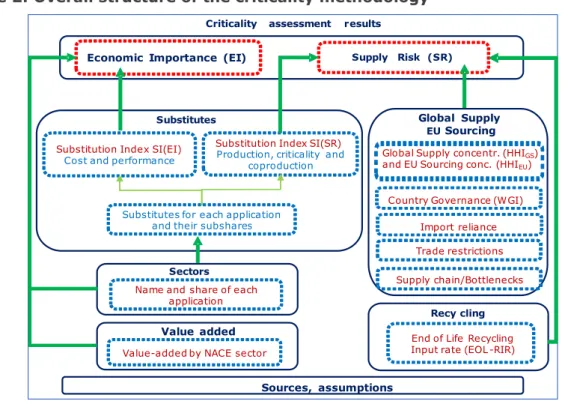
An overview of the EC's criticality methodology31 is reported in Figure 2.
Two main parameters form the basis of the updated methodology: Economic Importance (EI) and Supply Risk (SR).
Figure 2: Overall structure of the criticality methodology32
The 2020 assessment applies consistently the EC criticality methodology, while ensuring comparability with the previous methodology used in 2011, 2014 and 2017.
There are several updates compared to the 2017 implementation of the revised methodology33:
Identification of the bottlenecks for these two stages: systematic calculation of the supply risk for 36 candidate CRMs for both mining/extracting and processing/refining stages;
More consistent application of the data source hierarchy in all calculations;
Substantial improvement of End-of-Life Recycling Input Rate (EOL-RIR) results using higher quality EU based data (14 new Material System Analyses - MSA);
2.3 DATA COLLECTION AND SOURCES
The availability and quality of the data required to complete the criticality assessment are essential to ensure the robustness and comparability of the results and to maximise the quality of the outputs of the study. A detailed list of the sources used in the criticality assessments are provided in each of the material factsheets.
31 Methodology for establishing the EU List of Critical Raw Materials, 2017, ISBN 978-92-79-68051-9
32 Study on the review of the list of critical raw materials, 2017, ISBN 978-92-79-47937-3
33 Further details in Methodology for establishing the EU List of Critical Raw Materials, 2017, ISBN 978-92-79- 68051-9.
Economic Importance (EI) Supply Risk (SR) Criticality assessment results
Substitution Index SI(EI) Cost and performance
Substitution Index SI(SR) Production, criticality and
coproduction Substitutes
Substitutes for each application and their subshares
Name and share of each application Sectors
Value-added by NACE sector
Value added End of Life Recycling
Input rate (EOL -RIR) Recy cling
Sources, assumptions
Global Supply concentr. (HHIGS) and EU Sourcing conc. (HHIEU)
Global Supply
Trade restrictions EU Sourcing
Country Governance (WGI)
Supply chain/Bottlenecks Import reliance
The revised criticality methodology includes a data hierarchy that prioritises, first, official EU and Member States data over those from trade/industry associations and other special interest groups. Where possible, it also prioritises the use of data for Europe over datasets that relate to the whole world e.g. global data. In other words, European data shall receive priority over non-EU data. Data from organisations such as the United States Geological Survey (USGS) are used in the cases where no other comparable sources exist or where the alternatives are not of acceptable quality. Data from private sources (industry, trade associations, private data providers etc.) may also be considered in the absence of other data, under the condition that such data can be shared and published.
Regarding the overall availability and quality of the data sources, in general, there is good public data availability for global supply (e.g. from the World Mining Database and British Geological Survey). However, there are some materials that are more difficult to deal with because of material inconsistencies between world production and EU sourcing data. In addition, there is a general difficulty obtaining public data on the shares of applications of materials, as well as their substitutes. Stakeholders were therefore consulted to validate or provide additional inputs regarding the data used for the assessments.
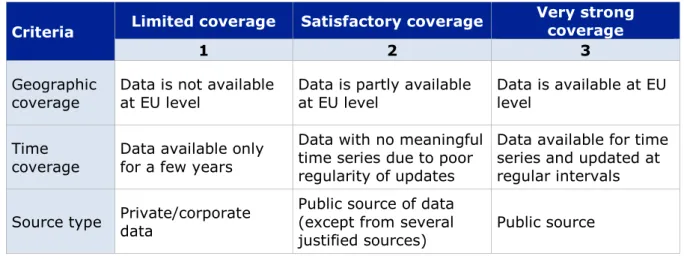
Table 3 presents the scoring matrix used based on the recommendations of the Commission to assess the quality of EU data on EU Supply Risk. The scoring matrix defines three main criteria using a scoring scale of 1 to 3 (from lowest to highest in terms of data quality). The overall score of the data quality used for the calculation of Supply Risk was characterised as: limited, satisfactory or very strong coverage based on the individual scores of the three main criteria. Sources used in the factsheets are provided at the end of each material or group factsheet. Additional details on the quality of the data sources are provided in the individual material factsheets and in the EC’s Background Report on the Assessment of the Methodology on the list of Critical Raw Materials34.
Table 3: Scoring matrix to evaluate quality of EU supply data
Criteria Limited coverage Satisfactory coverage Very strong coverage
1 2 3
Geographic
coverage Data is not available
at EU level Data is partly available
at EU level Data is available at EU level
Time
coverage Data available only for a few years
Data with no meaningful time series due to poor regularity of updates
Data available for time series and updated at regular intervals
Source type Private/corporate data
Public source of data (except from several
justified sources) Public source
2.4 STAKEHOLDER CONSULTATION
In addition to the use of data sources described in the previous section, the involvement of stakeholders was of utmost importance in order to maximise the quality of the outputs of the study and to ensure transparency. By involving all relevant industry stakeholders and members of the AHWG, the assessment results reflect the body of knowledge available throughout the EU on the topic of raw materials.
34 JRC technical report (2017): Assessment of the methodology for establishing the EU list of Critical Raw Materials: «Background Report», ISBN 978-92-79-69612-1, available at the JRC Science Hub:
https://ec.europa.eu/jrc
The aim of the stakeholder consultation was to ensure that industrial and scientific stakeholders are given the opportunity to provide their expert feedback on specific materials and eventually improve the results. Consultation with stakeholders ensures that the outcomes of this study, especially the conclusions, are optimally validated and subsequently disseminated and applied, where relevant.
In addition to bilateral exchanges during the data collection for the criticality assessment, a key aspect of the overall stakeholder consultation approach includes the stakeholder data collection and validation workshops co-organised with the Horizon 2020 project SCRREEN. These workshops were aimed to collect and review the data used for the purpose of criticality calculations and information used in the factsheets. The stakeholder workshops also provided the opportunity to present the data sources used and contributions delivered by stakeholders as well as to discuss any recommendations to improve results.
The stakeholder data collection and validation workshops took place on 10, 11 and 12 September 2019. The aim of these stakeholder workshops was to discuss in detail the criticality calculations for each of the materials covered and to review and validate the data used in criticality assessments. Experts were also asked to contribute to relevant sections of the factsheets.
Several follow-up actions were carried out after the workshops, which included a summary of key stakeholder feedback received from the validation workshops and follow- up with individual stakeholders who indicated willingness and capability to contribute relevant data and input for the criticality assessments. Based on this feedback, some of the criticality assessments were improved while others were consolidated with more accurate data. A summary report of the stakeholder validation workshops is provided in Annex 8 and includes details of the preparation and organisation of the workshops as well as the list of participants.
3. CRITICALITY ASSESSMENT OUTCOME
3.1 CRITICALITY ASSESSMENT RESULTS
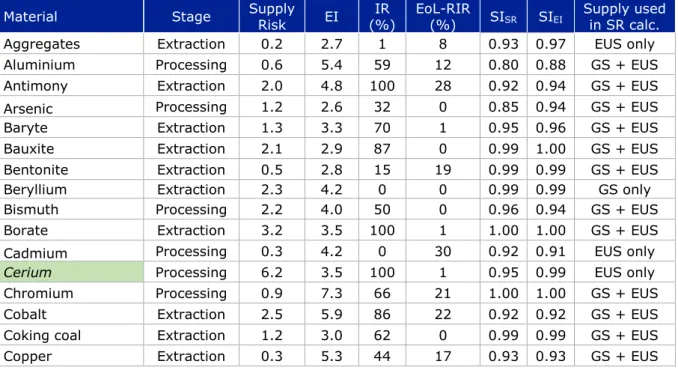
Table 4 summarises the criticality assessment results for the 83 individual candidate materials covered by the assessment.
Table 4 provides the scaled results of the Supply Risk (SR), Economic Importance (EI), Import Reliance (IR) and End-of-life Recycling Input Rate (EOL-RIR) for each of the candidate materials as well as the life cycle stage assessed. Results are rounded to one decimal point to enhance clarity. The table also indicates the supply data that was used (e.g. global supply and / or EU sourcing) in the calculations for Supply Risk. Annexes provide additional details of the assessment results, including substitution indexes and all other parameters.
Regarding the materials with negative import reliance, i.e. in case of net export, or IR=0, it should be noted that the SR is calculated based on EU sourcing only (except cases with inadequate quality data). Further details on negative import reliance results are provided (see section 3.4.2).
Table 4: Criticality assessment results (individual35 materials, grouped materials)
Legend:
PGMs Iridium, palladium, platinum, rhodium, ruthenium
LREEs Cerium, lanthanum, neodymium, praseodymium and samarium
HREEs Dysprosium, erbium, europium, gadolinium, holmium, lutetium, terbium, thulium, ytterbium, yttrium
EOL-RIR End-of-life Recycling Input Rate
Supply data used Indicates whether the Supply Risk calculation uses EU sourcing (EU only), global supply only (GS) or both (GS + EU)36
Material Stage Supply
Risk EI IR (%)
EoL-RIR
(%) SISR SIEI Supply used in SR calc.
Aggregates Extraction 0.2 2.7 1 8 0.93 0.97 EUS only Aluminium Processing 0.6 5.4 59 12 0.80 0.88 GS + EUS Antimony Extraction 2.0 4.8 100 28 0.92 0.94 GS + EUS
Arsenic Processing 1.2 2.6 32 0 0.85 0.94 GS + EUS
Baryte Extraction 1.3 3.3 70 1 0.95 0.96 GS + EUS
Bauxite Extraction 2.1 2.9 87 0 0.99 1.00 GS + EUS
Bentonite Extraction 0.5 2.8 15 19 0.99 0.99 GS + EUS
Beryllium Extraction 2.3 4.2 0 0 0.99 0.99 GS only
Bismuth Processing 2.2 4.0 50 0 0.96 0.94 GS + EUS
Borate Extraction 3.2 3.5 100 1 1.00 1.00 GS + EUS
Cadmium Processing 0.3 4.2 0 30 0.92 0.91 EUS only
Cerium Processing 6.2 3.5 100 1 0.95 0.99 EUS only Chromium Processing 0.9 7.3 66 21 1.00 1.00 GS + EUS
Cobalt Extraction 2.5 5.9 86 22 0.92 0.92 GS + EUS
Coking coal Extraction 1.2 3.0 62 0 0.99 0.99 GS + EUS
Copper Extraction 0.3 5.3 44 17 0.93 0.93 GS + EUS
35 80 rows, because Ho, Tm, Lu, Yb are grouped
36 By default, both EU and global sources are used in the calculation. In case only either EU or global supply was used, data availability prevented to use both sourcing types.
Material Stage Supply
Risk EI IR
(%) EoL-RIR
(%) SISR SIEI Supply used in SR calc.
Diatomite Extraction 0.5 2.2 0 4 0.96 0.96 GS + EUS Dysprosium Processing 6.2 7.2 100 0 0.95 1.00 EUS only Erbium Processing 6.1 3.1 100 1 0.96 0.99 EUS only Europium Processing 3.7 3.3 100 38 0.79 0.95 EUS only Feldspar Extraction 0.8 2.8 34 8 0.99 0.99 GS + EUS Fluorspar Extraction 1.2 3.3 66 1 0.89 0.88 GS + EUS Gadolinium Processing 6.1 4.6 100 1 0.92 0.99 EUS only
Gallium Processing 1.3 3.5 31 0 0.98 0.98 GS + EUS
Germanium Processing 3.9 3.5 31 2 0.95 0.95 GS only
Gold Extraction 0.2 2.1 n/a 29 0.98 0.99 GS only
Gypsum Extraction 0.5 2.6 0 1 0.88 0.96 EUS only
Hafnium Processing 1.1 3.9 0 0 0.91 0.96 GS only
Helium Processing 1.2 2.6 89 1 0.94 0.96 GS + EUS
Ho, Tm, Lu, Yb Processing 6.1 3.4 100 1 1.00 1.00 EUS only
Hydrogen Extraction 0.4 3.8 0 0 1.00 1.00 GS + EUS
Indium Processing 1.8 3.3 0 0 0.97 0.98 GS only
Iridium Processing 3.2 4.2 100 14 0.91 0.95 GS only Iron ore Extraction 0.5 6.8 72 31 0.93 0.95 GS + EUS Kaolin clay Extraction 0.4 2.4 20 1 0.96 0.97 GS + EUS Lanthanum Processing 6.0 1.5 100 1 0.89 0.97 EUS only
Lead Extraction 0.1 4.0 15 75 0.96 0.96 GS + EUS
Limestone Extraction 0.2 3.5 5 19 0.90 0.98 GS + EUS Lithium Processing 1.6 3.1 100 0 0.93 0.93 GS + EUS Magnesite Extraction 0.6 3.2 0 2 0.98 0.99 GS + EUS Magnesium Processing 3.9 6.6 100 13 0.93 0.94 GS + EUS Manganese Extraction 0.9 6.7 90 8 1.00 1.00 GS + EUS Molybdenum Extraction 0.9 6.2 100 30 1.00 1.00 GS + EUS Natural cork Extraction 1.0 1.6 0 8 0.91 0.91 GS + EUS Natural graphite Extraction 2.3 3.2 98 3 0.99 0.99 GS + EUS Natural Rubber Extraction 1.0 7.1 100 1 0.99 0.99 GS + EUS Natural Teak wood Extraction 1.9 2.0 100 0 0.90 0.90 GS + EUS Neodymium Processing 6.1 4.8 100 1 0.93 0.98 EUS only
Nickel Extraction 0.5 4.9 28 17 0.83 0.90 GS + EUS
Niobium Processing 3.9 6.0 100 0 0.97 0.98 GS + EUS Palladium Processing 1.3 7.0 93 28 0.92 0.98 GS only
Perlite Extraction 0.4 2.3 0 42 0.88 0.92 GS only
Phosphate rock Extraction 1.1 5.6 84 17 1.00 1.00 GS + EUS Phosphorus Processing 3.5 5.3 100 0 1.00 1.00 GS + EUS Platinum Processing 1.8 5.9 98 25 0.85 0.98 GS only
Potash Extraction 0.8 5.4 27 0 1.00 1.00 GS + EUS
Praseodymium Processing 5.5 4.3 100 10 0.93 0.97 EUS only
Rhenium Processing 0.5 2.0 22 50 0.98 1.00 GS only
Rhodium Processing 2.1 7.4 100 28 0.99 0.99 GS only Ruthenium Processing 3.4 4.1 100 11 0.92 0.96 GS only Samarium Processing 6.1 7.3 100 1 0.98 0.98 EUS only Sapele wood Extraction 2.3 1.4 100 0 0.94 0.94 EUS only Scandium Processing 3.1 4.4 100 0 1.00 0.95 GS only
Selenium Processing 0.4 4.9 9 1 0.90 0.95 GS + EUS
Silica sand Extraction 0.4 2.9 0 18 0.97 0.97 GS + EUS Silicon metal Processing 1.2 4.2 63 0 0.99 0.99 GS + EUS
Silver Extraction 0.7 4.1 40 19 0.95 0.97 GS + EUS
Material Stage Supply
Risk EI IR
(%) EoL-RIR
(%) SISR SIEI Supply used in SR calc.
Strontium Extraction 2.6 3.5 0 0 0.93 0.90 EUS only
Sulphur Processing 0.3 4.1 0 5 0.99 0.99 EUS only
Talc Extraction 0.4 4.0 13 16 0.98 0.99 GS + EUS
Tantalum Extraction 1.4 4.0 99 0 0.95 0.96 GS only
Tellurium Processing 0.5 3.6 0 1 0.86 0.93 EUS only Terbium Processing 5.5 4.1 100 6 0.79 0.95 EUS only
Tin Extraction 0.9 4.2 0 31 0.90 0.91 GS only
Titanium Processing 1.3 4.7 100 19 0.92 0.96 GS only Tungsten Processing 1.6 8.1 n/a 42 0.95 0.98 GS only Vanadium Extraction 1.7 4.4 n/a 2 0.98 0.99 GS only Yttrium Processing 4.2 3.5 100 31 0.98 0.99 EUS only
Zinc Extraction 0.3 5.4 60 31 0.93 0.96 GS + EUS
Zirconium Extraction 0.8 3.2 100 12 0.96 0.97 GS + EUS
Group averages Stage Supply
Risk EI IR
(%) EOL-RIR
(%) SISR SIEI Supply used in SR calc.
LREEs Processing 6.0 4.3 100 3 0.94 0.98
EUS only
HREEs Processing 5.6 3.9 100 8 0.94 0.99
PGMs Processing 2.4 5.7 98 21 0.92 0.97 GS only Figure 3 presents the individual results for the grouped materials. The grey dots in Figure 3 represents the average scores for the platinum group metals (PGMs), the light green dot indicates the average result for the light rare earth metals (LREEs) and the dark green dot presents the heavy rare earth metals (HREEs).
Figure 3: SR and EI for individual materials grouped as PGMs, LREEs and HREEs
Figure 4 presents the Supply Risk and Economic Importance results for all the individual raw materials. Figure 5 presents the individual results for all non-grouped materials, as well as the average SR and EI scores for the PGMs, LREEs and HREEs groups.
Dysprosium Erbium
Europium
Gadolinium Ho, Tm, Lu, Yb
Terbium
Yttrium Cerium
Lanthanum Neodymium
Praseodymium
Samarium
Iridium
Palladium Platinum
Rhodium Ruthenium
1 2 3 4 5 6 7 8 9
0 1 2 3 4 5 6 7
Economic Importance
Supply Risk